
Daily Updates
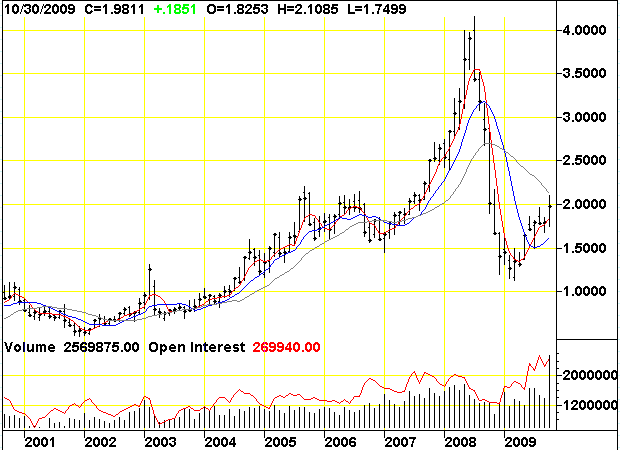
Natural gas is a gas consisting primarily of methane. It is found associated with fossil fuels, in coal beds, as methane clathrates, and is created by methanogenic organisms in marshes, bogs, and landfills. It is an important fuel source, a major feedstock for fertilizers, and a potent greenhouse gas. – Definition from
America’s Natural Gas Revolution
The biggest energy innovation of the decade is natural gas—more specifically what is called “unconventional” natural gas. Some call it a revolution.
Yet the natural gas revolution has unfolded with no great fanfare, no grand opening ceremony, no ribbon cutting. It just crept up. In 1990, unconventional gas—from shales, coal-bed methane and so-called “tight” formations—was about 10% of total U.S. production. Today it is around 40%, and growing fast, with shale gas by far the biggest part.
The potential of this “shale gale” only really became clear around 2007. In Washington, D.C., the discovery has come later—only in the last few months. Yet it is already changing the national energy dialogue and overall energy outlook in the U.S.—and could change the global natural gas balance.
From the time of the California energy crisis at the beginning of this decade, it appeared that the U.S. was headed for an extended period of tight supplies, even shortages, of natural gas.
While gas has many favorable attributes—as a clean, relatively low-carbon fuel—abundance did not appear to be one of them. Prices had gone up, but increased drilling failed to bring forth additional supplies. The U.S., it seemed, was destined to become much more integrated into the global gas market, with increasing imports of liquefied natural gas (LNG).
But a few companies were trying to solve a perennial problem: how to liberate shale gas—the plentiful natural gas supplies locked away in the impermeable shale. The experimental lab was a sprawling area called the Barnett Shale in the environs of Fort Worth, Texas.
View Full Image
Getty Images
The companies were experimenting with two technologies. One was horizontal drilling. Instead of merely drilling straight down into the resource, horizontal wells go sideways after a certain depth, opening up a much larger area of the resource-bearing formation.
The other technology is known as hydraulic fracturing, or “fraccing.” Here, the producer injects a mixture of water and sand at high pressure to create multiple fractures throughout the rock, liberating the trapped gas to flow into the well.
The critical but little-recognized breakthrough was early in this decade—finding a way to meld together these two increasingly complex technologies to finally crack the shale rock, and thus crack the code for a major new resource. It was not a single eureka moment, but rather the result of incremental experimentation and technical skill. The success freed the gas to flow in greater volumes and at a much lower unit cost than previously thought possible.
In the last few years, the revolution has spread into other shale plays, from Louisiana and Arkansas to Pennsylvania and New York State, and British Columbia as well.
The supply impact has been dramatic. In the lower 48, states thought to be in decline as a natural gas source, production surged an astonishing 15% from the beginning of 2007 to mid-2008. This increase is more than most other countries produce in total.
Equally dramatic is the effect on U.S. reserves. Proven reserves have risen to 245 trillion cubic feet (Tcf) in 2008 from 177 Tcf in 2000, despite having produced nearly 165 Tcf during those years. The recent increase in estimated U.S. gas reserves by the Potential Gas Committee, representing both academic and industry experts, is in itself equivalent to more than half of the total proved reserves of Qatar, the new LNG powerhouse. With more drilling experience, U.S. estimates are likely to rise dramatically in the next few years. At current levels of demand, the U.S. has about 90 years of proven and potential supply—a number that is bound to go up as more and more shale gas is found.
To have the resource base suddenly expand by this much is a game changer. But what is getting changed?
It transforms the debate over generating electricity. The U.S. electric power industry faces very big questions about fuel choice and what kind of new generating capacity to build. In the face of new climate regulations, the increased availability of gas will likely lead to more natural gas consumption in electric power because of gas’s relatively lower CO2 emissions. Natural gas power plants can also be built more quickly than coal-fired plants.
Some areas like Pennsylvania and New York, traditionally importers of the bulk of their energy from elsewhere, will instead become energy producers. It could also mean that more buses and truck fleets will be converted to natural gas. Energy-intensive manufacturing companies, which have been moving overseas in search of cheaper energy in order to remain globally competitive, may now stay home.
But these industrial users and the utilities with their long investment horizons—both of which have been whipsawed by recurrent cycles of shortage and surplus in natural gas over several decades—are inherently skeptical and will require further confirmation of a sustained shale gale before committing.
More abundant gas will have another, not so well recognized effect—facilitating renewable development. Sources like wind and solar are “intermittent.” When the wind doesn’t blow and the sun doesn’t shine, something has to pick up the slack, and that something is likely to be natural-gas fired electric generation. This need will become more acute as the mandates for renewable electric power grow.
So far only one serious obstacle to development of shale resources across the U.S. has appeared—water. The most visible concern is the fear in some quarters that hydrocarbons or chemicals used in fraccing might flow into aquifers that supply drinking water. However, in most instances, the gas-bearing and water-bearing layers are widely separated by thousands of vertical feet, as well as by rock, with the gas being much deeper.
Therefore, the hydraulic fracturing of gas shales is unlikely to contaminate drinking water. The risks of contamination from surface handling of wastes, common to all industrial processes, requires continued care. While fraccing uses a good deal of water, it is actually less water-intensive than many other types of energy production.
Unconventional natural gas has already had a global impact. With the U.S. market now oversupplied, and storage filled to the brim, there’s been much less room for LNG. As a result more LNG is going into Europe, leading to lower spot prices and talk of modifying long-term contracts.
But is unconventional natural gas going to go global? Preliminary estimates suggest that shale gas resources around the world could be equivalent to or even greater than current proven natural gas reserves. Perhaps much greater. But here in the U.S., our independent oil and gas sector, open markets and private ownership of mineral rights facilitated development. Elsewhere development will require negotiations with governments, and potentially complex regulatory processes. Existing long-term contracts, common in much of the natural gas industry outside the U.S., could be another obstacle. Extensive new networks of pipelines and infrastructure will have to be built. And many parts of the world still have ample conventional gas to develop first.
Yet interest and activity are picking up smartly outside North America. A shale gas revolution in Europe and Asia would change the competitive dynamics of the globalized gas market, altering economic calculations and international politics.
This new innovation will take time to establish its global credentials. The U.S. is really only beginning to grapple with the significance. It may be half a decade before the strength of the unconventional gas revolution outside North America can be properly assessed. But what has begun as the shale gale in the U.S. could end up being an increasingly powerful wind that blows through the world economy.
Mr. Yergin, author of the Pulitzer Prize-winning “The Prize: The Epic Quest for Oil, Money, & Power” (Free Press, new edition, 2009) is chairman of IHS CERA. Mr. Ineson is senior director of global gas for IHS CERA.
This brief initial comment from the Legendary Trader Dennis Gartman. For subscription information for the 5 page plus Daily Gartman Letter L.C. contact – Tel: 757 238 9346 Fax: 757 238 9546 or E-mail:dennis@thegartmanletter.com HERE to subscribe at his website.
SHARE PRICES HAVE MOVED VERY LITTLE as or Int’l Index has risen 10 “points” in the past twenty four hours and which we take as a rather bearish circumstance for given the enormity of Friday’s weakness we would have expected a bounce of some reasonable magnitude the day after. Instead the dead cat bounced not at all. Try as we might, we fail to see anything bullish in the action of the past three or four days, as one important trend line after another is broken; as the volume on the weakness is demonstrably larger than was the volume on the strength early last week; as inside selling continues to be high and is rising; as P/e multiples are stretched rather far, with hopes for continued increased earnings in jeopardy given that all of the earnings growth thus far has been predicated upon cost cutting rather than upon sales growth… and we could go on but our point is made we think.
Ed Note: Below from Don Vialoux’s Tech Talk. Be sure to go to his site and read his recommended articles.
Technical Action Yesterday
Technical action by S&P 500 stocks was quietly bearish yesterday. One S&P 500 stock broke resistance (Clorox) and five stocks broke support (Amerin, Dean Foods, Denbury Resources, Pinnacle West and Southern Companies). The Up/Down ratio dipped from 2.21 to (288/131=) 2.20.
Technical action by TSX Composite stocks also was quietly bearish yesterday. No TSX stocks broke resistance and two stocks broke support (Imperial Oil, TransForce). The Up/Down ratio slipped from 2.38 to (129/55=) 2.35.
….read much more HERE. including articles on ETF’s, Seasonal patterns and Market Timing.
Editor Note: I highly recommend a regular monday visit to Don Vialoux’s site where he analyses an astonishing 50 plus Stocks, Commodities and Indexes.
Mr. Gartman has been in the markets since August of 1974, upon finishing his graduate work from the North Carolina State University. He was an economist for Cotton, Inc. in the early 1970’s analyzing cotton supply/demand in the US textile industry. From there he went to NCNB in Charlotte, N. Carolina where he traded foreign exchange and money market instruments. In 1977, Mr. Gartman became the Chief Financial Futures Analyst for A.G. Becker & Company in Chicago, Illinois. Mr. Gartman was an independent member of the Chicago Board of Trade until 1985, trading in treasury bond, treasury note and GNMA futures contracts. In 1985, Mr. Gartman moved to Virginia to run the futures brokerage operation for the Virginia National Bank, and in 1987 Mr. Gartman began producing The Gartman Letter on a full time basis and continues to do so to this day.
Mr. Gartman has lectured on capital market creation to central banks and finance ministries around the world, and has taught classes for the Federal Reserve Bank’s School for Bank Examiners on derivatives since the early 1990’s. Mr. Gartman makes speeches on global economic and political concerns around the world.
COULD THIS BE THE LAST GASP FOR THE U.S. HOUSING MARKET?
U.S. pending home sales for September jumped 6.1% MoM; shouldn’t be a surprise given the possible expiry of the first-time homebuyer tax credit Yesterday, we received pending home sales data for September and they jumped 6.1% MoM on top of the 6.4% run-up in August. This seems to be a last gasp flurry of activity (we saw this in the 9.4% surge in actual existing home sales for September that came out last week) ahead of the possible expiry of the first-time homebuyer tax credit in the U.S. An extension of the program is working its way through the U.S. Congress and no doubt supporters will point to the data as showing that it works. The recent dips we saw in new home sales, single-family permitsand the National Association of Home Builders housing market index do indeed offer a glimpse of what could happen (a renewed turndown in residential real estate activity) if the stimulus expires.
….read more HERE.
Quotable
“UBS just posted ugly results that bode ill for European bank results and CIT just filed for bankruptcy. This raises the question: isn’t it too early to pay back government money?. – David Thebault, head of quantitative sales trading at Global Equities in Paris
FX Trading – Glenn Stevens says no more carry-trade, for now …
The profit-taking may have already begun after seeing the US dollar muster up strength here and there over the last couple days. But either way, RBA governor Glenn Stevens and his boys are seeing that the profit taking lasts a little bit longer.
It was just announced that the Reserve Bank of Australia will hike rates for a second consecutive month. But they took away the certainty of a similar decision in December. The problem: the market already baked that December rate hike into the cake … which explains why the Australian dollar is down nearly 100 PIPs as I throw this together.
RBA says “See ya in February!” and the Australia Dollar Falls

….read more HERE.

Are the Western Welfare States (the U.S., Japan, and EU nations) really going bankrupt? Things were headed that way before the credit crisis began. If Rogoff and Ferguson are right and the GFC is becoming a sovereign debt crisis, it will worsen an already bad situation.
How bad? We’ll show you three of the charts we showed the folks in Canberra on Sunday. This is the condensed version of a forty-five minute presentation. So we’ll have to leave out the colour commentary. And we’re pleased to offer another contribution from Dr. Steve Kates on how government policy is destroying public wealth.
But first, check out the chart below from the 2008 annual budget audit by the U.S. Government Accountability Office. It shows that the U.S. government must roll over $3.4 trillion in debt over the next four years. This $3.4 trillion does not include any additional borrowing that may be required for other government programs (wars, healthcare, wars, school lunches).

What’s the big deal? $3.4 trillion is a small number by today’s standards, isn’t it? Not exactly.
The chart shows how incredibly interest-rate sensitive U.S. government borrowing now is. Not only is it a big ask to ask the world’s creditors to continue funding such large deficits (there are only so many savings available to borrow, after all), but the interest expense on that debt is likely to go up as the fiscal position of America deteriorates.
……read more HERE.
-
I know Mike is a very solid investor and respect his opinions very much. So if he says pay attention to this or that - I will.
~ Dale G.
-
I've started managing my own investments so view Michael's site as a one-stop shop from which to get information and perspectives.
~ Dave E.
-
Michael offers easy reading, honest, common sense information that anyone can use in a practical manner.
~ der_al.
-
A sane voice in a scrambled investment world.
~ Ed R.
Inside Edge Pro Contributors

Greg Weldon

Josef Schachter

Tyler Bollhorn

Ryan Irvine

Paul Beattie

Martin Straith

Patrick Ceresna

Mark Leibovit

James Thorne

Victor Adair