
Daily Updates
Chile is prime hunting ground for “elephants” — large, undiscovered deposits of all sorts of minerals — copper, gold, silver and more. And last week, I visited this supermodel-skinny country, which is 4,022 miles long and an average width of only 100 miles across, on the trail of one of the world’s great undeveloped gold deposits.
“Chile is a toothpick of a country filled with a thousand geologic faults,” a mining engineer told me, “and every time one of those faults bends, minerals bubble to the surface.”
The first gold deposit I visited surfaced in spectacular fashion. About 22 million years ago, a giant volcano in what would become Chile blew its head off in Mt. St. Helens fashion. This sudden removal of a mountaintop lifted pressure from molten gold, silver and copper deposits deep beneath the earth, and the hot metal surged higher, over and over again, intruding finger-width thick veins of ore-bearing quartz through host rock.
Today, you can go see that gold, silver and copper yourself — as long as you’re willing to take a multi-hour ride up and down mountainsides, through one of the driest deserts in the world, to reach the Caspiche project, which at its peak is about 2.7 miles above the Earth’s surface.
At that altitude, the air is so thin that the light somehow seems different — sharper — and the wind howls over barren rock and patches of ice that refuse to melt even as the warmth of spring embraces the rest of Chile.
But that’s the kind of place you have to go in the world today if you want to find elephant-sized gold deposits.
And Caspiche is potentially very big indeed. The inferred resource is 19.6 million ounces of gold, 4.84 billion pounds of copper and 40 million ounces of silver.
The company that is developing Caspiche is…..
……read more HERE.
Editor Note: Money Talks highly recommends that you make a regular trip to this monday morning site to this Don Vailoux monday report where he analyses an astonishing 40 to 50 Stocks, Commodities and Index charts and, provides a “Bottom Line” and some very interesting comment.
– a few of the 40+ charts and commentary below. Full site HERE
The TSX Composite Index added another 171.65 points last week. Its intermediate trend changed from down to up when the Index broke above resistance at 11,648.55 to reach a 13 month high. The Index remains above its 50 and 200 day moving averages. Support is at 10,745.25. MACD and RSI are short term overbought. Stochastics are short term overbought and showing early signs of rolling over. Strength relative to the S&P 500 Index remains negative, but may be showing early signs of changing. Seasonal influences currently are positive.
The Dow Jones Industrial Average added 41.68 points (0.46%) last week. Intermediate trend remains up. The Average remains above its 50 and 200 day moving averages. Strength relative to the S&P 500 Index is positive. Short term momentum indicators (MACD, RSI and Stochastics) are overbought. Stochastics are significantly overbought and showing early signs of rolling over. Seasonal influences currently are positive.
The Shanghai Composite Index added 120.70 points (3.79%). Intermediate trend remains up. The Index remains above its 50 and 200 day moving averages. Resistance is at 3,478.01. Short term momentum indicators (MACD, RSI and Stochastics) are overbought, but continue to trend higher. Strength relative to the S&P 500 Index remains positive.
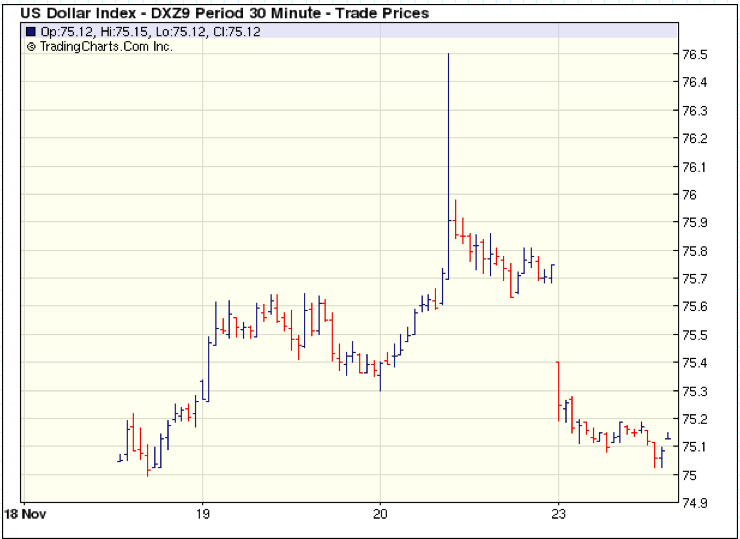
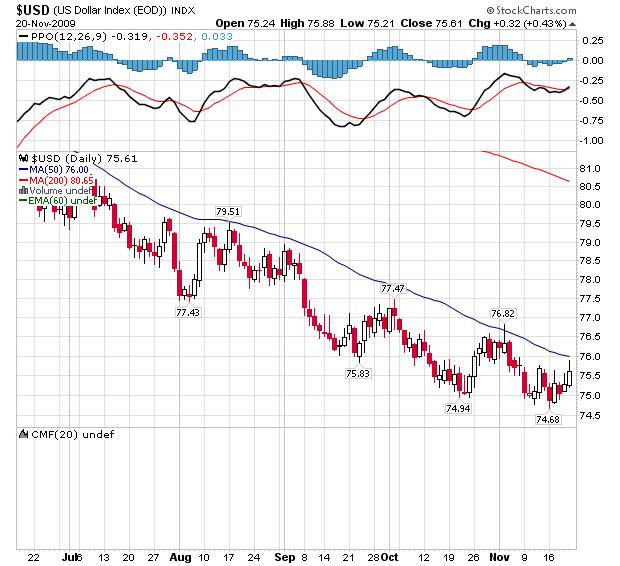
The U.S. Dollar added 0.38 last week. Intermediate trend remains down. Once again, the Dollar is testing its 50 day moving average where resistance has consistently appeared during the past eight months. MACD, RSI and Stochastics are recovering from short term oversold levels. A move above its 50 day moving average currently at 76.00 likely will trigger a significant short covering rally. Next resistance is at 76.82. Should be a very interesting week!
The Canadian Dollar fell 1.61 last week. Intermediate trend remains up. Short term momentum indicators are trending lower from overbought levels. The Canuck Buck fell below its 50 day moving average last week. Support is indicated at 92.16
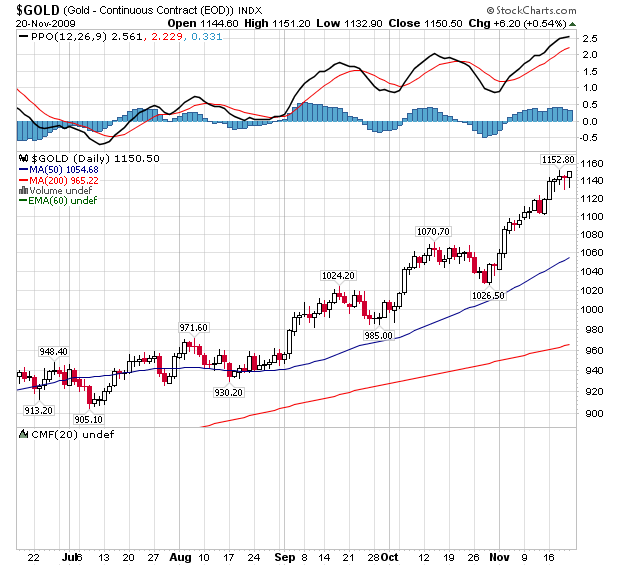
Silver resumed its intermediate trend last week on a break above resistance at $18.08. Strength relative to gold remains negative.
The Bottom Line
Equity markets continue to trend higher. Stick with the trend (particularly in sectors that benefit from favourable seasonal influences).
Ed Note: much much more at Don Vialoux’s Monday Site HERE.
Don Vialoux has 37 years of experience in the Investment Industry. He is a past president of the Canadian Society of Technical Analysts (www.csta.org) and a former technical analyst at RBC Investments. Now he is the author of a daily letter on equity markets available free on the internet. The reports can be accessed daily right here at www.dvtechtalk.com.
Impossible! That’s what institutional investors say about “Timing the Market”. Mr. Vialoux will explain that, indeed, it can be done with the appropriate analysis. He also will explain why timing the market will be important during the next decade. Buy and Hold strategies are not working anymore; Investors are looking for alternatives. Mr. Vialoux will demonstrate four techniques that can be used to time intermediate stock market swings lasting 5-15 months. The preferred investment vehicles for investing in intermediate stock market swings are Exchange Traded Funds.
Comments in Tech Talk reports are the opinion of Mr. Vialoux. They are based on technical, fundamental and/or seasonal data that is believed to be accurate. The comments are free. Mr. Vialoux receives no remuneration from any source for these services. Comments should not be considered as advice to buy or to sell a security. Investors, who respond to comments in Tech Talk, are financially responsible for their own transactions.
This brief initial comment from the Legendary Trader Dennis Gartman. For subscription information for the 5 page plus Daily Gartman Letter L.C. contact – Tel: 757 238 9346 Fax: 757 238 9546 or E-mail:dennis@thegartmanletter.com HERE to subscribe at his website.
THE DOLLAR IS BEGINNING THE WEEK BY FALLING, not materially perhaps, but falling nearly universally, and as we head into the US Thanksgiving week where volumes are likely to be steadily smaller each trading session until next Monday, we can assume that the trend in place shall remain in place; that is, the dollar’s trend downward is again intact and rallies are to be sold rather than weakness to be bought. Is the dollar over sold? Of course it is. Is the short dollar position over-crowded? Of course; certainly; without question; absolutely. But is the trend still firmly in place and is it best to assume that the trend shall remain downward? Yes, until proven wrong, that is the way to trade, for as Damon Runyon said, “The race isn’t always to the swiftest nor the fight to the strongest, but that is the way to bet.”
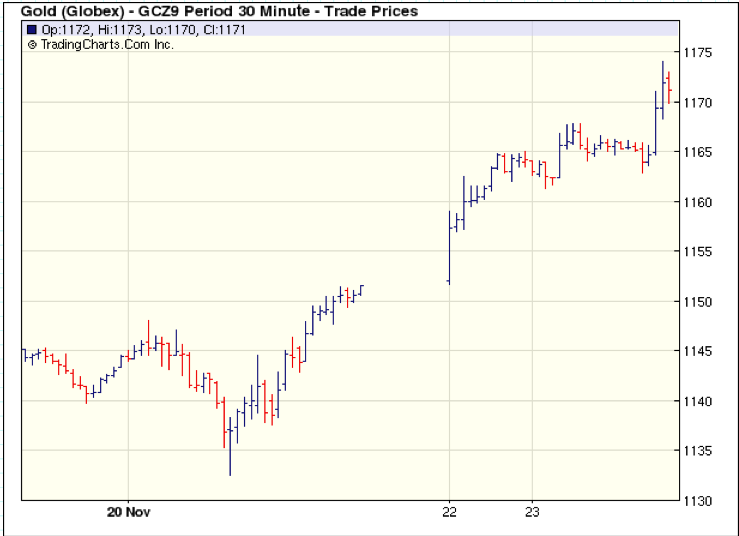
What has happened to take the dollar down and to send gold soaring, for gold is indeed soaring (cf. our comments below)? There is only one major economic or political news item over the weekend worth noting and that is the ability of the Democrats in the Senate to muster the 60 votes needed to end any filibuster attempts and to bring health care legislation to the floor eventually. With those 60 votes, health care “reform” is a foregone conclusion and the centre- leftward drift of the US government is now that much more certain. Capital is fleeing from the dollar as a result and is moving elsewhere. Capital felt always that the when Europe moved leftward, the US would hold steady. Capital felt that if Canada, or Australia or the UK, or New Zealand moved leftward, the US would hold steady.
Mr. Gartman has been in the markets since August of 1974, upon finishing his graduate work from the North Carolina State University. He was an economist for Cotton, Inc. in the early 1970’s analyzing cotton supply/demand in the US textile industry. From there he went to NCNB in Charlotte, N. Carolina where he traded foreign exchange and money market instruments. In 1977, Mr. Gartman became the Chief Financial Futures Analyst for A.G. Becker & Company in Chicago, Illinois. Mr. Gartman was an independent member of the Chicago Board of Trade until 1985, trading in treasury bond, treasury note and GNMA futures contracts. In 1985, Mr. Gartman moved to Virginia to run the futures brokerage operation for the Virginia National Bank, and in 1987 Mr. Gartman began producing The Gartman Letter on a full time basis and continues to do so to this day.
Mr. Gartman has lectured on capital market creation to central banks and finance ministries around the world, and has taught classes for the Federal Reserve Bank’s School for Bank Examiners on derivatives since the early 1990’s. Mr. Gartman makes speeches on global economic and political concerns around the world.
“I asked the obligatory question: ‘How do you decide when to make a trade?’ Through experience,’ he says, propping his foot up on a small fold-out seat screwed to his post. ‘Over the course of eighteen years as a specialist, I’ve had every type of experience up market and down market, people getting shot, wars, you name it – and you learn how to react based on those experiences. I guess I’ve had everything happen, and I guess you store it in the computer in your head. You don’t have a lot of time to decide, that’s for sure. And you have to anticipate. You have to look at the tape and anticipate – two months or three months, maybe a day or so, maybe two or three seconds before someone else. That’s what makes you a good trader . . . People talk a lot about their bellies. I guess that has something to do with it too. You do feel something in yourgut.”
….read more of the current 4 page with charts analysis of the Stock Market HERE
Gold is flying in Asia. Outside of a rather small group of professionals who have remained strong advocates through thick and thin (I would hope I’d be included in that camp with Jim Sinclair, Bill Murphy, GATA and a few others), this move has left both perma-bears, former bulls (who became weak-knee below and at $1,000 an ounce) and much of the financial media in the “dust”.
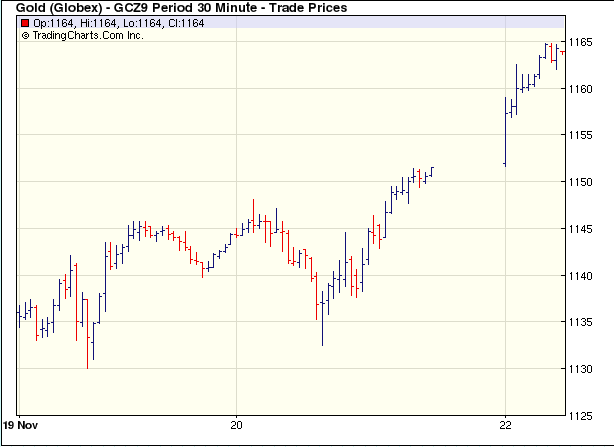
My upside target of $1,200 now appears to be within sight before years-end (if it gets to $1,195 I won’t shed a tear).
Many ask why has this occurred? The better question is to ask why did so many miss it?
I’ve compared this move above $1,000 to the U.S. Stock Market breaking above 1,000 in the early 80s. For several decades, the stock market was capped around 1,000. Stocks became so out of favor that “Business Week” magazine wrote a famous front page heading entitled, “Stocks are Dead”. An unknown soothsayer at the time named Robert Prechter Jr. predicted 3,000 on the DJIA. Most thought that was crazy. Well we all know what happened.
I’m not saying gold is going to $14,000 like the DJIA did but I do believe there’s some commonalities. For starters, the DJIA traded between 700 and 1,000 for quite awhile and when it finally broke out, it ran sharply while most kept saying it had to come back just as sharp. Such has been the case after gold traded between $700 and $1,000. I and some others argued that this set gold up for a run to $1,200-$1,300 when we got and stayed above $1,000. Most have missed it and keep calling (and hoping) it comes back to them.

Another similar factor is that in the early stage of the DJIA run, a few highly respected money guys turned very bullish on equities after years of bearishness and/or near total avoidance of equities. Recently, such well-known “financial’ experts like Steve Einhorn, Paul Tudor Jones and John Paulson have become big gold buyers/believers.
And one more common ingredient, equities went from lack of ownership by the public-at-large to the absolute favorite asset to own. While gold remains hated by the vast majority who sell and report on financial assets, as well as by some perma-bears who will become as unimportant as the #1 perma-bear of the late 1990s Andy Smith, gold is/has become an asset class to many outside of North America.
There are also several other long term bullish factors like the fact Central Banks, who used to only know one way to go when it came to gold – sell, are now buyers. Mine supply continues to be limited and hedging, the once cut your nose to spite your face move by mining companies, is now a dead issue.
Is it too late to buy gold? It’s no longer cheap. But if the craze for equities proved anything for almost 25 years (interrupted by a few sharp corrections and bear markets), it’s that the boat needs to get pretty filled up before it finally sinks of its own weight. The fact that gold is still either hated, ignored or misunderstood by most, especially in the U.S., I believe the long-term end is no where in sight. Is a correction coming? Absolutely but not before those perma-bears who have been wrong for seemingly as long as the Jets haven’t been to the Super Bowl, are put out of their misery. Forgive me if I don’t attend their funeral.
Where about to enter one of the seasonal best periods for equities. This coming week tends to be up for U.S. stocks. I do believe between now and year-end my long awaited time to dust off my bear suit again can come. Stay tuned.
Remember, the U.S. Dollar Index needs to at least close above 76.50 before any thought of a dollar bear market rally can become legit. The very fact so many people in recent days are talking about a rally can either make it a self-fer-filling prophecy or actually set us up for another down leg. We live in very interesting times, no?
Sleep tight tonight as tomorrow is shaping up to be a very interesting day.
Oh, before I sign-off, I like to play a video I posted when gold went above $1,000. The attackers are the gold bears in my mind when we hit $1,000 and the those defending are the few true gold bulls who have not wavered these last couple of hundred dollars.
-
I know Mike is a very solid investor and respect his opinions very much. So if he says pay attention to this or that - I will.
~ Dale G.
-
I've started managing my own investments so view Michael's site as a one-stop shop from which to get information and perspectives.
~ Dave E.
-
Michael offers easy reading, honest, common sense information that anyone can use in a practical manner.
~ der_al.
-
A sane voice in a scrambled investment world.
~ Ed R.
Inside Edge Pro Contributors

Greg Weldon

Josef Schachter

Tyler Bollhorn

Ryan Irvine

Paul Beattie

Martin Straith

Patrick Ceresna

Mark Leibovit

James Thorne

Victor Adair