
Daily Updates
Editor Note: Money Talks highly recommends that you make a regular trip to this monday morning site to this Don Vailoux monday report where he analyses an astonishing 40 to 50 Stocks, Commodities and Index charts and, provides a “Bottom Line” and some very interesting commentary.
– a few of the 40+ charts and commentary below. Full site HERE
The Bottom Line
North American equity markets historically have been “choppy” in the second week in December followed by significant gains in the second half of December. Look for history to repeat. Weakness, if it occurs, will provide an opportunity to accumulate equities and ETFs that benefit from seasonal influences.
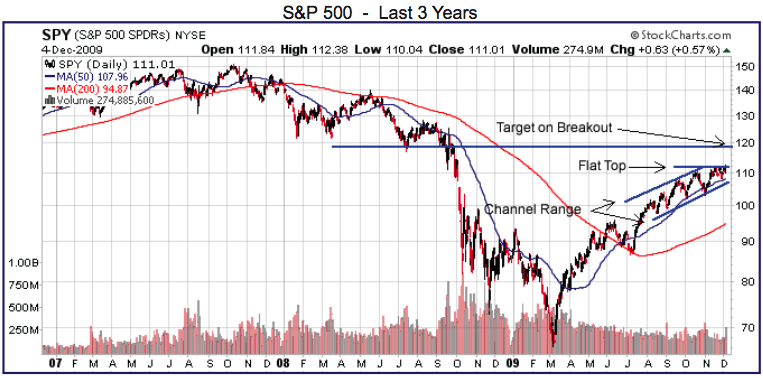
The S&P 500 Index added 18.71 points (1.72%) last week. Intermediate trend remains up. The Index remains above its 50 and 200 day moving averages. Its 50 day moving average has proven to be a reliable support level in recent months. The Index bounced above that level again last week. Short term momentum indicators are neutral to slightly overbought. Seasonal influences remain positive. Support is indicated at 1029.38.
The TSX Composite Index added 46.39 points (0.40%) last week despite weakness on Friday. Intermediate trend is up. The Index remains above its 50 and 200 day moving averages. Short term momentum indicators remain slightly overbought. Strength relative to the S&P 500 Index has turned neutral recently. Support is indicated at 10,745.25. Seasonal influences are positive.

The U.S. Dollar closed above its 50 day moving average on Friday, a significant technical event. Its 50 day moving average had proven to be resistance in recent months. Additional weakness early this week could trigger a significant short cover. Intermediate trend remains down and the reasons for the downward trend have not changed (e.g. growing fiscal deficit, lack of control over government spending, loose monetary policy). Short term momentum indicators are recovering from oversold levels. A recovery to resistance at 76.82 is possible. A move above resistance needs to be watched because it implies a change in intermediate trend. Seasonal influences are strongly negative until the end of the year due to year-end transactions by U.S. based international companies. Seasonal influences turn strongly positive from the beginning of January to the middle of April.

The Canadian Dollar managed to record a 0.27 cent U.S. gain last week despite weakness on Friday triggered by U.S. Dollar strength. It remains in a two month trading range between 92.16 and 97.69 cents U.S. Short term momentum indicators are neutral.

Gold quickly responded to strength in the U.S. Dollar on Friday following the better than expected U.S. employment report. MACD, RSI and Stochastics recorded short term sell signals (Negative cross over by MACD, RSI falling below 70%, Stochastics falling below 80%). Downside risk is to its 50 day moving average currently at $1,090.65.
Don Vialoux has 37 years of experience in the Investment Industry. He is a past president of the Canadian Society of Technical Analysts (www.csta.org) and a former technical analyst at RBC Investments. Now he is the author of a daily letter on equity markets available free on the internet. The reports can be accessed daily right here at www.dvtechtalk.com.
Impossible! That’s what institutional investors say about “Timing the Market”. Mr. Vialoux will explain that, indeed, it can be done with the appropriate analysis. He also will explain why timing the market will be important during the next decade. Buy and Hold strategies are not working anymore; Investors are looking for alternatives. Mr. Vialoux will demonstrate four techniques that can be used to time intermediate stock market swings lasting 5-15 months. The preferred investment vehicles for investing in intermediate stock market swings are Exchange Traded Funds.
Comments in Tech Talk reports are the opinion of Mr. Vialoux. They are based on technical, fundamental and/or seasonal data that is believed to be accurate. The comments are free. Mr. Vialoux receives no remuneration from any source for these services. Comments should not be considered as advice to buy or to sell a security. Investors, who respond to comments in Tech Talk, are financially responsible for their own transactions.
Today’sNotes:
1. The East Asia Co Prosperity Sphere: The Next Asia
2. The Reversal of the Dollar Carry Trade
Here we go again. If you have been a reader of Morning Notes for the past couple of years the following table of exchange rates is déjà vu. There is a rush to buy the dollar this AM and it is soaring. Why the rush? Because the global investment community has borrowed in US dollars at essentially zero interest rates and invested elsewhere – the infamous carry trade. I suspect there was a carry trade in biblical times though I cannot find the data to prove my point. The carry trade is the simplest of trades. It is to borrow in the low overnight interest rate country and invest in the high yielding country. We often see these trades go bust because, of course, the end result is an asset bubble of some sort. The Yen carry trade of the past two decades is perhaps the most well known example. Please examine the following currency table from Kitco this AM. Sure enough, the US currency is stronger against all its fiat cousins except, unfortunately, the Japanese Yen. Poor old Japan – she never got over the bubble of the 40,000 Nikkei equity index in 1989 or for that matter her dastardly attack on Pearl Harbor 68 years ago today.
….read more HERE.
Richard Russell has made his subscribers fortunes. One of the best values anywhere in the financial world at only a $300 subscription to get his DAILY report for a year. HERE to subscribe. Richard has been Bullish Gold since below $300. He also loaded up on bonds in the early 80’s when US Treasuries where yielding 18%+. A 30 year bonds through compound interest would turn $1,000 into $300,000 at maturity. (include reinvestment of interest income, which Richard does as his view is compounding interest is the ROYAL ROAD to RICHES)
“as of Wednesday, gold had been up 20 of the last 22 sessions, and I wondered on the site how long this atypical performance could continue. Last night gave me a hint — the Feb. gold futures were down 14.0 at 6:29 PM. So I guessed it was time for some kind of gold correction — how big I had no way of knowing.
As of yesterday, the decline didn’t even show on a 10-point, three-box reversal chart. On this chart each box represents ten points in gold, and only rallies or declines of three boxes or more are depicted on the chart. Today the decline stretched to over 40 points, and this indeed shows on a P&F.”
GLD, the gold exchange fund provides us with a clearer picture. Here we see GLD up on a “high pole” and clearly extended. A correction back to 106 to 108 would be healthy. Actually, any correction that ended at or above the halfway level would be healthful. So a test is on. I await the verdict of the market. “
This brief initial comment from the Legendary Trader Dennis Gartman. For subscription information for the 5 page plus Daily Gartman Letter L.C. contact – Tel: 757 238 9346 Fax: 757 238 9546 or E-mail:dennis@thegartmanletter.com HERE to subscribe at his website.
Let’s begin by stating very clearly that the bull market in gold has not ended. Friday’s weakness was not the end but simply a fact of higher prices and larger public participation giving way to larger movements and greater swift liquidation that these high prices demand. Simply put, a 2% price change on $1200/ounce gold is far larger than is a 2% price change on $600/ounce gold. Everyone knows that, of course, but during the heat of battle that is all-too-often forgotten. In Sterling, or EUR or Yen terms, all gold did on Friday was move 2% lower. In the great scheme of things that it nothing of consequence but in the heat of battle, the 4-5% price movement for gold in US dollar terms was jaw- dropping and panic laden.
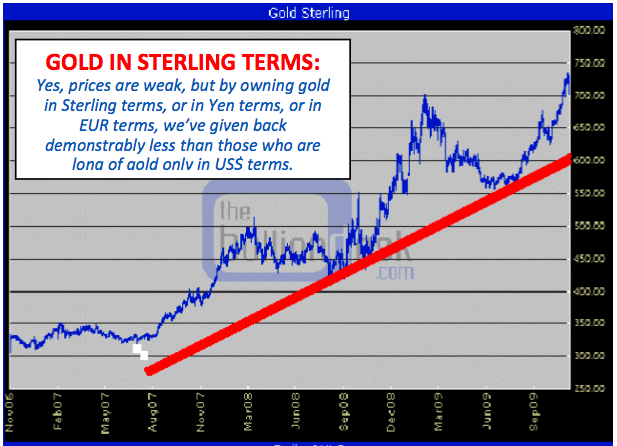
At the bottom left of p.1 this morning we’ve a chart of gold in Sterling terms. The trend is rather clear: it is moving still from the lower left to the upper right. Yes, at or near £750 prices were a bit over-extended, but now that gold has fallen back toward €700 [Ed. Note: To be precise, it is trading £698.80 as we write.] that over-extendedness has been nullified and the price has returned to more reasonable levels.
“Buy on the cannons and sell on the trumpets” is an old stock market “saw” that has stood the test of time. Plainly, we recommended “buying on the cannons” the first week of March; and, evidently participants heeded the second half of that axiom last Friday as the much better than expected employment numbers sparked a moon-shot opening that saw the Dow dance 180 points higher in the first 15 minutes of trading. From there, however the Doleful Dow was “sold” into the end of the session. That caused one old Wall Street wag to exclaim, “Up mornings and down afternoons is not particularly good market action.” Not good action indeed, for Friday’s trading pattern smacked of what a technical analyst would term a “one-day downside reversal.” According to Bedford and Associates:
“The one day reversal is the starting point for most reversal patterns. After an extended rally the stock gaps higher at the open to trade at a new high on a positive news announcement. As the session proceeds volume expands significantly but by the close the entire rally disappears and the stock closes lower.”
….read more HERE.
Despite the debate of whether the economy is in trouble in the long-term, the economy has been showing signs of life once again. Investor’s confi dence is up and the market has been doing well. Although the market may be a bit pricey, and there may be some volatility ahead, there is still some room to grow.
This is particularly true as we are in the favourable period of the year (October 28-May 5). Yes, there are times when the market goes down in this period, but the times are few and far between. Over the last sixty years, the S&P 500 has only lost 10% or more two times. Surprisingly, de- spite the volatility last year, the S&P 500 produced a 6.5% gain in the favourable period in 2008-2009.
…..read the whole Letter HERE.
-
I know Mike is a very solid investor and respect his opinions very much. So if he says pay attention to this or that - I will.
~ Dale G.
-
I've started managing my own investments so view Michael's site as a one-stop shop from which to get information and perspectives.
~ Dave E.
-
Michael offers easy reading, honest, common sense information that anyone can use in a practical manner.
~ der_al.
-
A sane voice in a scrambled investment world.
~ Ed R.
Inside Edge Pro Contributors

Greg Weldon

Josef Schachter

Tyler Bollhorn

Ryan Irvine

Paul Beattie

Martin Straith

Patrick Ceresna

Mark Leibovit

James Thorne

Victor Adair