
Daily Updates
Sell your gold only IF you want to lose money!
Something about gold just makes people irrational. The latest meme making the rounds in the mainstream media is that gold is a bad investment over the longer term. A couple of radio hosts asked me about it, and even Bloomberg ran a story on this earlier this week, saying that gold can’t beat the returns on a checking account over the last 30 years. The rest of the story was about while hedge fund managers are buying gold, it’s a poor investment for regular folks.
There’s so much wrong wrapped around the one nugget of truth in the Bloomberg story that it’s hard to know where to begin. But I’ll try.
And before I do, let me just say that if you really think gold is a poor investment, go sell your gold, please. I want gold to get cheaper. Why? Because my subscribers are waiting to BUY gold again, and we’d love to buy your gold on the cheap. Despite the recent correction — a normal and necessary part of any bull market — the long-term trend in gold is way, way up.
Now, as for the canard that gold is a bad investment, let’s see …
Choose Your Time Frame
It is true that gold has underperformed measured on a 30-year time frame. But how many people buy-and-hold for 30 years? Certainly I’ve never seen that investment strategy pushed by any of the gold-hatin’ jackalopes on their hind legs now.
A more reasonable investment time frame is 1 year, 5 years, or maybe on the outside, 10 years. Let’s see how gold does against the S&P 500 over those time frames …
That’s right — over the last 10 years, the S&P 500 has a negative return. Well then, the mainstream media should be warning people away from the major stock indices, right? Ri-i-i-i-i-ght.
Meanwhile, gold’s 10-year return is just enormous. You can get a better feel for it in this next chart …

You can see that not only is gold outperforming the S&P 500, the outperformance is accelerating. To be sure, there’s no guarantee that this outperformance will continue, or that gold will even continue to go higher. However …
We’re Right in the Middle of the
Big Commodity Bull Market
Throughout history, there have been bull markets in raw materials every 30 to 40 years. Occasionally, a bull market will turn into a commodity supercycle, like the one the U.S. experienced around the turn of the 20th Century, or again after World War II. Supercycles can go for a LONG time. Many people think that China’s hunger for raw materials has triggered another supercycle.
Recent commodity bull markets averaged about 17 to 18 years in length — though they’ve gone as long as 22 years — and experienced very large rallies.
The current bull market in gold started in 2001, and the broad bull market in commodities started in 2002. So, if history is a guide, we’re maybe halfway done.
What’s more, a recent study by Yale University’s School of Management and the Wharton School at the University of Pennsylvania demonstrated that commodities have outperformed stocks and bonds over a recent 45-year period with less risk, and were a better hedge against inflation. Now there they go, cherry-picking a time frame like 45 years. How Bloomberg-ian of Yale!
Russia Is Buying More Gold
One central bank after another has been buying gold recently, and central banks will become net buyers of gold this year for the first time since 1988, according to New York-based researcher CPM Group. In October, we saw India, Mauritius and Sri Lanka buy more than half of the 403.3 metric tonnes of gold that the International Monetary Fund was bringing to market. And Russia’s central bank also increased its gold holdings by 2.6% in October.
That buying trend in Russia continued in November. Russia’s gold reserve probably rose by $790 million to $23.1 billion in the week ended Nov. 27, according to a report in the Moscow Times. The Central Bank increased gold holdings by almost 130 million tonnes in the last year, according to the report.
Gold Coins Are Selling Out
Talk about a hot market. Last Thursday, the U.S. Mint put the three fractional gold American eagles on sale, then had to suspend sales the next day as virtually everything sold out!
The U.S. Mint recently suspended the sale of American Eagle gold coins after they sold out.
The fractional gold eagles are one-half, one-quarter and one-tenth of an ounce in size. This follows the previous week’s news of sales of the one-ounce gold and silver eagles being suspended and the gold buffalos were also suspended. Speaking of gold buffalos — sales for the 2009 Gold Buffalo bullion coin exceeded sales for 2007 and 2008, despite the fact that the 2009 dated coins were only available since October 15, whereas the prior two year’s coins were available throughout the year.
The good news for coin buyers is that American silver eagles have since gone back on sale. I wonder how long that will last?
Summing up, it’s easy to draw two conclusions from this news …
- Demand for easily available physical gold is increasing.
- Lack of supply to meet demand is going to drive up prices (or at least drive up premiums on coins).
China, China, China!
You probably know that China has become the world’s biggest gold miner, as the gold fields in South Africa edge closer to exhaustion. But did you know that China is going to pass India as the world’s largest gold consumer in 2009?
Yep, China’s total demand for jewelry and investment is forecast at 432 tonnes, according to market analysts at GFMS. GFMS forecasts total gold demand from China in 2009 to be 432 tonnes, compared with that of 422 tonnes from India. China’s investment demand alone was forecast at 83 tonnes, easily passing India’s 53 tonnes.
And then there’s the small matter of China advertising the “opportunities” in gold and silver and urging its citizens to buy the precious metals.
Nonetheless, when Hu Xiaolian, the vice-governor of China’s central bank, recently made a statement that Beijing would not buy gold indiscriminately — and called the gold market a “bubble” — the gold haters in the mainstream media seized on this as proof that China would not be adding to its gold reserves, at least not anywhere near present prices.
HA!
Those gullible media talkers must have too much lead in their toothpaste. Since when can we believe the Chinese on ANYTHING? They’re nice folks, but always get proof to back up what they say, because the Chinese are the biggest market manipulators in the global economy. If you don’t think so, just ask anyone who trades the copper, zinc or other metals markets. The Chinese often try to talk down the metals markets, to their own advantage as they come in and scoop up bargains.
I think the Chinese want to buy gold, and like everybody else, they would prefer to do it at cheaper prices.
All This, and Tight Supply, Too
Previously, I’ve told you about other forces at work in the gold markets — exchange-traded funds that hold the physical metal could become sellers eventually, but they’re buyers now. Mine supply is tight and probably going to get tighter as ore grades drop at new projects and mining costs rise.
And those ads on TV to “sell your gold” (at terrible prices, probably) may have brought in some used bling-bling, but that can only go on for so long. The dumb money is selling gold to the TV-advertising sharpies. Meanwhile, hedge funds, big investors and central banks — the smart money — are buying gold, or at least poised to buy when gold hits their targets.
Dumb money is selling, smart money is buying. Which are you?
I haven’t said much about silver yet. Silver should fall faster than gold, but its next move to the upside could be explosive. The silver market is worth only about $9 billion — 20 times smaller than the gold market — and so that offers potential for bigger percentage moves UP and DOWN.
A Pullback That Can Be Bought
So, yes, gold is pulling back as the U.S. dollar rallies. The dollar rally could continue for a bit, and that will give you the best prices on gold we’ve seen in quite a while, as the metal retraces part of its big rally.
In my video on Tuesday, I laid out some price targets for such a pullback. I’ve given my premium service subscribers even more detail, with other price supports below those indicated in the video. But if you’re doing this on your own, here’s my two cents (which is equivalent to a dollar in 1913, before inflation ate away its value) …
Wait until gold pulls back to a level you feel comfortable with.
When gold hits your level, consider entering positions in stages.
If you want leverage, buy select gold stocks and funds.
In late June, I announced my target on gold for 2010 at $1,300 an ounce. That hasn’t changed … not yet anyway. It’s not written in stone. I’m always open to new information. I also think gold will double over the next four or five years.
3 Ways to Play Gold’s Move
You’re in charge of your own investment destiny. If you like ETFs, consider the ETFS Physical Swiss Gold Shares (SGOL), backed by one-tenth of an ounce of Swiss-stored physical bullion per share. Volume is a little light, but you can’t beat the Swiss guarantee. For convenience, nothing beats the SPDR Gold Shares (GLD).
And if you’re an international traveler — or feeling paranoid — consider the ZKB Gold ETF on the Zurich Stock Exchange. I’m told you can take your ZKB shares to the Zurich Cantonal Bank, owned by the Canton of Zurich, take possession of the actual bullion, and you can even store that gold in Zurich.
Yours for trading profits,
Sean
Small-Caps and Natural Resources Analyst
This investment news is brought to you by Uncommon Wisdom. Uncommon Wisdom is a free daily investment newsletter from Weiss Research analysts offering the latest investing news and financial insights for the stock market, precious metals, natural resources, Asian and South American markets. From time to time, the authors of Uncommon Wisdom also cover other topics they feel can contribute to making you healthy, wealthy and wise. To view archives or subscribe, visit http://www.uncommonwisdomdaily.com.
Thoughts on the Statistical Recovery
Lies, Damn Lies, and Government Statistics
The Problem of Seasonal Adjustments
The Job Creation Engine
A Double-Dip Recession?
Dad Gets a Lively Lesson
Thoughts on the Statistical Recovery
We are clearly starting to get some better data points here and there. But as I pointed out this summer, it is going to be a recovery in the statistics and not in the things that count, such as income and employment. This week we look at the nascent recovery (which could be at 3% this quarter) and try to peer out into the future to see what it means. We look at how recoveries come about, and why I am concerned that we will see a double-dip recession. Plus, I learned some new tricks courtesy of my new granddaughter, to whom Tiffani gave birth this week1 There is a lot to cover, but it should be interesting.
But first, a quick commercial nod to my subscription service, “Conversations with John.” It was one year ago this week we launched the service, and we are pleased that so many of you have subscribed. As a bonus for renewing or subscribing, I am going to be doing a special predictions issue, where I will interview at least six analysts who have been right the past few years and ask for their specific predictions for the coming year.
For new readers, this is where I sit down with some of my friends and hold an in-depth conversation, generally 45 minutes to an hour, and post it on our web site, along with a transcript. We have had some fairly well-known names over the past year, and the reviews from subscribers have been excellent.
As a Holiday Special, we are offering a subscription at the special price of $129. Just click on the link and type in the code JM09 when asked to do so in the subscription process (at the conclusion of the process, not the beginning, but we’re working on that.) This is a big savings over the regular $199 price. Just click on the link to learn more and see what subscribers are saying. http://www.johnmauldin.com/newsletters2.html
Plus, when you subscribe you get access to the Conversation archives. That is worth the price of admission itself. And now, let’s jump into The Statistical Recovery.
Thoughts on the Statistical Recovery
In the ’50s through the early ’80s, recessions were typified by large layoffs at manufacturing businesses, as they had built up too much inventory. Businesses had increased capacity and often borrowed a little too much. Rising prices in the ’70s, along with extremely high interest-rate costs, led to the two severe recessions of the early ’80s, which Paul Volcker had to essentially force into existence, in order to begin the process of wringing inflation out of the economy.
But, and this is important, as the economy improved, inventories were eventually worked through and employees were brought back to work. Things returned to normal. The economy would once again grow at a robust rate. Then, in the last two recessions, in the early ’90s and early ’00s, it took longer for employment to rise. A great part of this was because the manufacturing sector of national employment was becoming an ever smaller part of the economic pie. We were, and still are, turning into an economy driven by services.
I should note that, on an absolute basis, manufacturing in the US has grown (going back to before this recession started.) We just produced more “stuff” with fewer employees. We became more productive. But this means that there are fewer jobs that will be brought “back” to make up for increasing sales than in past recessions. There are estimates out that as many as 2 million of the 8 million jobs lost are permanent job losses.
We know that businesses have made large cuts in numbers of employees in order to address lower sales and to increase their profits. Increasing profits by cutting costs even as the “top-line” sales number is shrinking is not a growth strategy that can be sustained. It also eats into research and development and postpones growth.
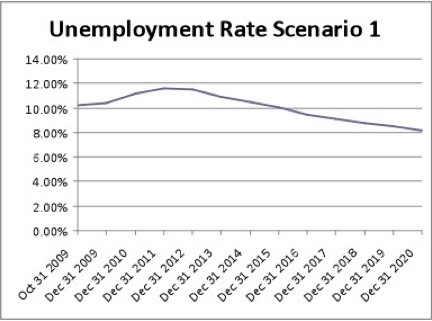
How likely are businesses to bring back employees if they have found they can produce more with less? This is a prescription for the mother of all jobless recoveries. A few weeks back, I went into some detail outlining why employment is likely to be uncomfortably high for a number of years, and that assumes we do not go back into recession. The graph below is the most likely scenario. You can see the entire piece, which goes into detail on this and other scenarios (developed with Mike Shedlock), by clicking here.
Quoting from that letter: “In August, I did an interview with CNBC from Leen’s Fishing Lodge in Maine (http://www.cnbc.com/id/15840232?video=1207956774&play=1). The unemployment numbers had just come out. I did a back-of-the-napkin estimate that we would need about 15 million new jobs over the next five years just to get back to where we were when the recession started.” It rather startled some of the hosts – “Where can we get that many jobs?”
Again, quoting from that letter: “That works out to a need for about 125,000 new jobs each month to handle new workers coming into the market (which comes to a total of 7.5 million over five years), plus the 8 million and rising jobs we’ve lost. That is a daunting number. It amounts to 250,000 new jobs a month every month for five years.”
As it turns out, Princeton Professor Paul Krugman agrees. He writes in today’s New York Times (http://krugman.blogs.nytimes.com/):
“I don’t think many people grasp just how much job creation we need to climb out of the hole we’re in. You can’t just look at the eight million jobs that America has lost since the recession began, because the nation needs to keep adding jobs – more than 100,000 a month – to keep up with a growing population. And that means that we need really big job gains, month after month, if we want to see America return to anything that feels like full employment. How big? My back of the envelope calculation says that we need to add around 18 million jobs over the next five years, or 300,000 a month. This puts last week’s employment report, which showed job losses of “only” 11,000 in November, in perspective. It was basically a terrible report, which was reported as good news only because we’ve been down so long that it looks like up to the financial press.”
That just goes to show you that I am an optimist. His back-of-the-napkin number is 20% larger. He is probably right, as he has a Nobel Prize and I don’t, and I didn’t actually use a napkin. I did the math in my head on camera while we were getting ready to go fishing.
Krugman uses this to suggest the Fed should double their balance sheet by another $2 trillion (seriously). That would not be very helpful to the dollar, I would think.
(Aside: we are in a balance-sheet recession. We overleveraged our banks and consumers. Now they are having to retrench. We are watching consumer and business loans fall. Putting $2 trillion more into the system is not going to make consumers want to borrow more. I can’t quite see where you deal with the problem of too much leverage by trying to create more leverage somewhere else. But that’s a topic for another day.)
And just to demonstrate that I am not being too pessimistic, you can go to a study the Bureau of Labor Statistics put out yesterday. They estimate that the economy will create 15.3 million more jobs in the next ten years, which is an average of about 1.5 million a year, or 125,000 a month. That is not a robust number, and suggests that the continued high unemployment projected in the graph above may not be far off target, as the employment assumptions are not that dissimilar. If you have no social life, you can read it yourself at http://www.bls.gov/news.release/ecopro.nr0.htm.
Lies, Damn Lies, and Government Statistics
We are going to look at the unemployment numbers of last week, along with the unemployment claims that came out yesterday. But first, I want to quote a section from Dennis Gartman’s letter this morning. It illustrates why we have to be very careful how we use government data. Too often, we think the data is straightforward math and simply draws on the underlying data sources. The reality is that it is anything but. To wit:
“A PROBLEM AT THE VERY HEART OF DATA GATHERING: Recently in Washington a rather large number of economists from academia and from government met to try to hash out a problem with data gathering that has become more and more serious here in the US and has more and more distorted how we value the American economy itself. At heart is how imports into the US are accounted for.
“For example, when a part for perhaps $100 is imported from China and is used in an American automobile … something that happens more and more and more often these days … the stats show that the finished car is American-made because it was assembled here in the US and in the process the US GDP is raised by that same $100 when in fact it should have been deflated by that figure instead. In the process, American workers who might in the past have made the part in question are no longer doing so and are obviously made redundant, hence a job or jobs is lost.
“The unemployment data then ‘finds’ that unemployed worker and accounts for him or her, but the car that is assembled does not, and when it is produced and sold and its value makes its way through the system, it appears that productivity has risen … and rather dramatically so, when in fact it has not. As one of the economists attending that meeting said,
” ‘We don’t have the data collection structure to capture what is happening in a real-time way, or what is being traded and how it is affecting workers. We have no idea how to measure the occupations being ‘offshored’ or what is being ‘inshore.’
“Or as the Assistant Commissioner for International Prices at the US Bureau of Labor Statistics (and how “politburo-like” is a title like that?!!) Mr. William Alterman, said regarding this problem
” ‘What we are measuring as productivity gains may in fact be nothing more than changes in trade instead.’
“This is not an insignificant problem, for as the US has become more and more international in its trading scope the data has become more and more important. Back in the 1975, imports into the US were only 5% of our total economic activity, but in recent years that has swelled to 12%, excluding imports of energy. Thus, many imports into the US are being, and have been, and will continue to be, valued as though they were manufactured here in the US, when indeed they were manufactured abroad and merely assembled here in the US.
“In autos, in computers, in appliances, this is a large and growing problem, but this is a problem too in the areas of services. For example, when an accounting firm out-sources some of its number-crunching to an accounting firm in India, for example, and then bills a client here in the US in US dollar terms, the work is done abroad but billed here and the work is recorded as having been done in the US, adding to US GDP when clearly that is not the case. It happens too, these days, more and more often in medicine, when patient files are sent to India or somewhere else abroad for diagnosis and the patient is billed here in the US as if the ‘work’ had been done here. GDP rises here in the US when it really should have been accounted for in India; productivity goes up; GDP goes up, when in reality neither has happened. ‘ Tis a conundrum.”
The Problem of Seasonal Adjustments
Yesterday we were told that initial unemployment claims were up slightly to 474,000 on a seasonally adjusted basis. That is down 78,000 from the same week last year. The four-week moving average is almost exactly the same. On a four-week-average basis, initial claims are down about 10% from last year.
Let’s look under the hood. The non-seasonally adjusted number (NSA) is 665,000, down almost 95,000 from last year, which is good, but still a very large number. The actual average had been over 550,000 for the last three weeks.
Everywhere the headlines said continuing claims are plunging. And they did. But what really happened is that the drop was not from people getting jobs but from people rolling over to the extended benefits programs. The states by and large pay for the first 26 weeks, and that is where we get the continuing-claim reported number from. (In some parts of the US hosever, you can get unemployment insurance for up to 99 months, paid for by the federal government.
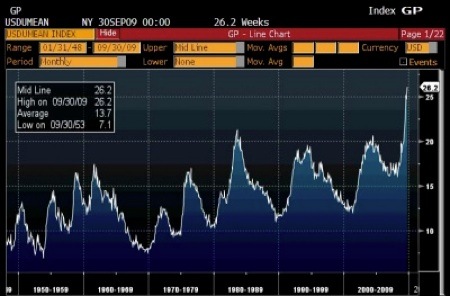
There are 5.16 million on the continuing-claim rolls. But when you add in the extended benefits rolls, it increases to over 10 million. Average length of unemployment is now over 26 weeks, and the median length is over 33 weeks!
It was reported that the unemployment rate dropped to 10% from 10.2%. To get that number, they had to shrink the number of people looking for work by 98,000. Basically, if you have not looked for work in the last four weeks, you are said to be “discouraged” and are taken out of the unemployment statistics. If you add back in the discouraged workers, the rate goes up to 10.5%. And it is worse than that. If you have not looked for a job in 12 months, you are taken off the rolls altogether.
Here is one of the reasons that the unemployment number is going to remain stubbornly high through 2010. Let’s assume a modest recovery of 3%, which is maybe enough to get jobs back into the 150,000 range. As people go back to work, that 0.5% of discouraged workers starts to look for jobs and they are now counted as unemployed. That small number of 0.5% is 750,000 people that will be (should be) added back into the unemployment numbers!
Let’s use Krugman’s 100,000 jobs a month needed to keep up with population growth. (Studies are all over the place on this. 100,000 is the low estimate and 150,000 is the high.) That means we need 1.2 million new jobs next year just to keep the unemployment rate at 10%. And another 750,000 jobs to go to the discouraged workers who will want to start looking. Close to 2 million jobs will be needed to keep the unemployment rate from rising.
And the current business climate says that is not going to happen.
The Job Creation Engine
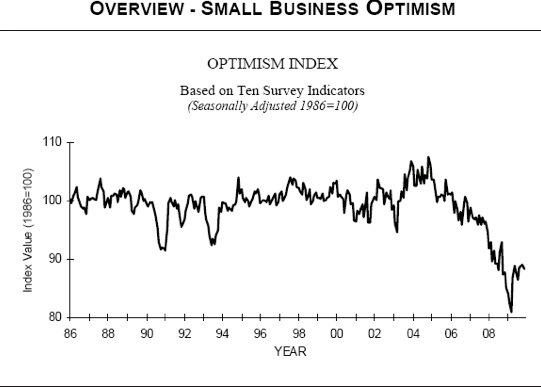
Small businesses employ 85% (or thereabouts) of American workers. That is always where the employment growth comes from. So when we see the ISM surveys, which are mainly of large businesses, that suggest they may start employing more people in the next few months, we need to see how their smaller brethren are doing. Fortunately, we have a very reliable survey by the National Federation of Independent Businesses, which does a lengthy monthly survey to give us the temperature in the small-business world. You can review it at http://www.nfib.com/Portals/0/PDF/sbet/SBET200912.pdf. (My friend and Maine fishing buddy Bill Dunkelberg puts out the report.)
It is a mixed bag, as some of the scores of questions in the survey indicate that small businesses are feeling better than a year ago. On the whole, though, they are not very upbeat. 72% of small businesses say their earnings are down over the last three months, and that has been the case for over a year. The most important reason for lower earnings is listed as poor sales volume. Sales expectations, however, are much better than earlier this year, with almost half of those surveyed thinking things will get better.
While the number of businesses that are not planning to hire any more employees in the next three months is still slightly negative, it is improving. 54% have job openings. There is not much in the way of wage pressure, as wage levels are dropping; and actual prices of the goods and services they are selling and the materials and services they are buying are falling (on average). Inventory levels have dropped precipitously, and that bodes well for hiring, as inventories at some point are going to have to be built back up
However, as Bill points out, “In November small business owners reported a decline in average employment per firm of 0.58 workers reported during the prior three
months, a big improvement from May’s record loss of 1.26 workers per firm – but still a loss of jobs. Nine percent of the owners increased employment by an average of 2.3 workers per firm, but 21 percent reduced employment an average of 4.2 workers per firm (seasonally adjusted). The “job generating machine” is still in reverse. Sales are not picking up, so survival requires continuous attention to costs – and labor costs loom large. But, job reductions are fading and job creation could cross the “0” line by the end of the year.
“Owner optimism remains stuck at recession levels. The proximate cause is very weak consumer spending, better than a year ago, but that was pretty bad. Fifteen (15) percent reported gains, while 43 percent reported weakness. With weak consumer spending, there is little need to invest in inventory (and borrow money to support inventory investment). Inventory investment plans are at historically very low levels. Similarly capital spending is on hold, with actual outlays and planned outlays at record low levels along with the demand for loans to finance the outlays. More firms still plan on reducing employment than plan on adding to their payrolls. Inventory reductions are still widespread, eight percent reported accumulation, 33 percent reported reductions. This sets the stage for new orders in future periods, but does not help much now.”
The survey kept highlighting the concerns and uncertainty about government plans for new taxes and regulations. It is hard to make plans to expand when you are not certain what your costs will be for health care, taxes, cap and trade, etc.
This is a survey we need to watch, because when it turns up we can start to feel confident about the recovery (which is still stimulus-driven). We will look back at it in a few months.
A Double-Dip Recession?
Finally, this highlights my concern about a double-dip recession. I think we could see one in 2011, as a result of the massive increases in taxes as the Bush tax cuts expire and the Pelosi-Reid-Obama crowd want to raise taxes on the “rich.” Their assumption is that if we could grow quite well in the Clinton years with higher taxes, then we can do it again.
First, if there are no changes to the proposed tax increases, this will be a massive middle-class tax hike. Make no mistake, the Bush tax cuts resulted in a huge cut in the taxes of the middle class. The data clearly shows the wealthiest 20% are paying significantly more of the total taxes paid.
If you combine a large middle-class tax increase with an even larger new wealth tax (75% of which will affect the very small businesses we just highlighted), it will be a one-two punch to the economic body, when unemployment is already at 10%. You can’t take out well over 2% (and maybe 3%) of GDP from the consumer without it having significant consequences.
Obama mentioned minor tax credits for small businesses in his plan, but then proposes to raise their taxes and health-care costs. It doesn’t work that way. But it is time to hit the send button, so I will close.
Dad Gets a Lively Lesson
A few friends noted that there was no Outside the Box this week. I plead a distraction. I got back from New York Sunday night and left my phone in my home office. I wandered in the next morning and got a call from Melissa (#2 daughter). “Dad, are you going to the hospital now?” Hospital, what hospital?
“Didn’t you get Ryan’s text? Tiffani has gone into labor.” Almost three weeks early. That was not on my radar screen. I shot a text off to Ryan and then we talked. Seems things were progressing slowly. I would have the morning before I needed to go to the hospital.
I settled down and then got a text that Tiffani was starting to push. Oops, that happened faster than we thought. I got to the hospital and went to the waiting room, where some of Tiffani and Ryan’s friends were also waiting.
Did I know what was going on? No, but they did. Seems Tiffani’s best friend is now in Belgium, where she was watching the whole process over the MacBook set up in the delivery room! She was posting (G-rated, I was assured) pictures to Tiffani’s Facebook page, where all their friends were keeping up. And of course, blow-by-blow accounts and pictures on Twitter. As we sat there, one of the young men told me my granddaughter, named Lively Bella-Grace Frederick had been born. Did I want to see a picture? And of course the in-laws, who are missionaries in Cyprus, saw the whole thing relayed by the girlfriend in Belgium.
Mom, Dad, and Lively were here this afternoon, and doing well. But I am seriously going to have to update my communication skills if I am going to keep up with my kids and grandkids. I feel so, well, out of it. Oh well. I am sure Lively will give Papa John a lesson or three over the years.
And finally, I am very excited about my special live webinar next week with Jon Sundt, President and CEO of Altegris Investments. Many of you have already registered, and I look forward to fielding your tough questions. There is still space available for this live event, so please join us! Click here to register
It’s happening next week on Thursday, December 17th, at 9:00 am PST / 12:00 noon EST. If that time doesn’t work in your calendar, simply register and you will be able to listen to the replay at your convenience.
We will be discussing some of the critical macroeconomic forces at work today and how these factors influence your investing decisions. Jon, an expert on alternative investing, will provide his assessment of alternative strategies during these challenging times. Our goal is to support you to better position your portfolio for the year ahead.
Click here for the first step in the registration process: my Accredited Investor website. From there, you’ll be automatically directed to the webinar signup page. Due to regulatory issues, this online event is limited to US investors who qualify as “accredited investors” (generally, net worth of $1.5 million or more). If you have already registered on my Accredited Investor site, please contact your Altegris account executive for a streamlined registration process. (In this regard I am president and a registered representative of Millennium Wave Securities, LLC, member FINRA.)
Have a great week. I know I am going to!
Your going to get this brave new world figured out analyst,

John Mauldin
John@FrontlineThoughts.com
John Mauldin is the President of Millennium Wave Advisors, LLC (MWA) which is an investment advisory firm registered with multiple states. John Mauldin is a registered representative of Millennium Wave Securities, LLC, (MWS) an NASD registered broker-dealer. MWS is also a Commodity Pool Operator (CPO) and a Commodity Trading Advisor (CTA) registered with the CFTC, as well as an Introducing Broker (IB). Millennium Wave Investments is a dba of MWA LLC and MWS LLC. All material presented herein is believed to be reliable but we cannot attest to its accuracy. Investment recommendations may change and readers are urged to check with their investment counselors before making any investment decisions.
Top U.S. hedge fund manager John Paulson is now much more bullish on equities in general and gold in particular. 46% of his firm’s holdings were in gold and he is starting a specialist gold fund next year.
Billionaire hedge fund manager John Paulson said on Tuesday he still sees compelling long-term returns in equities even after their sharp run-up this year, while holding no short positions in the credit markets.
“Today our net long exposure is perhaps the highest it has ever been in our portfolio,” Paulson said during a luncheon presentation at the Japan Society.
“We still find a lot of compelling long investments on the equity side,” he said, citing specifically Bank of America (BAC.N), U.S. cable-television giant Comcast Corp (CMCSA.O), and Germany’s HeidelbergCement AG (HEIG.DE).
Paulson said that at the end of 2008 he viewed the credit correction as having run its course. By April he had poured cash back into the sector.
“That is why we don’t have any shorts in credit,” he said.
Paulson, who has run his own hedge fund since 1994, has become a star investor after correctly predicting the sub-prime credit crisis in 2007. That reaped him a $3 billion profit.
The Standard & Poor’s 500 stock index .SPX is up roughly 63 percent from its March nadir, but still down 30 percent from its October 2007 all-time high.
Bank of America was identified as one of Paulson’s biggest positions when regulatory filings were released at the end of the second quarter of this year.
Based on his estimates of the company’s earnings potential and the expectation that loan loss provisions will start to drop in 2010, Paulson remained upbeat on the beleaguered bank.
“I think the worst is behind us in terms of provisioning,” Paulson said, adding: “I would expect provisioning expense to be considerably lower in 2010 versus ’09 and again much lower in 2011 versus 2010.”
Based on the current price at $15.47, “That seems to be a great buy today,” he said.
“If we look across the markets we find a lot of great buys, whether it is HeidelbergCement or Comcast,” he added.
CREDIT BUYS
Given his prescient bearish call on mortgage credits, Paulson’s views are widely watched for what he has in his $33 billion investment portfolio.
He highlighted the attractive yields on credit issued by GMAC due in Sept 2011, the former General Motors automotive financing company that the U.S. government propped up at the end of 2008.
By Paulson’s thinking, the government involvement is equivalent to an explicit guarantee on GMAC’s finances.
“So instead of buying (a) Treasury bond which yields 84 basis points, I can buy GMAC which is almost, I consider equivalent to a government bond and I can get 11 percent. That is why we have allocated so much money to this particular security,” he said.
Even as credit and equity markets looked attractive, he did reiterate his concerns that over the long-term inflation will be a problem because the government’s mountain of stimulus cash will be difficult, politically, to withdraw from the economy.
“Therefore we are concerned about high rates of inflation in the future. As an investor I became very concerned about having my assets denominated in U.S. dollars,” he said.
“So I looked for another currency in which to denominate my assets in. I feel that gold is the best currency.”
Paulson’s combined gold and gold-related investments made up more than 46 percent of his firm’s holdings at the end of the second quarter of this year.
(Reporting by Daniel Bases and Joseph Giannone, Editing by Chizu Nomiyama)
Governments the world over have spent the past year bailing out, backstopping, insuring, and stimulating their financial sectors and economies. Trillions of dollars, euros, yen, and pounds have been thrown around like Halloween candy. Officials have assured us there’s little risk to that strategy.
But we have warned consistently that the opposite is true. Our stance: If you borrow and spend too much, all you’re going to do is transform a Wall Street debt crisis into a Washington debt crisis.
Lo and behold, the bill for all this global fiscal and monetary largesse is beginning to come due. Debt and deficit problems are going from bad to worse in many nations. That’s raising the very real risk of the unthinkable: Widespread SOVEREIGN debt defaults!
Dubai Debt Proves Too Hot to Handle
The first shot across the bow came during Thanksgiving week. That’s when the tiny emirate of Dubai dropped a bombshell on the markets. A government-backed holding company, Dubai World, warned that it needed to restructure its debts. The firm is buried under $26 billion of obligations tied to its property development arm Nakheel PJSC and other subsidiaries.
The United Arab Emirates tried to assuage market concerns by pledging some aid to regional financial institutions. Many investors were also initially reluctant to sell their regional holdings because they believed Dubai’s oil-rich neighbor Abu Dhabi would step in and bail Dubai out.
But that optimism is rapidly fading. The prices of bonds issued by Nakheel, as well as other Dubai-backed companies like DIFC Investments and Dubai Holdings Commercial, are dropping fast. I’m seeing quotes as low as 44.5 and 47 cents on the dollar for some of them. Moody’s added to the concerns by downgrading the debt of several Dubai firms.
Even more troubling: The cost of credit default swaps — a form of bond insurance — on Dubai’s own OFFICIAL government debt is exploding. It just surged to 545 basis points from a pre-crisis level of around 257 basis points. That means it now costs $545,000 a year to insure $10 million of Dubai debt against default, more than twice as much as a few months ago.
Am I surprised? Not in the least. I mean, look at what Dubai has done in the past few years. It built an indoor ski slope in the middle of the desert. It constructed palm-shaped islands in the Persian Gulf, loaded up with overvalued property. And it borrowed hundreds of millions of dollars to build the tallest tower in the world, the Burj Dubai.
In other words, the Dubai debt crisis was a long time coming. But the troubling thing is that Dubai is NOT alone …
Greece Heading down the Slippery Slope to Default?
Greece is part of the European Union, and it’s rapidly sliding down the slope toward default. Its budget deficit has exploded to 12.7 percent of GDP, the worst in the 27 EU countries, while its outstanding public debt load is on track to hit 125 percent of GDP next year.
In order to avoid stiff EU sanctions and penalties, Greece is slashing its operations budget by 10 percent. The government is also planning a 2010 hiring lockdown and a partial public salary freeze. Greece’s Finance Minister George Papaconstantinou says there is “absolutely” no default risk.
But those measures don’t appear to be comforting investors. The Athens Stock Exchange General Index has plunged more than 28 percent from its mid-October high. Meanwhile, Greece’s two-year government debt just dropped in price by the most in 11 years. Yields on those securities have more than doubled to 2.97 percent from 1.32 percent in less than a month!
Fitch has already cut Greece’s sovereign debt rating to “BBB+.” That’s the third-lowest investment grade rating. Standard & Poor’s rates Greece “A-,” but that rating may be lowered soon.
Bottom line: We’re facing the very real possibility of a significant sovereign debt default or bailout in Europe.
What about Spain? The U.K.? The U.S.?
At times like these, investors naturally ask themselves where the next domino might fall. My answer: How about Spain? S&P just lowered its credit outlook for that country to negative from stable. The ratings agency cited “pronounced deterioration” in the country’s public finances.
Spain is in trouble because it experienced its own gigantic housing bubble, one that has long-since popped. Unemployment is on track to top 20 percent in 2010, while the nation’s deficit is swelling toward 11 percent of GDP. The economy has shrunk for six straight quarters, prompting the government to spend billions of dollars to stimulate growth.
Then there’s the U.K. Its budget deficit is running at 12 percent of GDP, the highest in the Group of 20 community of nations. That’s forcing the government to impose a 50 percent tax on banker bonuses, and to boost income taxes. Despite those moves, the U.K. Treasury is still going to have to borrow billions more pounds than it originally planned to fund its deficit.
And what about us? The fiscal 2009 budget deficit here soared to $1.4 trillion, the worst ever. That was equal to 9.9 percent of the overall economy — almost triple the level of a few years ago and the highest in the nation’s history, excluding years where deficits were bloated by massive war spending (à la World War II). Over the next decade, the Congressional Budget Office projects an additional $7.2 trillion-plus in red ink.
We are now borrowing record amounts of money, week in and week out, to underwrite our profligacy. Example: In the week of Thanksgiving alone, the U.S. was forced to sell a whopping $118 BILLION in debt. That included $44 billion in two-year Treasury notes, $42 billion in five-year notes, and $32 billion in seven-year notes — all record amounts for any single auction.
Our debt load is rising so fast, Congress will soon need to raise the so-called debt “ceiling.” The current $12.1 trillion limit could reportedly jump by as much as $1.8 trillion.
Everyone knows the cap is a joke. Every time we come close to tagging it, lawmakers just raise it again. But the frequency and size of those increases is getting totally out of control.
Indeed, we may be seeing the first signs of a bond investor rebellion. Yesterday’s auction of $13 billion in 30-year bonds bombed big time. The Treasury could only sell the debt by offering much higher-than-expected yields, and even at those elevated yields, key measures of demand were weak.
Result: A key interest rate spread — the difference between yields on 2-year notes and 30-year bonds — blew out to 372 basis points. That’s the highest in 29 years of record keeping.
The loud and clear message from the bond market? We’ll buy very short-term Treasuries six ways ’til Sunday. But if you want to borrow long-term money at the same time you’re printing dollars like crazy and selling the most bonds in the history of the world, you’re going to have to pay up!
Nobody expects the U.K. or U.S. to lose their AAA debt ratings anytime soon. But Moody’s just warned in a report that both countries’ ratings are at more risk than those in other triple-A rated countries like Germany and France. And I don’t see any credible plan coming out of Washington to get our disastrous budget situation under control.
Given this environment, my advice for investors is simple: Avoid investing in regions where sovereign credit risk is rising. Focus instead on countries where government debt and deficits are NOT a major threat. For instance, China, Brazil, and Australia are generally sitting on massive reserves, seeing healthy growth, and otherwise prospering even as Greece, Dubai, and Spain struggle.
You may also want to think about lightening up your risk a little bit. That’s what I’ve been doing in some of my services, as my paying subscribers know.
Until next time,
Mike
This investment news is brought to you by Money and Markets. Money and Markets is a free daily investment newsletter from Martin D. Weiss and Weiss Research analysts offering the latest investing news and financial insights for the stock market, including tips and advice on investing in gold, energy and oil. Dr. Weiss is a leader in the fields of investing, interest rates, financial safety and economic forecasting. To view archives or subscribe, visit http://www.moneyandmarkets.com.
-
I know Mike is a very solid investor and respect his opinions very much. So if he says pay attention to this or that - I will.
~ Dale G.
-
I've started managing my own investments so view Michael's site as a one-stop shop from which to get information and perspectives.
~ Dave E.
-
Michael offers easy reading, honest, common sense information that anyone can use in a practical manner.
~ der_al.
-
A sane voice in a scrambled investment world.
~ Ed R.
Inside Edge Pro Contributors

Greg Weldon

Josef Schachter

Tyler Bollhorn

Ryan Irvine

Paul Beattie

Martin Straith

Patrick Ceresna

Mark Leibovit

James Thorne

Victor Adair