
Daily Updates
Market Buzz – K-Bro Continues to K-Gro
Taking its queue from U.S. markets, the TSX closed lower this past week reversing its beak out from what was a three month trading range below the 11,800 level.
The Dow Jones industrial average had its first triple-digit drop of 2010 as loan losses at JPMorgan Chase & Co. and a disappointing consumer sentiment reading sent investors rushing from stocks. JPMorgan, regarded in the wake of the financial crisis as one of the strongest U.S. banks, warned investors it was too soon to say that losses on mortgages and other loans have peaked.
The warning should serve as a cautionary note that the U.S. and North America in general, is not yet out of the woods economically and a strong recovery is by no means a certainty. Again, we caution investors to review their portfolios with their financial advisors and take profits where appropriate in individual companies if their valuations have gotten well ahead of themselves.
Switching gears, we take a brief look at a positive announcement from one stock in our Canadian Small-Cap Universe (www.keystocks.com).
The announcement came from K-Bro Linen Income Fund (KBL.UN:TSX), the largest owner and operator of laundry and linen processing facilities in Canada. This past week, the company announced that it has reached an agreement to acquire an existing linen business located in Burnaby, B.C. The acquired business consists of Vancouver healthcare institutions and hospitality customers in both the greater Vancouver area and Whistler, British Columbia. K-Bro will acquire all assets of the owner’s Vancouver linen business, including the processing plant that operates from a leased facility.
The purchase price is $11.5 million, with additional amounts paid for working capital above a normalized level. Annual revenues from the acquired business were $14.4 million in its most recent fiscal year ended June 30, 2009. Management estimates that adjusted EBITDA was approximately $1.7 million for that fiscal year. These operating results, combined with potential synergies, results in an acquisition that management believes will be immediately accretive to the Fund.
Looniversity – Stop Orders 101
Stop orders are a type of order placed with a broker to buy or sell a security when its price surpasses a particular point, thus ensuring a greater probability of achieving a predetermined entry or exit price, limiting the investor’s loss or locking in his or her profit. Once the price surpasses the predefined entry/exit point, the stop order becomes a market order.
Investors can use a stop order before leaving for holidays or entering a situation where they are unable to monitor their portfolio for an extended period. Stops are not a 100 per cent guarantee of getting the desired entry/exit points. For instance, if a stock gaps down, the trader’s stop order will be triggered (or filled) at a price significantly lower than expected.
Traders who use technical analysis will place stop orders below major moving averages, trendlines, swing highs, swing lows or other key support or resistance levels.
Put it to Us?
Q. If I buy a stock at $30 and I put a stop limit in to sell at $27, will I be guaranteed a sell once the stock has reached this price?
– Randal Paulson; Calgary, Alberta
A. Not necessarily. This is unfortunately one of the problems with orders. If a stop order is established, it means that the stock will be sold at or beneath a certain price. If you own 500 shares of a company trading for $30 and you put a stop order in at $27, it could be executed at $27 on the dot; but if the market is dropping fast, it may be executed at $26.50 or a range of lower prices as your shares are being sold off.
With a stop-limit order, you shrink the downward range by saying you only want those shares to sell at $27. For this to work, another person in the market has to bid $27 for all 500 of your shares. However, if there isn’t a bid, or a combination of several bids, for 500 shares at $27, then your order won’t be executed. In widely traded stocks with high volume, this is usually not a problem. But it can be a problem in smaller or mid-cap issues with less liquidity, so keep this in mind. Broadly speaking, it is not often wise to actively “trade” in and out of illiquid stocks.
KeyStone’s Latest Reports Section (must be a premium member)
KeyStone -Why Subscribe?
- First coverage on high growth, profitable stocks, trading at low prices
- Independent and updated BUY/SELL/HOLD Stock Reports
- Unsurpassed 9-year track record of uncovering great small caps with strong fundamentals
- About Keystone Financial HERE – Go HERE to subscribe
Richard Russell has made his subscribers fortunes. One of the best values anywhere in the financial world at only a $300 subscription to get his DAILY report for a year. HERE to subscribe. Amongst his achievements Richard was in cash before the 2008/2009 Crash and he has been Bullish Gold since below $300
Ed Note: Richard Russell is bullish Silver and holds one of the largest single positions he has held since the 1950’s in the precious metals.
From his June 6th Daily Report
They call it “the poor man’s gold.” But don’t turn your nose up at silver. The dollar was originally defined in terms of silver. When precious metals are on the rise (as now), silver tends to be seen as a monetary metal. When times are bad, silver is seen as an industrial metal. Silver has a huge number of industrial uses, silver is the best conductor of electricity. Unlike gold, silver is actually used (and used up) in industry. Thus, a large amount of silver is lost every year. In contrast, 85% of all the gold ever mined in all history is still around; it’s in your teeth or in your sweeties’ bracelet or in that ancient Egyptian ring that you see in your local museum.
Historically, when silver gets going, it tends to make huge percentage moves. I think you can see that from the long-term chart below. For instance, back in November 2008, silver was selling for 8.65 an ounce. Today an ounce of silver is selling for 18.10 an ounce, more than double.
Silver is now climbing back from a drastic correction, as you can see via the chart below. In December silver hit a high of over 19 dollars an ounce. Back in 1980 (and I remember this well) silver climbed wildly (limit up day after day), and it hit $50 dollars an ounce around January of 1980.
Silver is now in a erratic bull market. How high it may go I don’t know, but I would not be shocked to see silver ultimately climb above its 1980 price of $50 bucks an ounce. Historically, once ounce of gold will buy around 15 ounces of silver. Today an ounce of gold will buy 62 ounces of silver. Silver compared with gold is dirt-cheap today.
——————-
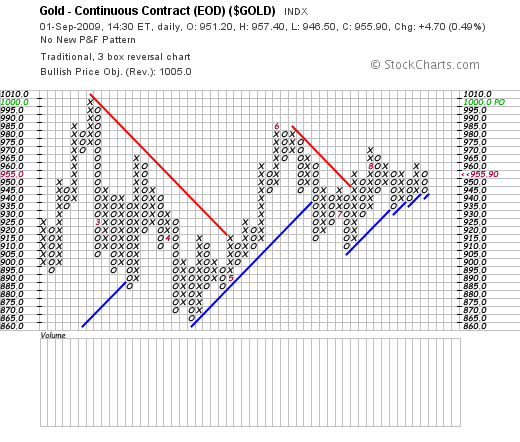
Below I show a point&figure chart of silver. The white metal is now in a well-established rising trend. The upside target is the 21 box. If silver hits the 22 box, that will light the fuse. If silver hits the 22 box, I will view the whole structure that you see on this chart as one huge base.
(Updated Jan 8th Chart)
- 2010: A Year of Uncertainty
- “Rocking Even Me”
- Prisoners of Our Preconceptions
- The Statistical Recovery
- The Great Experiment
- Whither the Fed?
- London, Monte Carlo, Zurich, and Stocks
2010 Forecast: The Year of Uncertainty
“Lying here, during all this time after my own small fall, it has become my conviction that things mean pretty much what we want them to mean. We’ll pluck significance from the least consequential happenstance if it suits us and happily ignore the most flagrantly obvious symmetry between separate aspects of our lives if it threatens some cherished prejudice or cosily comforting belief; we are blindest to precisely whatever might be most illuminating.”
— from Transition, by Iain M. Banks
Still a man hears what he wants to hear
And disregards the rest
— The Boxer, by Paul Simon
“They Are Rocking Even Me”
This will be my tenth annual forecast issue. Time has flown by, and I enter a new decade of writing Thoughts from the Frontline. And even as I write about the high level of uncertainty of the current times, I am optimistic that at the opening of the next decade we will look back and realize that there has been an enormous amount of progress made. None of us will want to revisit the pleasures of the past ten years in some nostalgic dream. I am so ready for a new decade. And speaking of Paul Simon (above), reading the lyrics of The Boxer, one of my favorite songs from my youth, another few words seemed to hit home:
…Now the years are rolling by me, they are rockin’ even me
…I am older than I once was, and younger than I’ll be, that’s not unusual
…No it isn’t strange, after changes upon changes, we are more or less the same
At the end of the letter I announce the dates for our annual Strategic Investment Conference, tell you about an important conference I will be attending next month for 9 days (a rather large chunk of time for me!), and drop a hint about why I am going to actually buy some stocks this decade.
…..continue reading HERE.
BlackRock, Inc. (BLK) Vice Chairman Bob Doll has been putting out annual predictions for 15 years. Doll, who helps oversee about $3.2 trillion at BlackRock, the world’s biggest asset manager, just released his ten predictions for 2010 and for the next ten years. Eleven of the twelve predictions he made for 2009 were right. Below are Highlights of his latest market forecasts.
Doll’s Predictions for 2010
- U.S. economy grows above 3% outpacing the developed world
- Unemployment to remain high, but with positive job growth
- Earnings rise significantly – 20-30% on cost & productivity advantage particularly from a weak dollar.
- Inflation a non-issue for the developed countries, but oil and gold will still go up
- Interest rate rises on treasury curve – 10-year treasury targets 4.5%
- Stock outperform cash and treasury – S&P 500, should rally another 12%
- Emerging markets outperform
- Health care, IT & Telecom outperform
- More M&As
- Dems stay in control of the Congress
Doll’s predictions for the next 10 years:
- US equities experience high single digit percentage total returns, in the range of 6% to 8% annually, after the worst decade since the 1930s.
- Recessions occur more frequently during this decade, rather than only once a decade as occurred in the last 20 years.
- Healthcare, information technology, and energy alternatives are leading growth areas for the United States.
- The US dollar continues to become less dominant as the decade progresses.
- Interest rates move irregularly higher in the developed world.
- Country self-interest leads to more trade and political conflicts.
- An aging and declining population gives Europe some of Japan’s problems.
- World growth is led by emerging market consumers.
- Emerging markets weighting in global indices rises by 10 percentage points.
- China’s economic and political ascent continues.
Doll’s Advise to Investors
- Look for quality in all styles and caps.
- Focus on better-positioned sectors – IT, healthcare and telecommunications are his favorite sectors.
- Think about geography – Emerging markets, Brazil, in particular.
- Gains will be harder to come by – Ongoing volatility and selectivity will be critical.
…..read the whole article in Economic Forecasts & Opinions HERE
This summary from ZeroHedge.com whose founder Tyler Durden is possessed of the belief that a return to (more) efficient markets is a possibility and a necessity. Refugee of various asset managers and advisers, as his namesake, Tyler remains convinced the current model is flawed and a deleveraging at every level of modern society is needed to reignite the fundamental entrepreneurial spirit.
Interest Rate Observations From Morgan Stanley
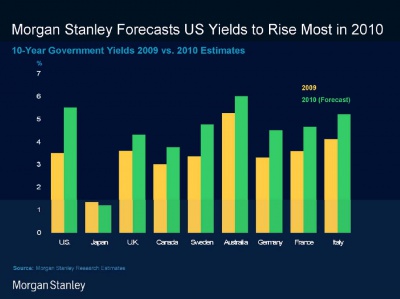
Morgan Stanley, which recently made the daring call for a 5.5% yield on the 10 year by the end of 2010, and which has recently caught the attention of many finance pundits, provides some more projections for 10 year rates not only in the US but globally. Curiously, out of all countries, Morgan Stanley only sees Japan lower by the end of 2010, with all developed countries higher, but none moving as much as the US. Furthermore, by the end of 2010, only Australia will sport a 10 year rate wider than the US, predicts MS.
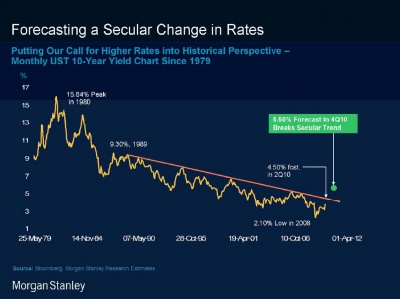
The recent evolution of the credit market in the US is seen on the next slide: if indeed the 10 year hits 5.5% this will be the first major break of the secular trendline ever tighter since the 1980’s bull market. Can someone make the case that all a key reason for secular market gains over the past 30 years have been on the back of a consistently lowering cost of debt capital? We think the answer is a resounding yes.
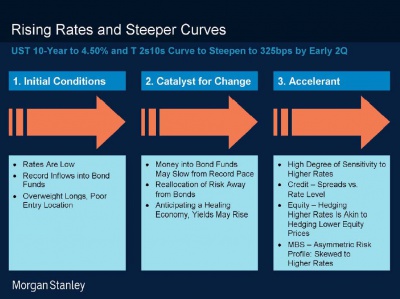
The last observation highlights the expectation that the 2s10s curve will steepen to a record 325 bps by early Q2. Whether this happens as quickly as expected will depend on the presence of an “accelerant” which MS defines as the following:
- High degree of sensitivity to higher rates
- Spreads versus Rate levels from a credit perspective
- Hedging higher rates is comparable to hedging lower equity prices from an equity perspective
- Asymmewtric risk profile in MBS which is skewed to higher rates.
(Larger Image of the Chart below HERE. )
What is missing are the implications for the economy if MS is indeed right. But those are all too obvious, which is why the Fed will do everything in its power to prevent that from happening.
-
I know Mike is a very solid investor and respect his opinions very much. So if he says pay attention to this or that - I will.
~ Dale G.
-
I've started managing my own investments so view Michael's site as a one-stop shop from which to get information and perspectives.
~ Dave E.
-
Michael offers easy reading, honest, common sense information that anyone can use in a practical manner.
~ der_al.
-
A sane voice in a scrambled investment world.
~ Ed R.
Inside Edge Pro Contributors

Greg Weldon

Josef Schachter

Tyler Bollhorn

Ryan Irvine

Paul Beattie

Martin Straith

Patrick Ceresna

Mark Leibovit

James Thorne

Victor Adair