
Daily Updates
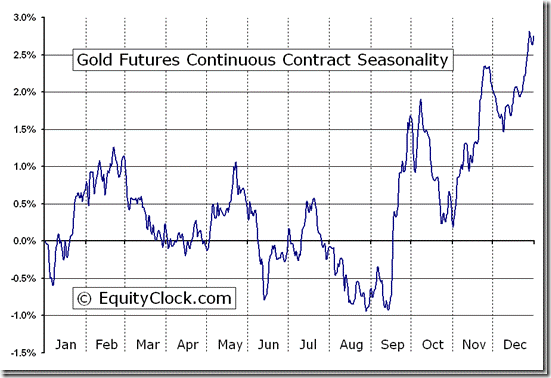
Strength in gold and gold stock happens at an interesting time. Strength is occurring despite strength in the U.S. Dollar. Historically, gold and gold stocks have moved inversely with the U.S. Dollar. Yesterday, the U.S. Dollar broke resistance to reach a 13 month high. That’s an encouraging sign for gold and gold stocks.
….read more HERE
…..read Brooke Thackray’s Seasonal Letter HERE
CANADIAN HOUSING STILL BUBBLY, BUT SIGNS OF SLOWING AT THE MARGIN
We saw another piece of Canadian housing data, with the release of the relatively new Teranet/National Bank House Price index for February. This index can be dubbed as the Canadian “Case-Shiller” index because it uses the same methodology as the U.S. Case-Shiller index.
The year-over-year rate for the overall index continued to accelerate in February, to 9.9% from 7.5% in January. However, as we saw with Tuesday’s U.S. Case- Shiller index, depressed levels from last year are boosting year-over-year comparisons and we will likely continue to see this until April. Even with the increase in February, we are still off the record 14% YoY high posted in November 2006. Toronto and Vancouver continue to be the frothiest markets, up 13.3% YoY (a record high) and 11.8% YoY, respectively.
On a monthly basis, we are starting to see some evidence of slowing as the national index was up 0.2% MoM, the smallest increase in 10 months. Again, Toronto and Vancouver registered the highest gains (0.4% and 0.6% MoM, respectively) but Calgary and Ottawa actually saw prices decline on the month.
In today’s issue of Breakfast with Dave
• While you were sleeping: mixed action in global equity markets; bonds are roughly flat; commodities are firm this morning
• Equities discover our income theme: for the first time in six years, no S&P 500 company is going to be cutting their dividend payout
• Bleak job market outlook in the U.S.: of the 8 million jobs lost in the U.S. during the “Great Recession”, three-quarters were in positions that are not likely to come back
• Reality check for the big bold bullish take on the U.S. consumer
• What happens when the Bank of Canada goes for a hike?
• FOMC press statement: a non-event for the most part, although the Fed did update and modestly upgraded its macro view
• Bullish investor sentiment still not dented
……read full article HERE
……read summary HERE
• Canadian housing still bubbly, but signs of slowing at the margin
• Ban the bailout: we have governments bailing out banks, homeowner debtors, and now we have government bailing out governments — when does someone finally say, enough is enough!
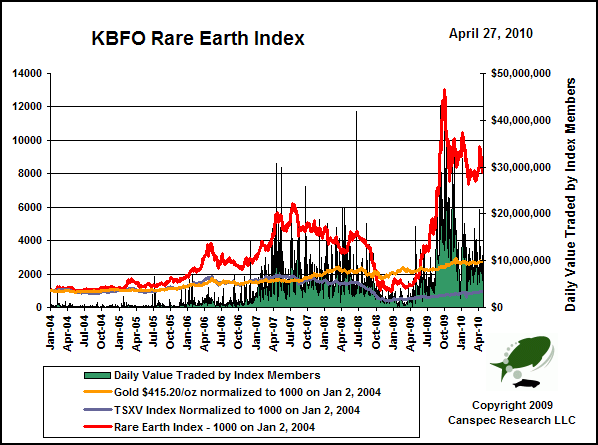
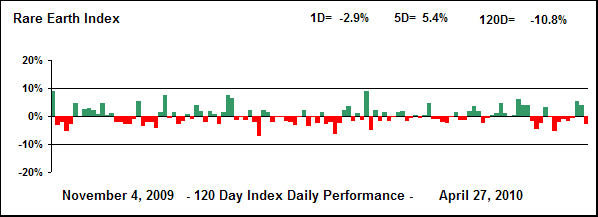
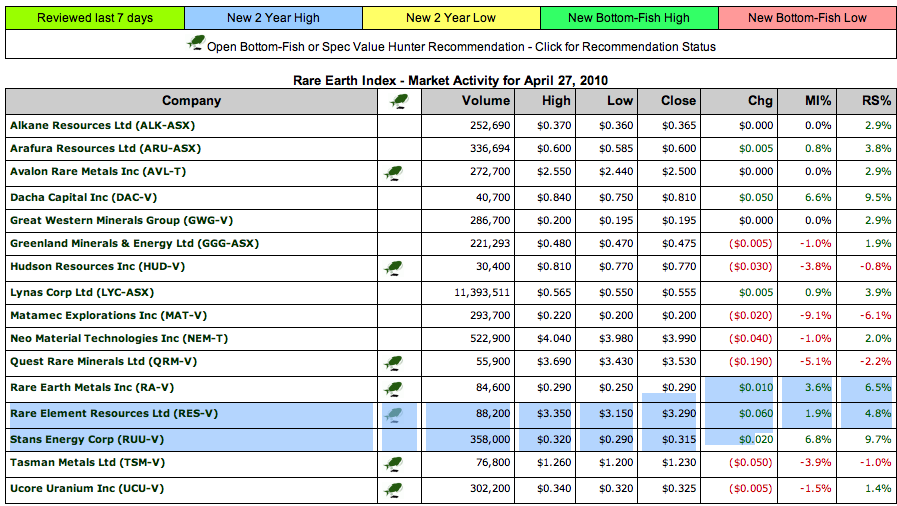
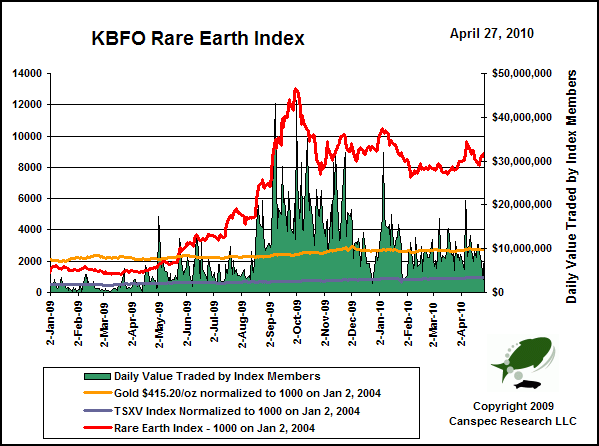
The KBFO Rare Earth Resource Center is designed to help investors get acquainted with the rare earth sector, track the KBFO Rare Earth Index, and get quick access to rare earth related articles published on Kaiser Bottom-Fish Online. The Rare Earth Index consists of Australian and Canadian stock exchange listed companies with advanced rare earth deposits or downstream processing operations. Details are available through our KBFO Members Only Rare Earth Index report. For a general overview of the logic driving Rare Earth Mania see Making Sense of the Emerging Rare Earth Mania posted on ResourceInvestor.com. Most people, however, still think the fuss about rare earths is little more than yet another commodity bubble (Economist: The hunt for rare earths – Oct 8, 2009.
Ed Note: for larger charts go HERE
Ed Note: for all larger charts as below go HERE
Rare Earth Production and Global Resource Base
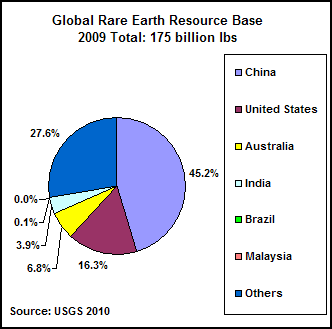
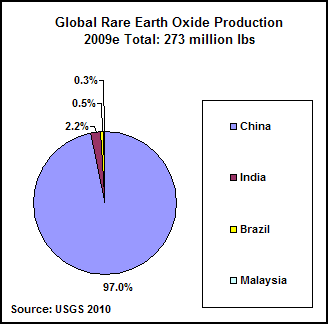
The Global REO Production chart above based on USGS estimates for 2009 paint a grim portrait of China producing 97% of all rare earth oxides, with the remainder from India, Brazil and Malaysia produced in the form of monazite based heavy mineral sands. The other chart suggests that more than half the world’s resource base exists outside of China.
….continue reading and view 18 more charts in the last 2/3rds of the article HERE
“By a continuing process of inflation, governments can confiscate, secretly and unobserved, an important part of the wealth of their citizens … in a manner which not one man in a million can diagnose.”— John Maynard Keynes
- Is the Financial Crisis Over – Are Our Governments Bankrupt Yet?
- Bail us Out with Printed Money and We’ll Fund Your Deficit
- Double Dip on its Way? What Will the Central Banks Do Then?
- Is Anyone Going to be Able to Pay for the Boomers’ Retirement?
- Moral Hazard and The Fallacy of the Safe Canadian Banking System
- Interest Rates Versus Rollover – Pick Your Risk
- Surprise – AIG Took the Fed to the Cleaners
- Banking Sector Back to Record Profits
- By 2012 Surplus Oil Production Capacity Could Disappear
- Oil Demand Back Past 2007 Peak
Will Rogers famously quipped, “It is difficult to make predictions, especially about the future”. Ignoring Mr. Rogers’ sage advice I will attempt to make some educated guesses about the future anyway, albeit with the assistance of some analysts far more prescient than I.
...to go straight to ![]() ‘s 10 Page Report go HERE
‘s 10 Page Report go HERE
The evidence from Kenneth Rogoff’s recent research is that in the three years following a financial crisis, on average, cumulative fiscal deficits almost double. We seem to be well along this path in the current crisis.
Rogoff’s research also shows that how these deficits are financed is critical to the question of whether inflation ensues, whether you have a Japanese or an Argentinean style post-crisis experience. If the deficits are funded from existing private sector savings (“belt-tightening” as Rogoff describes it) they are typically not inflationary – e.g. Japan. If they are monetized by the central bank (the money is created) they are inflationary – e.g. Argentina.
Today, in one corner, we have the wholesale liquidation of mal-investments that have accumulated in virtually every segment of the western economies from residential and commercial real estate down to the municipal bond markets. In the other corner, we have governments that are actively resisting this cleansing process as it threatens the solvency of the politically influential financial sector.
The result is that via bailouts and unprecedented fiscal deficits private sector credit problems are being moved onto public sector balance sheets – balance sheets that are already in precarious condition from past over-spending and unfunded future liabilities. By nationalizing private sector losses governments around the globe are seriously compounding their existing budget problems.
According to research by Société Générale, EU and US net liabilities add up to around $135 trillion. That’s roughly four times the capitalization of the world’s equity markets and forty times the cost of the 2008 financial crisis. The US plans to accumulate an additional $10 trillion in deficits over the next decade.
These enormous numbers beg the question of how our governments plan to fill their funding gaps? Of course they will attempt to raise taxes, but it seems clear that they are going to resort to inflation as well. Inflation is more politically expedient as the alleged benefits are immediate while the all too real costs are delayed.
To borrow yet again from Jens Parsson and his excellent book “Dying of Money”:
“The government is free to incur any deficit and issue any amount of debt it may wish, so long as it is willing to draw purchasing power away from other borrowers and to tolerate the rise in interest rates which will result. The debt will create no inflation.
Government deficits and government debt thus are not inflationary if they stand alone, but they never stand alone. The creation of government debt is practically always accompanied by an increase of money. Competing against private borrowers for a static supply of credit capital, a large government debt issue would drive interest rates upward, and high interest rates are anathema to a government.
A large government debt issue simply could not be marketed without a large increase in the money supply. Therefore the government creates not only the debt but also the money with which to buy it. In addition, large government deficit expenditure tends to accelerate the velocity of money because the government spends its money more rapidly than cautious private spenders do. This combination of increased quantity and velocity of money, not the deficits, does the job, both for economic stimulation and for monetary inflation.”
Now here is an attempt at one of those tricky guesses about the future – will we see inflation or deflation over the next decade? I believe you can answer this question by considering the effect of the following factors:
– Government Spending & Deficits – increasing
– Regulation – increasing
– Taxes – increasing
– Money Supply – increasing
Based on these factors I believe that rather than outright inflation or deflation we face stagflation in the developed world as further state expansion into the economy will reduce real growth while accelerating fiscal deficits combined with money supply expansions will lead to inflation.
Low growth + high inflation = stagflation
Therefore, our investment thesis continues to be to gain long-term exposure to inflation hedging, income generating assets, with demonstrated linkages to emerging market growth – energy and agriculture remain our preferred sectors.
Kind Regards
Stephen Johnston
..to scan the 10 Page Report go HERE
A Clear Warning Sign: Global Liquidity Is Drying Up!
In last week’s Money and Markets column I told you the majority of my indicators are signaling that the stock market has probably entered the last phase of its medium-term uptrend, which began in March 2009.
I went over price-to-earnings ratios (based on twelve-months trailing GAAP earnings) and dividend yields. Both metrics are showing a heavily overvalued market.
Today I want to add that “normalized earnings,” which try to even out the impact of the ups and downs in the business cycle, are strongly supporting this message.
Plus, I’d like to give you updates on what I discussed last week and tell you about one more important signal …
Sentiment Indicators Still Euphoric
I reported that mutual fund cash level was an excessively low 3.5 percent in February. Now the March figure is in, and it’s the same as February’s! The only other time we’ve seen fund managers holding such a low level of cash was in the summer of 2007, a short three months before a major stock market high.
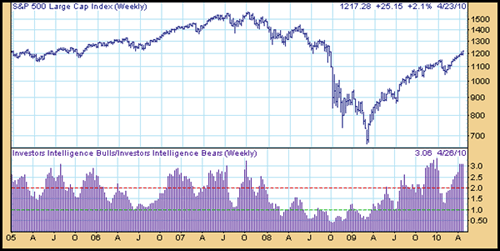
Next, I want to give you the latest readings of Investors Intelligence Advisory Sentiment …
The bullish contingent stands at 53.3 percent, up from 51.1 percent just a week ago. Whereas bearish advisors are down to a very low 17.4 percent, well below the 20 percent threshold typically indicating at least short-term danger for the stock market.
Even more bothersome is the most recent ratio of bullish to bearish financial newsletters, currently at 3.06, as shown in the second panel of the chart below. Last week it was 2.7.
This tells us that the short-to medium-term upside potential is very limited.
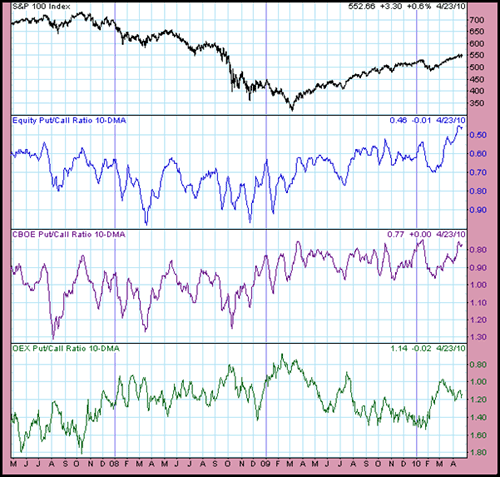
Then I discussed how equity put-call ratios had fallen to levels not seen since 2000, the year of the famous NASDAQ top, when the dot com bubble burst.
Well, as you can see in the second panel of the following chart this ratio is still hovering around that extremely low level. The 10-day average is currently at 0.46, up a meager 0.01 from last week.
And the 10-day average of the total CBOE put-call ratio, the third panel of the chart, is still a very low 0.77. Last week’s small market correction did nothing to dampen option speculators’ willingness to bet on further rising stock prices.
What’s more …
Liquidity Has Dried Up Globally
There still seems to be a lot of talking about the huge liquidity driving this market higher. And yes, the Fed’s answer to the housing and banking crisis was a historical wave of liquidity with M-2 money supply growth rates of more than 10 percent. But take a look at the chart below to see what has happened since.
Year over year M-2 growth has stalled … growing by a mere 2 percent. That’s a far cry from a huge wave of liquidity. It’s better described as a trickle.
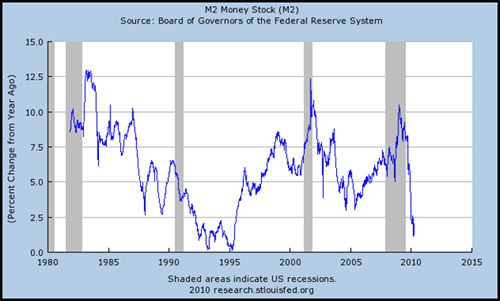
And if you take a global view, the picture is even getting worse!
The so called excess liquidity of the G7 nations, measured as M-1 minus industrial production minus consumer price inflation, has actually declined by 5 percent during the first quarter of the year.
If this global stock market rally was driven by liquidity — and I really think it was — the drying up of global liquidity should be seen as a clear warning sign.
The bull move, which in my opinion was a huge bear market rally that started in March 2009, is already on borrowed time. And I expect the market to top out during the coming months.
Best wishes,
Claus
Claus Vogt is the editor of Sicheres Geld, the first and largest-circulation contrarian investment letter in Europe. Although the publication is based on Martin Weiss’ Safe Money, Mr. Vogt has provided new, independent insights and amazingly accurate forecasts that, in turn, have contributed great value to Safe Money itself.
Mr. Vogt is the co-author of the German bestseller, Das Greenspan Dossier, where he predicted, well ahead of time, the sequence of events that have unfolded since, including the U.S. housing bust, the U.S. recession, the demise of Fannie Mae and Freddie Mac, as well as the financial system crisis.
He is also the editor of the German edition of Weiss Research’s International ETF Trader, which has delivered overall gains (including losers) in the high double digits even while the U.S. stock market suffered its worst year since 1932.
In addition to being the editor of Million-Dollar Contrarian Portfolio, his analysis and insights appear regularly in Money and Markets.
This investment news is brought to you by Money and Markets. Money and Markets is a free daily investment newsletter from Martin D. Weiss and Weiss Research analysts offering the latest investing news and financial insights for the stock market, including tips and advice on investing in gold, energy and oil. Dr. Weiss is a leader in the fields of investing, interest rates, financial safety and economic forecasting. To view archives or subscribe, visit http://www.moneyandmarkets.com.
-
I know Mike is a very solid investor and respect his opinions very much. So if he says pay attention to this or that - I will.
~ Dale G.
-
I've started managing my own investments so view Michael's site as a one-stop shop from which to get information and perspectives.
~ Dave E.
-
Michael offers easy reading, honest, common sense information that anyone can use in a practical manner.
~ der_al.
-
A sane voice in a scrambled investment world.
~ Ed R.
Inside Edge Pro Contributors

Greg Weldon

Josef Schachter

Tyler Bollhorn

Ryan Irvine

Paul Beattie

Martin Straith

Patrick Ceresna

Mark Leibovit

James Thorne

Victor Adair