
Daily Updates
It’s a “Stock Picker’s Market” in Junior Oil and Gas
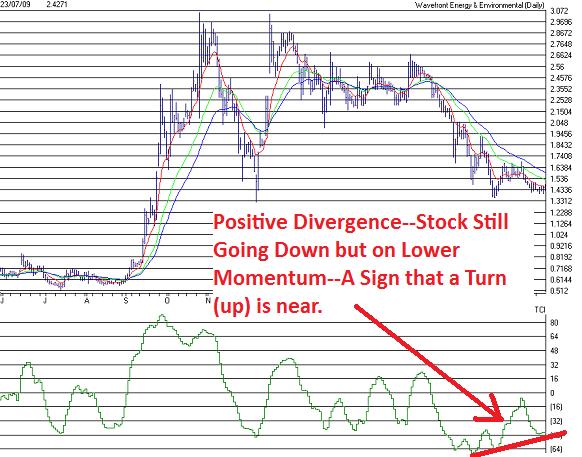
I recently wrote that junior energy stocks were trading like they had an incurable disease; nobody wants to touch them. But now several junior oil stocks are starting to show positive divergence, which means that the momentum of the downward selling pressure is getting less and less.
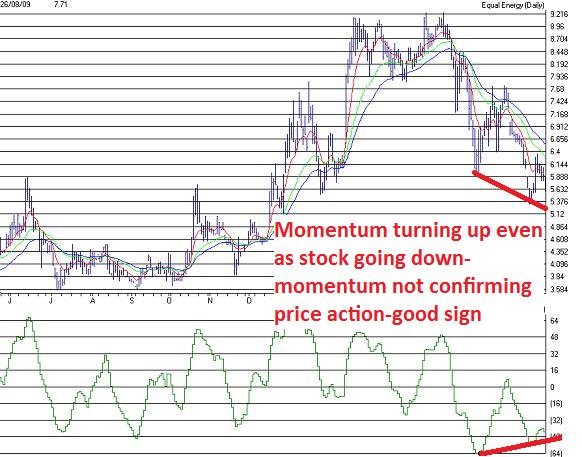
This is also called “momentum non confirmations”, and so far my observations are focused on the short term charts on many of the junior oils; it’s too early to tell on most of the longer term, weekly charts.
This means that, in the short term, the stocks are running out of momentum on the downside, and have started to show some signs of upward momentum. This is often a good indicator of a possible change in direction in share price. It also means that good news out of junior oil stocks should once again get recognized by the market.
Here are a few charts that illustrate my points:
WAVEFRONT Technology (WEE-TSXv)
EQUAL ENERGY (EQU-TSX)
Some short term charts have completely turned, like Bellatrix (BXE-TSX)

Now, here is one longer term chart that is showing good long term momentum improvement – the 3 year chart on the TSX Energy Index.
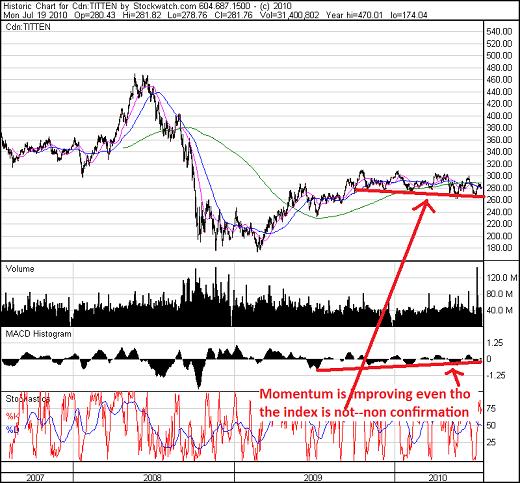
On many longer term charts, the intermediate indicators have now returned to neutral, or slightly oversold, and many have returned to their longer term moving averages. This is a good start, but more base building (prices trading within a certain range, like oil between $70-$90/bbl) may still be required.
Generally speaking, the longer the base, the larger and more sustainable the move up. This extended basing period would provide a larger base for these stocks to launch the next leg up. And of course this all assumes continuing solid fundamentals supporting these stocks such as strong oil prices and positive growth.
We may see another retest of the recent lows, although this isn’t necessary for the technicals to turn positive. Like these charts show, it’s more important now, in the mid part of a price consolidation, that the market starts to see higher highs and higher lows in momentum, and the prices will follow – if not move in tandem, as I showed on the Bellatrix chart.
But this is only happening on the short term charts. Because the intermediate indicators have not yet shown any signs of basing yet, these charts may back and fill a few times in the near term. Whether the news flow on oil prices and markets is good or bad will dictate how much more time is needed before prices begin another positive price trend.
And that brings up an important point.
You’ll recall that after the significant price moves of 2009, price momentum was extremely overbought. And, as I mentioned, it’s taken this long to return to slightly oversold on an interim basis.
So there could be a lot of work to do yet on these long term junior oil stock charts.
But that creates what I call a stockpicker’s market; and I’ll take that. That’s where the educated investor can make superior returns, while the average oil and gas investor waits for a sustained uptick in the price of oil.
DISCLOSURE – I own Bellatrix and Equal
About Keith Schaefer & The Oil & Gas Investments Bulletin
Hello, this is Keith Schaefer, editor and publisher of The Oil & Gas Investments Bulletin. I started my subscription service in mid-2009 because I could see there was no place where retail investors could go to easily find which oil and gas companies were creating huge shareholder wealth by using exciting new technologies, such as horizontal drilling, fracing and 3D seismic.
These companies are increasing cash flows – and stock prices – by finding ways to get more oil and gas out of the ground. And junior and intermediate producers – $2-$20 stocks – are leading the way.
I find the leaders in the new plays that are using these technologies. My research is finding higher and higher flow rates from new wells in old formations as management teams fine tune their use of these new technologies.
It’s amazing how technology is lowering operating costs – and increasing profits – for many publicly traded energy companies.
I find the ones who have the capital and the knowledge to be the fastest growing in their area – this usually means they have a large undeveloped land position in an area where either production costs are very low or production rates can be very high. They are covered by several research analysts, so there is research support and institutional money flow behind them.
And my subscribers and myself are making money from my research. I eat my own cooking and buy all the stocks I research for subscribers.
No executive would dispute that analysts’ forecasts serve as an important benchmark of the current and future health of companies. To better understand their accuracy, we undertook research nearly a decade ago that produced sobering results. Analysts, we found, were typically overoptimistic, slow to revise their forecasts to reflect new economic conditions, and prone to making increasingly inaccurate forecasts when economic growth declined.
Click on chart to expand

Reasons for Nonsensical Earnings Estimates
- Analysts do not do their homework on what is really happening and why. Instead they see rising earnings and take them at face value, nearly always figuring following quarters will be better yet.
- Analysts do not understand the dynamics of debt deflation, peak credit, the baby boomer retirement dynamics, etc. In short, Analysts do not understand the global macro picture is bleak.
- Analysts look at a steep yield curve and think the Fed can lift the economy.
- Analysts have not yet caught on to the fact that consumer spending and bank lending attitudes have changed for good.
- Analysts in general have a vested interest in getting the public to buy stocks, annuities, etc. because that is how they make money.
….read and view more charts at Charts Show Analysts Historically Overestimate Corporate Earnings by 100%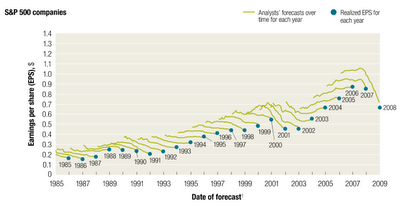
Geordie Mark: Glowing Reviews for Uranium Plays
You don’t hear a lot of talk about uranium these days. It’s just not as sexy as gold or silver. But with a host of reactors slated for construction, the sector is rife with opportunities. Haywood Securities Analyst Geordie Mark visits numerous uranium projects each year, researching plays at all levels. In this exclusive interview with The Energy Report, Geordie tells us why he’s given “sector outperform” ratings to no less than 11 companies. It could be the most comprehensive global roundup of uranium plays anywhere.
The Energy Report: The spot price for uranium was $40.75 a pound on June 21, when the long-term price for uranium was $58—a spread of $17.25, or 42%. What’s poised to support a 42% price increase?
Geordie Mark: The spot price actually moved up to $41.75 that night, the first move to the upside in quite a number of months. It’s a positive response to demand coming onstream. The long-term contract market is very different from the spot market; and, historically, it’s significantly bigger in terms of the volumes that are traded. We’re seeing the spot price moving to meet those contract prices going forward. We also think there’s a backdrop of significant demand increase due to a delay in the development-stage projects resulting from financial crisis issues and general market conditions.
TER: How far out do you see the spot price and the futures price meeting?
GM: We’re looking at a marriage maybe even by the end of 2011, with a spot price of $65 and a long-term move out to $70. We certainly expect to narrow the current gap by that point.
TER: And you said part of that is due to the number of projects coming onstream?
GM: That’s right. A few development-stage companies will go into production but, certainly compared to 2007, there have been delays due to equity raising. The number of new projects going forward has been stymied when those projects needed significant capex for development.
TER: At the same time we have a number of new reactors being built.
GM: That’s true. Over the last two years, we’ve seen some significant growth in the number of reactors going into construction. I think something like a 58% increase in the number of reactors are on the planning board; that’s a very good size in terms of a steady increase in future demand.
TER: Given the number of reactors being built or scheduled, why haven’t uranium stocks performed better of late?
GM: There’s a relationship between share prices and general market conditions. Over the last two years, both spot and long-term prices have come off somewhat in response to global financial conditions. I believe spot has come down from about $59 and long-term prices from $80. Company valuations are quite closely linked to commodity prices, so you’re basically seeing the relationship to a softening in the commodity price over that two-year period.
TER: So with demand slated to rise significantly, we should see a corresponding rise in share prices of uranium miners and explorers?
GM: That’s our target forecast for our covered companies and where we see the commodity price going in response to increasing demand. I think the interesting thing is that increasing demand not only corresponds to the number of new reactors coming onstream but also policies echoing out of Europe regarding extending the life of existing reactor fleets. You’re seeing a number of different avenues in which nearer-term demand could increase, which only adds to the longer-term demand of new reactors. There are incremental policy changes toward nuclear power, too, certainly across Europe and coming across through North America. Obviously it’s happening in Asia, with China and South Korea furnishing fairly large reactor-unit increases for their countries.
TER: Some of the most promising uranium projects are in Australia. Although the country is considering a new tax on miners, the Mineral Resources Rent Tax (MRRT), a recent change in leadership in the governing party could be a favorable development. Could you update us on the political climate in Australia as it pertains to the uranium players there?
GM: Well, Australia is interesting. It has the world’s largest accumulated known uranium resources and the largest uranium deposit—Olympic Dam. At the moment, Australia’s federal government allows uranium mining, and other regulations basically filter down state by state. Western Australia is now open to uranium mining. South Australia has an active uranium mining history, as does the Northern Territory. The more recent super-tax proposal, which the Labour Party put forward, created an uncertainty in terms of the value of both current and future mining projects. Julia Gillard, the new Prime Minister, has made motions toward the industry in terms of coming forward and talking about possible modifications to the mining taxation rules. For the time being, it’s hard telling how ultimately this will break down.
TER: Your research talks about some sector outperformers among the conventional explorers. You’ve mentioned Energy Fuels Inc. (TSX:EFR), Mega Uranium Ltd. (TSX:MGA) and Strateco Resources Inc. (TSX.V:RSC). Please update us on those companies.
GM: They provide investors with exposure to uranium in different jurisdictions. For example, Mega has the Lake Maitland project in Western Australia, which is opening up for uranium mining and where a significant proportion of Mega’s assets are located. The company has good partners in a Japanese consortium, which owns about 35% of the asset at Lake Maitland. Mega provides people with exposure to a near-term uranium producer that has a significant support base in terms of these partners. I think that’s one of the more favorable new projects in Australia. We anticipate production maybe in 2013. It would be a lower-cost producer, probably in the high $20s in terms of USD per pound of production.
TER: How much would Mega produce annually at Lake Maitland?
GM: We’re looking at about 1.65 million pounds; it’s small-scale production. It’s basically a thin layer at surface that doesn’t require conventional mining. It’s unconsolidated mud effectively, so 1.65 million pounds a year for the life of the project.
TER: Does Mega have any other projects in Australia?
GM: Lake Maitland is their primary project. Their second main asset in Australia is Ben Lomond, up in far northern Queensland, just outside the city of Townsville. It’s a modest-grade deposit; it’s got potential. They’ve got a bunch of other exploration plays around the world, particularly in Canada.
TER: What’s your target price on Mega?
GM: $0.80.
TER: Before we go further, could you give us an overview of cash costs—low, medium and high—in terms of uranium production?
GM: Sure. Certainly low cash costs now would be below around $25 a pound. Medium would be upper $20s and $30s. High costs are $40s and above.
TER: Okay. What can you tell us about Strateco?
GM: Matoush is a very nice deposit in Québec; very handsome grades, close to 0.6% U3O8. It has a resource of about 20 million pounds of uranium U3O8—small, but higher grade. Our interpretation is that Matoush is the most advanced project for a development-stage company in Canada. Strateco has a big program going at the moment —another 60,000 meters of drilling this year to look for extensions of mineralization, and another 60,000 meters planned for 2011. The orebody is still open. Guy Hébert, the president and CEO, is also working out permitting. We’re looking at permits for the project to start underground development for bulk sampling.
TER: How long would it take for them to get the assay results from that bulk sample?
GM: We’re looking at a couple of years, probably 2012. They have to develop the underground workings first. The main thing in the interim is the underground development itself, and also the exploration drilling they’re doing. It takes time. That’s why we think Strateco is ahead of its peers in terms of submitting proposals to the Canadian Nuclear Safety Commission (CNSC) for licensing and permitting approval. Canada is highly regulated, which is a good thing. It’s mandated, and these things take time.
TER: Alright, what about the others?
GM: Energy Fuels, that’s a uranium-, vanadium-oriented company in Utah and western Colorado. We like them because of the duality of the commodities. In addition to uranium, they have the vanadium, which is an integral component in steel manufacturing. That gives them a bit of a boost. Energy Fuels would be a moderate to higher-cost producer and shares many similarities with Denison Mines Corp. (TSX:DML; NYSE.A:DNN) and its mining and processing operations in the United States.
TER: What are some of their assets?
GM: They have the Piñon Ridge Mill project, permits for which are under review. That process should be complete by early next year. They have a couple of mines that are fully permitted and will be underground mining on the Colorado Plateau. Energy Fuels has the potential to go into production at their Whirlwind Mine, but they don’t have a mill there yet.
TER: A recent edition of Haywood Securities’ Uranium Weekly gives sector outperform ratings to Paladin Energy Ltd. (ASX:PDN; TSX:PDN) and Denison. What upsides do you see there?
GM: I favor Paladin simply because they have two conventional open-pit mines in Africa where they’re ramping up production. There’s one in Namibia, which is the world’s fourth largest uranium-producing country. The new mine that they commissioned last year in Malawi is Kayelekera. Paladin’s a conventional player with production costs of around $30 a pound; it’s a Tier-2 producer at the moment and is looking to expand from there. The company also has development plans in Australia and elsewhere in Africa. They’ve done quite well—they’ve proven themselves to be the new player in terms of conventional mining and milling in the uranium sector.
TER: Are they approaching Cameco Corp. (NYSE:CCJ; TSX:CCO) status?
GM: No, not yet. Cameco is fairly substantial, quite diverse; but Paladin is a Tier 2. There are not many Tier 2 producers out there; they include Uranium One Inc. (TSX:UUU), Paladin and Denison in that fold.
TER: Tell us about Denison.
GM: Denison is basically a North American uranium producer and also produces vanadium from its Utah operations. It’s a higher-cost producer, and certainly the leveraged play in the space. Denison has basically reconstituted itself over the last year and a half in terms of raising equity to minimize long-term debt. They’ve also brought in KEPCO as a partner—Korea Electric Power Company (NYSE:KEP). Basically, Denison is slowly ramping up its production in the U.S. They’ve cut down a few of the higher-cost producing mines to be more prudent in their mining and producing operations. For example, they have a partnership with AREVA (PAR:CEI) at the McClean Lake facility in Canada, which is probably going on care and maintenance in July.
TER: Why is that?
GM: AREVA operates that, so it’s largely their decision. . .probably looking toward future prices to see when it comes back onstream. Denison also produces vanadium, and they have a very exciting discovery in the Athabasca Basin—the Phoenix Zone in the Wheeler River joint venture. Phoenix has had some outstanding drill results over the last year. They’re aiming to get a resource estimate out on that by the end of 2010. Quite an exceptional discovery, I think.
TER: In that same issue of Uranium Weekly, you talk about some in-situ miners. Among your sector outperformers are Uranium Energy Corp. (NYSE.A:UEC), Ur-Energy (NYSE:URG; TSX:URE) and Uranerz Energy Corporation (TSX:URZ; NYSE.A:URZ). Tell us about those.
GM: Uranium Energy, Ur-Energy and Uranerz are all in the U.S., all looking at in-situ uranium recovery—so no physical mining, all sandstone-hosted. We see near-term production out of all three of the companies. That’s this year for Uranium Energy, probably next year for Ur-Energy and late 2011, early 2012 for Uranerz.
TER: This year for Uranium Energy?
GM: Yes. We’re looking at Uranium Energy entering production in October from their Hobson plant and mining from their well fields at Palangana—both in Texas; so, with this timeline, it will effectively be the world’s next uranium producing company. It’s quite an exciting development for the space and the company. They have another project, Goliad, which could potentially add to their production and should get its final permitting by the end of this year. We like Uranium Energy’s lower-cost production base. They’re not large but their cash costs are probably around $22, so quite good there. Production scale potentially 1M–2M pounds annually.
TER: Has the share price moved in anticipation of production?
GM: No, not as yet.
TER: Given that its pending production profile hasn’t been taken into account, might it be a good buying opportunity?
GM: We certainly like them. Our target there is $3.90. They’re trading at around $2.40, so we think that offers a good opportunity. They have a number of catalysts going forward and a big exploration plan around their existing resources. They will update their resource estimate in September; production in October. We’re looking at getting a second well field project ‘Goliad’ permitted by the end of the year. A third project called, Seager-Salvo, could have an initial resource estimate by year-end, as well.
TER: What about Ur-Energy?
GM: Ur-Energy and Uranerz are good peer companies. They’re both in Wyoming, and both submitted applications to go into mining around the end of 2007, beginning of 2008. We’re looking at production next year for Ur-Energy and early 2012 for Uranerz. Let’s go through Ur-Energy. They’ve got a very good cash position and have the Lost Creek and Lost Soldier deposits. They’ve been operating from Lost Creek first—they’re looking at development there. We’re looking at the Nuclear Regulatory Commission (NRC) ultimately providing final permits and licenses to go into production in the second half of this year. It’s the same for Uranerz. We’re looking at probably starting to build at the end of this year, beginning of next year. Lower-cost producer, small scale.
TER: Let’s go back to what’s happening in Africa. Haywood’s research would seem to agree that Africa has a number of promising uranium explorers and developers. Could you talk about some of the juniors Haywood thinks are poised for significant share appreciation?
GM: Africa is blossoming as a region for uranium discovery. Mantra Resources Ltd. (TSX:MRL; ASX:MRU) and Extract Resources Ltd. (TSX:EXT; ASX:EXT) have made some genuine new discoveries there over the last year or two. I think the best thing about Africa is the probability of making discoveries that are more easily exploitable in terms of being at or near surface, so they’re amenable to open-pit mining. Mantra has an exceptional deposit, the Mkuju River Project in Tanzania. I think the company published its first resource estimate at the beginning of last year. . .more than doubled it within a year and still has the potential to increase that resource. They’re looking at production in the second half of 2012. That’s a very quick timeline to production. They’re still looking at increasing the capacity from their plant and milling operation. We’re looking at a modest cash cost of about $25 a pound. Mantra has a lot of positives going forward.
Extract made an outstanding discovery at Rossing South in Namibia. This is 6 km. south of the existing Rossing Mine that Rio Tinto Ltd. (LSE:RIO; NYSE:TP; ASX:RIO) operates. They have close to 300 million pounds of defined resources, which they identified in rapid time. Their resources are significantly higher grade than the existing Rossing operation and they’re looking at expanding on that. It’s a world-class discovery, a fact that their share price has reflected over the last 18 months.
TER: That’s great. Any others?
GM: Bannerman Resources Ltd. (TSX:BAN; ASX:BMN) has done a lot of work in terms of defining the Etango deposit, which has about 160+ million pounds of uranium. It’s tens of kilometers away from Extract’s Rossing South. They’re all very close together, and all alaskite-hosted. That means the mining and processing techniques are well known and understood given the long history of mining at the Rossing Mine.
The Etango deposit is defined over 6 km. of strike length. It crops out—it’s at surface and shallow. Bannerman doesn’t have the grade that Extract has, so they’re a more leveraged play in the space; but we still like Bannerman in terms of a large strategic resource. We’re looking at cost of production in the high $30s or maybe $40 a pound.
The big thing there is that they should get their ultimate mining license over the next few months, so they’ll be one of only three operations to have licenses to go into production. The big players are looking for resources with potential for large-scale production in areas that allow uranium mining. And that’s where Bannerman, Extract and Mantra all come out quite well.
TER: Thank you, Geordie, for updating us on all of these exciting developments.
Dr. Geordie Mark, a research analyst with Haywood Securities, focuses principally on uranium companies involved in exploration, development and production. He joined Haywood Securities from the junior exploration sector, where he was vice president of exploration for Cash Minerals, which concentrated on uranium and iron oxide-copper-gold targets across Canada. Immediately prior to joining the exploration industry full-time, Dr. Mark lectured in economic geology at Monash University, Australia and served as an industry consultant. He completed his Ph.D. in geology in 1998 at James Cook University’s Economic Geology Research Unit in Australia, specializing in aqueous geochemistry and igneous petrology applied to ore-forming systems.
Want to read more exclusive Energy Report interviews like this? Sign up for our free e-newsletter, and you’ll learn when new articles have been published. To see a list of recent interviews with industry analysts and commentators, visit our Expert Insights page.
In Search of a Good Basin
By Dave Forest – Pierce Points July 20, 2010
Yesterday, we went through the basics of unconformity-hosted uranium deposits. And why these are the big prize for the uranium industry.
And yet, despite decades of study, we’ve still only found unconformity-type mineralization in a handful of basins worldwide. Athabasca, Thelon, Kombolgie, Kintyre, Hornby Bay, Otish, Karku.
This is largely a function of exploration. There is no shortage of potential targets. Uranium gurus Kurt Kyser and Michel Cuney note in a recent paper there are over 200 sedimentary basins globally that fit the general bill for unconformity mineralization. That being (as we discussed yesterday), the presence of old Archean rocks overlain by younger Proterozoic rocks.
Something happened around the Archean/Proterozoic transition. Almost certainly related to the first appearance of large amounts of oxygen in Earth’s atmosphere.
The formation of uranium deposits is controlled by “oxidation state” (generally, the presence or absence of oxygen) to a much greater degree than other metals. And Archean/Proterozoic basins appear to have been the setting where oxidation conditions were optimal for the formation of large, high-grade uranium deposits.
But it’s highly unlikely that all 200 of the world’s Proterozoic basins will be significantly mineralized. We know that a number of special geological and geochemical conditions blessed places like Athabasca. Playing a critical role in uranium ore formation.
The trick to finding the next major uranium discovery is to survey the world’s basins. And figure out which ones might also have these special ore-enhancing features.
Here’s a checklist of things to look for in a good basin.
1) Uranium source. As we discussed yesterday, unconformity deposits form when older uranium is dissolved in oxygen-rich waters, concentrated, and then re-deposited. This means a basin must have an identifiable source of old uranium.
There’s debate in uranium circles about sources for unconformity mineralization. Some workers believe U is sourced from granites in the Archean rocks that underlie Proterozoic basins. Some believe the overlying sediments are the source, with uranium coming from minerals like zircon and monazite. It’s also possible both these sources come into play.
…..read pages 2-3 of The Scoop…. on the Next Big Uranium Discovery
Where to Find Recession-Proof Stocks
Isn’t it amazing how quickly the mainstream media talk has turned from green shoots and recoveries to double-dip recessions and a whole laundry list of new economic worries?
The whimsical nature of the news aside, there certainly are plenty of reasons for concern as some of my colleagues have been pointing out in their recent Money and Markets columns:
Global shipping is grinding to a halt … consumers are hunkering down again … manufacturing measures are indicating a new slump in activity … and even China’s red-hot economy is now a bit less robust according to Beijing!
In short, now is the perfect time to revisit the areas of the stock market that traditionally hold up best when recessions strike. These are the very same areas that I’ve been emphasizing all along, even during the manic rally, and the very same groups of stocks that you should look at right now as storm clouds roll back over the economic landscape.
Before I get to the specific sectors and industries, however, I first want to note that I suggest sticking only to stocks that pay dividends at this point.
Reason: By their nature, income-producing stocks are a reliable way to weather all types of market hurdles and get non-refundable returns along the way.
Better yet, they tend to hold up much better than non-dividend-paying stocks … no matter what sector or industry you look at.
In 2002, for example, non-dividend stocks in the S&P 500 lost 30 percent while dividend-payers lost only 11 percent … and even during the height of the financial crisis in 2008, dividend payers outperformed by a full six percentage points.
Things Get Even Better When You Focus on The
Right Dividend Stocks in Certain Parts of the Market
Many of the very same companies that pay the biggest dividends also provide products that people buy even when times are tough. Examples? Pharmaceuticals, electricity, and food.
And according to data from Standard & Poor’s, these are precisely the groups that have outperformed in past recessions.
Overall, the S&P 500 has lost an average of 21 percent during past recessions (excluding the latest one).
Meanwhile:
- The average utility stock lost 15 percent and beat the market in 9 out of ten past recessions …
- The average health care stock posted a 7.3 percent decline and outperformed the market in 80 percent of the recessions, and …
- The average consumer staples stock lost just 2.4 percent, beating the market 90 percent of the time.
Yes, even the best-performing sector posted a loss … but if we get even more specific we can find pockets of companies that tend to gain ground even during economic slumps.
For example …
Alcoholic beverage makers not only beat the market in 80 percent of recessions prior to this one, they actually rose an average of 6 percent …
Household products manufacturers posted a gain of 1.8 percent and outperformed in every single instance, and …
And tobacco companies rose 9.6 percent and beat the market every time.
I can tell you from real-world experience that these trends have held through “The Great Recession,” too!
For example, tobacco company Altria produced a total return of 15 percent from my first recommendation on July 2, 2007 through May 28, 2010.
Now, are these hard-and-fast rules? Of course not. Just because a company operates in one of these traditionally recession-resistant industries doesn’t guarantee that its stock will go up (or even hold its ground).
In addition, there are some companies I consider great recession plays that operate outside these traditional safe havens — even in technology and retail!
But my point today is simple: Even if the economy continues to weaken from here, you do not have to completely abandon the entire market, especially if you’re looking for steady income.
Best wishes,
Nilus
P.S. I will be issuing the first recommendations for my brand-new Dad’s Income Portfolio service this Friday! So if you want to get on board before those income-boosting, recession-fighting plays go out … and get an entire year of additional recommendations for the special Charter Rate of $69 … I must hear from you by Midnight Eastern Time this Thursday. Click here now for all the details.
Quote of the Month:
“The U.S. turned 234 years old…, and yet over half of the nation’s money supply was created since Helicopter Ben took over the flight controls four years ago. No wonder gold is in a full fledged bull market. The annual output of gold has declined 12% in the past decade while the marginal cost has more than doubled, to $500, according to David Hale. Moreover, David points out in his recent report that since 1900, more than 80% of the world’s proven reserves have ready been mined. The marginal cost of pressing on Dr. Bernanke’s printing machine is basically zero, and, the prospects of a re-expansion of QE by the Fed as double-dip risks rise with each and every passing data-point are rather high. Gold has corrected to the 50-day moving average in recent weeks, which in the past has been a terrific entry point — for the past six months, each low has been higher and each high has been higher too. Nice upward channel that is to be respected and to be bought.” – David Rosenberg – First paragraph July 5, 2010 ‘Breakfast with Dave’ letter.
Now that the first half of 2010 is over, we thought a macro market view was in order. Dave Rosenberg provided the best overview we’ve seen recently making a strong case for gold in the opening paragraph of Breakfast with Dave the day following July 4 celebrations. Yes, it will encounter corrections but it is difficult to imagine, given the current fiscal challenges together with the tools available to bureaucrats like Ben Bernanke to pump out fiat paper money (and credit) at next to zero cost, that any drop in the price of the yellow metal will be anything other than fleeting.
So how are gold and other important commodities performing relative to stock markets around the world? What factors are driving markets and of greater interest to traders and active investors, what trends can we expect from here?
Enter 800-Pound Market Gorilla Number 1
In the next two charts, chart 1 showing international stock indexes and chart 2 showing some key commodity prices, we compare performances since April 2008. The CRB Index, which measures the composite price of a basket of 17 commodities (lime green), has been added to both charts.
The three vertical lines from left to right show 1) the bottom of the Chinese Shanghai Shenzen Composite Index (SSE) October 31, 2008 (left red-dashed line), 2) the bottom of the S&P500 Index March 6, 2009 (blue-dashed line) and 3) the most recent top of the Shanghai Composite July 31, 2009 (right red-dashed line). Note from chart 2 that the industrial commodities like silver, copper and crude oil bottomed around or just after the SSE. So did gold.
What stands out is that after the peak in the Shanghai Composite, commodities continued to rally until the peak in copper in the second week in April 2010. Oil peaked two weeks later. However, both silver and gold continued to move higher.
….read more (start at the first charts) of Enter the 800-Pound Market Gorilla
-
I know Mike is a very solid investor and respect his opinions very much. So if he says pay attention to this or that - I will.
~ Dale G.
-
I've started managing my own investments so view Michael's site as a one-stop shop from which to get information and perspectives.
~ Dave E.
-
Michael offers easy reading, honest, common sense information that anyone can use in a practical manner.
~ der_al.
-
A sane voice in a scrambled investment world.
~ Ed R.
Inside Edge Pro Contributors

Greg Weldon

Josef Schachter

Tyler Bollhorn

Ryan Irvine

Paul Beattie

Martin Straith

Patrick Ceresna

Mark Leibovit

James Thorne

Victor Adair