
Daily Updates
What has caught our eye here in the US market is the fact that so many indices have topped out after the massive rally of last week right under their respective 200 day moving averages. – Dennis Gartman July 20th
For a Trial Subscription go to The Gartman Letter)
Warren Buffet: US Economy only Halfway Back
President Barack Obama heard a sobering message from Warren Buffett when he asked for the investment guru’s views about the economic recovery, according to an interview Obama gave NBC News on Thursday.
“I’ll tell you exactly what Warren Buffett said. He said, ‘We went through a wrenching recession. And so we have not fully recovered. We’re about 40, 50 percent back. But we’ve still got a long way to go’,” Obama told NBC during a visit to Holland, Michigan, to promote his job creation policies.
Obama chatted with Buffett in the Oval office on Wednesday as he sought ideas on how to translate higher U.S. growth into stronger hiring. This would help him deliver on an election year promise to tackle unemployment currently at 9.5 percent.
Buffett, who built an estimated $47 billion fortune running his insurance and investment company Berkshire Hathaway Inc, warned Obama the recession created a huge overhang of excess capacity in the economy that would simply take time to mop up.
Obama said Buffett specifically used the example of the U.S. housing market, noting 1.2 million new homes were built on average per year in the United States, according to historic trends. That number soared above 2 million during the property bubble, but construction activity has since collapsed.
“What Warren pointed out was, look, we’re gonna get back to 1.2 (million). But right now we’re soaking up a whole bunch of inventory. So a lot of — the challenge is to work our way through this recession,” Obama said.
High unemployment is another type of excess economic capacity. Obama’s Democrats risk severe punishment by voters in midterm congressional elections on November 2 if he fails to convince them stronger U.S. growth means better times ahead.
In this issue of Breakfast with Dave
– An interview with the Bear: Gregory Zuckerman at the Wall Street Journal just published a Q&A on the market and the macro outlook, featuring me alongside James Paulsen, at Wells Capital Management, whom I like a lot, but basically disagree with 99% of his views
– How will the U.S. mid-term election affect stocks, if at all? Tax rates on income and capital are going up next year, and gridlock will not give us strong leadership — hardly positives for the economic or market outlook
– What could happen that would turn you into a bear/bull?
– The U.S. equity market is still overvalued, according to the latest Shiller P/E ratio reading
– The roof collapses on U.S. housing: the NAHB housing market index caved in again in July
– A meat-grinder market: typically, what happens after a once-in-a-generation-type decline are powerful rebounds, but it never moves in a straight line
– Tough slog for employment: a survey by Accenture showed that businesses in the U.S. do not plan to restore their workforce to pre-recession levels anytime soon
Read the Summary HERE
Holy Grail-ism
Just arrived back home in Vancouver.
Sixteen hours on airplanes yesterday gave me the chance to finish reviewing a lot of uranium material. (For those of you finding the uranium theme long-in-the-tooth, we will get back to regularly scheduled programming this week, I promise.)
Most of my latest research focused on uranium’s big prize. Unconformity-style (sometimes half-truthfully called basin-style) deposits.
The mining business often falls victim to “Holy Grail-ism”. We get fixated on the largest, richest and most valuable deposits. What if we found the next Carlin Trend? Or the next Voisey’s Bay?
But for most metals, the chances of finding another super-giant look-alike are slim. There’s simply too big a bell-curve out in nature to hope you will land on the upper tail. And too many people who’ve been looking for “the mother lode” for a long time.
But in uranium, focusing on the top deposits is more defensible.
….read more Holy Grailism
From my home base in Bangkok, Thailand, I can tell you — in no uncertain terms — that Asia’s economies are as vibrant as ever, if not more so.
Just consider the following list of recent economic stats coming out of Asia, the world’s most populous corner of the globe, home to fully 50% of the world’s population …
- China’s gross domestic product (GDP) expanded 11.1% in the first half of this year.
- China’s June exports soared 43.9% compared to last June, the second biggest jump in six years.
- China’s crude oil imports hit a record 22.27 million metric tonnes in June, to a daily import volume of 5.44 million barrels!
For the first half of this year, China’s crude oil imports soared 30.2% over the comparable six months in 2009.
- China’s industrial profits soared 81.6% through May. The combined sales of 39 industrial sectors soared to RMB 25.4 trillion ($3.7 trillion USD) in the first five months, a 38% increase over the same period last year.
Nonferrous-metal mining profits soared 330%, while the coal mining industry saw profits rise 81%.
- China’s urban fixed asset investment soared 25.5% in the January through June period.
Central government and local government projects climbed 14.1% and 27.0% from a year earlier … industrial investments increased as much as 28.8% year on year and investment in the railway transportation sector rose 20.4%.
- China’s retail sales soared 18.3% in June, and are up 18.2% for the January through June period, year on year.
- Singapore’s economy is roaring even more, expanding at a stunning 19.3% in the second quarter, the biggest rise since records began in 1975. Full year 2010 growth is now expected in the 15% range.
The main growth areas: Manufacturing, up 58.6% year-to-year in May, the fastest growth since records began in 1980. The service sector grew 11.4%. Construction, 13.5%.
- Malaysia: Latest data, first-quarter GDP jumped 10.1%, the highest growth rate recorded since the first quarter of 2000.
- Indonesia: At least 5.7% GDP in the second quarter.
- Taiwan: On track for at least 7.7% growth this year, and probably higher, now that a major trade deal has been struck between Beijing and Taipei.
- Thailand: 6% GDP expected for the full year, despite a nearly two month long mini-Civil War in Bangkok!
- India: Full year growth should come in at 8.5% GDP; India’s Sensex stock market is already at two and a half year highs!
All This Vibrant Growth in Asia
Has Vast Implications AND
Repercussions for Your Portfolio …
1. Asian stock markets, while also a bit more volatile right now, are in strong long-term bull markets. So unlike the U.S., I continue to recommend investors concentrate on Asian stock markets.
2. Most of the natural resource bull markets are also very much intact. I’m talking about oil, gold, base metals, and foods.
Huge demand for natural resources — mostly coming from Asia — virtually guarantees higher prices to come for the world’s most precious resources. No matter what the economies of Europe or the U.S. do.
Indeed, just look at the price of oil, which despite the worse economic disaster in the western world since the Great Depression — continues to trade in the $70 to $80 per barrel range, nearly 500% more than it cost just over ten years ago.
Or consider gold, up more than 400%. Or copper, up more than 500%! The same can be said for virtually every natural resource under the sun.
But natural resources are not my main point today. Asia’s growth isn’t either. My main point today instead, is …
Although the U.S. Stock Market
Has Rallied Back Strongly, Don’t Be Fooled
With rare exceptions, nearly all of my indicators on the U.S. markets are turning south.
Even though U.S. stocks appear strong, bouncing back from their early July lows, I don’t like the downside risk.
At best, I think the Dow can get as high as 11,000, for an additional 700-point gain. On the other hand, I put the downside at 8,700, a whopping 2,700-point fall.
Put another way, the Dow’s downside risk is now almost four times greater than the upside potential. That’s not the kind of market you want to be in!
In my opinion, most U.S. stocks are overvalued right now. They have not yet factored into the equation that Washington is as broke as Greece … Portugal … and Spain.
And, they have not factored in two other HUGE problems …
First, the U.S. dollar’s prospects are horrible. What happened to the big rally in the dollar? Fact is, it’s already peaked, and in just five short weeks, the dollar has now lost 6.4% of its value against the euro.
It’s even lost about 1% of its value against the Thai baht, a country that is still largely under emergency rule from the recent civil war there.
As I’ve forecast all along and have been dead right on, longer-term, other than a temporary bounce here and there, the dollar is toast.
That’s because the U.S. government is completely broke, with massive debts of more than $136 TRILLION!
And that’s just on the Federal level: It doesn’t include the debts and liabilities of the 46 out of 50 states that are now technically bankrupt too!
Plus, our Federal Reserve is caught between a rock and a hard place. They can’t raise rates for fear of causing the U.S. economy to completely collapse. So the dollar will find no support there.
And the Fed can’t push rates down, either. They’re already effectively at zero.
Bottom line: The U.S. dollar is in for a long-term decline that could see its value fall much more against nearly all other currencies. The only questions that remain are how much and how fast?
I can’t answer those two questions. But I can say that the dollar’s poor outlook is one more reason to stay away from most U.S. stocks.
At least in the short-term, until the devaluation of the dollar starts to reflate U.S. equity markets — which it will do — but not for a couple more years.
Meanwhile, I believe you simply MUST opt for investing in gold, foreign markets and natural resources. If you don’t, you’ll in essence be committing financial suicide.
Second, Ben Bernanke is prepared to print trillions more worthless paper dollars. My sources tell me he’s already received approval from other Board members to print as much as another $5 TRILLION in the event the economy turns back down, which it is already doing.
But if he needs more than that, rest assured, he’ll print $10 trillion if that’s what he thinks it will take to turn things around.
The problem is that any and all money printing by the Fed will do nothing more than send the value and purchasing power of the U.S. dollar even lower.
It also virtually guarantees that eventually, inflation in the U.S. will rear its ugly head, in a surprising leap that will catch almost everyone off guard.
Bottom line: I actually have quite a few. Chief among them …
A. Stay OUT of the U.S. broad stock markets. With the exception of gold mining shares and funds, and the natural resource picks in my Real Wealth Report.
B. Look East, to Asia, for additional real growth in your portfolio.
C. No matter what, don’t expect the U.S. economy to come roaring back at any time in the next five years.
At best, you will see 1 or 2% nominal growth. I say nominal growth because it won’t be real growth. It will NOT take into account the falling purchasing power of the dollar.
D. Don’t fall for anything the talking heads on major media shows are spewing. All too often, they do not have a clue what the markets are doing, or why.
I guarantee that if you listen to them and act on their recommendations, you stand to lose virtually ALL of your money.
E. Last, but not least, realize this: The big-wigs in Washington are truly Emperors with no clothes.
Listen to anyone in Washington, and it’s akin to managing your wealth and financial security with your pants down: You are sure to get screwed.
Best wishes, as always,
Larry
P.S. With natural resources consolidating for their next big move up … with Asian economies leading the charge higher and where the action is — I can’t think of a better time to become a member of my Real Wealth Report.
If not already a member, join now for just $99 a year. It truly is a bargain that can pay for itself hundreds of times over. Click here to join now.
This investment news is brought to you by Uncommon Wisdom. Uncommon Wisdom is a free daily investment newsletter from Weiss Research analysts offering the latest investing news and financial insights for the stock market, precious metals, natural resources, Asian and South American markets. From time to time, the authors of Uncommon Wisdom also cover other topics they feel can contribute to making you healthy, wealthy and wise. To view archives or subscribe, visit http://www.uncommonwisdomdaily.com.
A 5 chart sampling below and the Bottom Line taken from the comment plus 45 Charts Don Vialoux analyses in this great Monday comment. Read it all HERE
The Bottom Line
Reasons to own equities in the short term are less than compelling. Exceptions exist in selected sectors with favourable seasonality (e.g. gold, health care, agriculture, consumer staples). They can be purchased on weakness. (Charts below)
Protecting your investments during a volatile earnings report season
Second quarter earnings report season is upon us. Significant price fluctuations frequently occur when quarterly results are released. What is expected this quarter?
Greater than average fluctuations are expected this quarter due to the simultaneous release of good and bad news. On the positive side, consensus estimates are anticipating strong earning gains by major companies listed on U.S. and Canadian exchanges. Earnings by S&P 500 companies are expected to increase by 27 percent on a year-over-year basis. Earnings by TSX 60 companies are expected to record an average (median) gain of 13 percent. On the negative side, economic activity in the second quarter on both sides of the border slowed significantly from robust levels recorded in the first quarter. Many second quarter reports are expected to include negative guidance relative to optimistic projections offered in first quarter reports.
What is an investor to do to protect against significant changes in market value during the current earnings report season? The answer rests in listed options. Conservative listed option strategies offer opportunities to define risk parameters and to continue to participate in the underlying trend of a favoured investment. Let’s look at a couple of examples.
Apple (AAPL $250) is a name that is well known for its equity market leadership. The company releases its second quarter report this Tuesday. During the past five years, the stock has deviated up or down by an average of 5.85 percent on the day following release of results and by as much as 25 percent in the following quarter. Positive results were recorded in 14 of the past 22 periods.
An almost costless approach to participate in the upside potential of the stock is to own a Bull Call Spread offset by a longer-term put. An investor buys October 260 calls for around $17 and sells October 290 calls for around $7. Net cost is $10. A further offset is realized by selling January 200 puts for $10. Net cost is close to $0.
Why sell the January 200 Put? January customarily is the time that Apple reaches a seasonal peak. Chances are good that the put option requiring purchase of the stock at $200 will expire out-of-the-money and valueless. The strategy offers protection against downside risk to $200 and offers profit potential if the stock advances to the $260 and $290 range.
Gold has been in the news lately due to its “flight to safety” properties, resulting in all-time highs in the value of the commodity. With Barrick Gold (ABX $43) set to report at the end of this month, the company is expected to benefit. During the past five years, fluctuation of its stock price has averaged 3.20% on the day of release and by as much as 14 percent in the following quarter. The same strategy can be employed by using October 44/48 Bull Call spreads and January 35 puts. Seasonal tendencies in the last half of the year are positive for the stock as a result of greater demand for the commodity over this period.
These strategies are for sophisticated investors with a bullish intermediate outlook, who also want to protect against an unexpected downside event. It should be noted that equity purchases are required if their prices decline by more than 20% by expiration of the Put leg in January. However, analysts are targeting gains of at least 20% for both stocks. Upside potential exceeds downside risk during a period when both stocks are notorious for their wild price swings.
Jon and Don Vialoux are authors of free daily reports on equity markets, sectors commodities and Exchange Traded Funds. Reports are available at www.timingthemarket.ca and www.equityclock.com
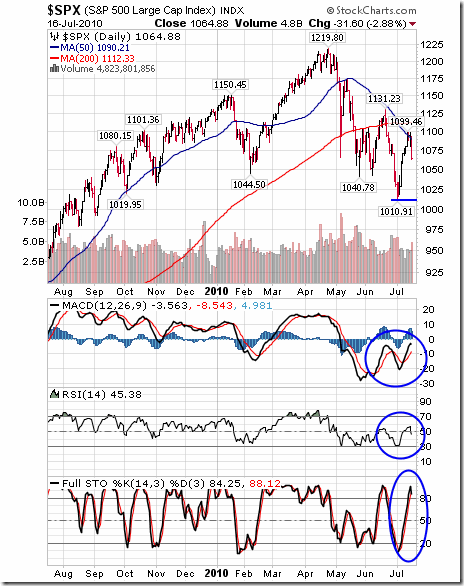
The S&P 500 Index fell 13.08 points (1.21%) last week. All of the drop occurred on Friday. Intermediate trend remains down. Support is forming at 1,010.91. Its 50 day moving average currently at 1,090.21 proved to be a reliable resistance level for the third time in three months. MACD and RSI currently are neutral. Stochastics are short term overbought and showing early signs of rolling over.
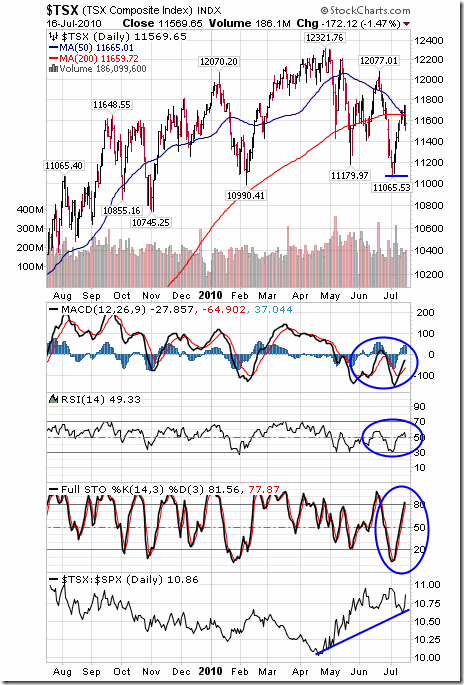
The TSX Composite Index slipped 0.90 points (0.01%) last week. Intermediate trend remains down. Support may be forming at 11,065.53. The Index found resistance near its 50 day moving average once again. A Death Cross likely will be recorded as early as today. MACD and RSI are neutral. Stochastics are overbought and showing early signs of peaking. Strength relative to the S&P 500 Index remains positive.
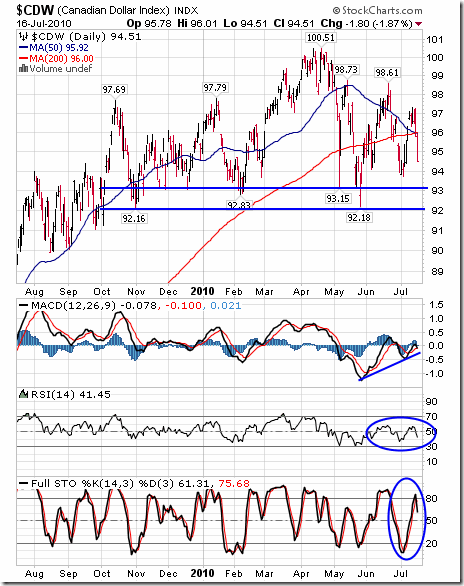
The Canadian Dollar lost 2.22 cents U.S. (2.30%) last week. Most of the decline happened on Friday. MACD and RSI are neutral. Stochastics are short term overbought and showing early signs of rolling over.
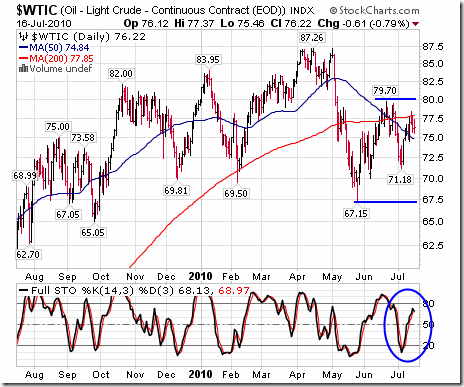
Crude oil also was virtually unchanged last week. Resistance was found at it 200 day moving average. Short term momentum indicators are neutral to over bought.
Gold fell $18 last week. Most of the decline occurred on Friday. Short term momentum indicators are trending lower with Stochastics trying to recover from oversold levels. Trading range during the past three months is $1,166.50 and $1,265.00 U.S. per ounce. Gold continues to outperform the S&P 500 Index.
Technical Analysis and comment by the highly respected Don Vialoux of Timing the Market CLICK HERE for the Full Monday Report including 43 Charts.
Don Vialoux has 37 years of experience in the Investment Industry. He is a past president of the Canadian Society of Technical Analysts (www.csta.org) and a former technical analyst at RBC Investments. Don earned his Chartered Market Technician (CMT) designation from the Market Technician Association in 1995. His CMT paper entitled “Seasonality in Canadian Equity Markets” was published in the Spring-Summer 1996 edition of the MTA Journal. Don also has extensive experience with Exchange Traded Funds (also know as Index Participation Units) as well as conservative option strategies. In 1990 he wrote a report that was released in the International Federation of Technical Analyst Journal entitled “Profiting from a Combination of Technical and Fundamental Analysis”. The report introduced ” The Eight Phases of the Stock Market Cycle”, an investment concept that continues to identify profitable entry and exit points for North American equity markets. He is currently a member of the Toronto Society of Fundamental Analyst’s Derivatives Committee. Now he is the author of a daily letter on equity markets available free on the internet. The reports can be accessed daily right here at www.dvtechtalk.com.
-
I know Mike is a very solid investor and respect his opinions very much. So if he says pay attention to this or that - I will.
~ Dale G.
-
I've started managing my own investments so view Michael's site as a one-stop shop from which to get information and perspectives.
~ Dave E.
-
Michael offers easy reading, honest, common sense information that anyone can use in a practical manner.
~ der_al.
-
A sane voice in a scrambled investment world.
~ Ed R.
Inside Edge Pro Contributors

Greg Weldon

Josef Schachter

Tyler Bollhorn

Ryan Irvine

Paul Beattie

Martin Straith

Patrick Ceresna

Mark Leibovit

James Thorne

Victor Adair