
Daily Updates
SPY – SP500 Index Trading Fund
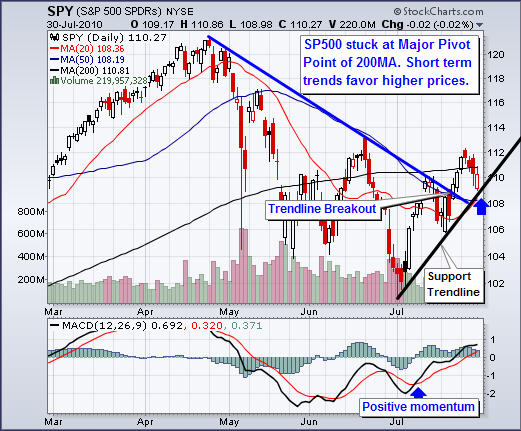
You can clearly see the longer term trend which is down (blue trendine). But from simply drawing a couple trendlines and looking at the MACD (momentum) indicator you can see there is a possible trend reversal taking place. So far the SPY has broken out of its down trendline with a 4 day pop, and it’s now pulled back down to test support. A close below the trend line or the 50MA would be the exit points if the market did start to go south.
The SP500 is still stuck under major resistance, its 200 day moving average. But is trading above key support levels (20MA, 50MA and Trendline). I can feel the tension in the market between traders and we are about to see a big move once a breakout to the upside or down side is established. At this time its best to be in cash or have a small position with a protective stop in place. Once a trend starts there should be some low risk entry points along the way. If we see a strong reversal to the upside On Monday or Tuesday I would expect big buyers would step in to catch this new trend up.
GLD – Gold ETF
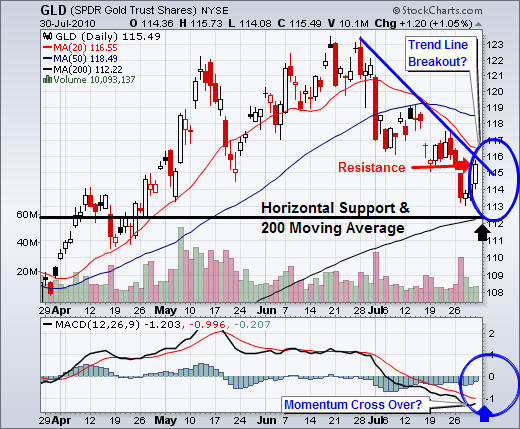
Looking at the price of gold we can see the trend is still down along with the momentum. A breakout would be the first step towards a possible entry point but I prefer to wait for a pullback after the breakout has taken place. Once we get a test of support I look to enter a position once there is a strong reversal candle to the upside. From there I draw a new support trend line from the previous low and connect it to the new pivot low (bottom of reversal candle). That becomes my new protective stop.
Gold still has some work to do before I would even be interested in taking a long position for a swing trade. But on a short term time frame (intraday charts) gold looks to be forming a low risk setup which I hope unfolds for my subscribers this week.
USO – Crude Oil
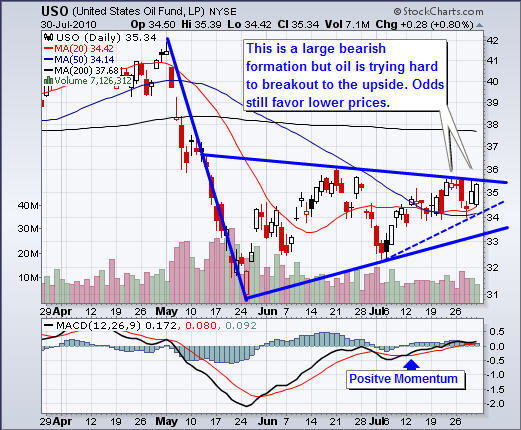
Oil has been trading in a large bearish pennant for the past 2 months and it is nearing the apex of this pattern. The longer term picture of oil is bearish but the most recent dotted trend line and the 20/50MA crossover is signaling some strength. Also the momentum for oil is positive and that helps support the price also. Again if this was to breakout to the upside I would wait for a low volume pullback to test the breakout level, then enter on a reversal back up.
Oil is one of the more challenging commodities to trade because it is affected by the US Dollar, Political Events, and Weather. In short, even if you had the analysis and timing correct there are other factors which move the price of oil on a regular basis that could quickly turn the trade against you. That being said, keep trades small when trading oil.
How to Find Low Risk Trading Setups:
In short, trading can be complex, simple or somewhere in between. You can spend 14 hours or 20 minutes a day analyzing it depending on what investments you trade, whether you’re trading full time or just checking up on longer term investments.
This analysis and basic strategy shown above can be profitable if followed correctly and works for stocks, commodities and indexes. It’s just to show how simple one can swing trade the market using very basic analysis. Personally I use a much more complex strategy incorporating 15+ other data points which allows for precise entry and exit points.
If you would like to Get My Low Risk Trading Signals visit my services at:
www.TheGoldAndOilGuy.com – ETF Trading – Index, Sectors & Commodities
www.FuturesTradingSignals.com – Futures & ETF Trading – Index & Commodities
The stock market is looking good. This week several of the U.S. stock indices hit 2- to 6-month highs, and they’re all back above their key moving averages. This tells us that stocks are going to rise further. Plus, the Dow Theory triggered a new bull market signal on Monday. As Dow Theory expert Richard Russell points out, by simultaneously breaking above their June highs, the Dow Industrials and Dow Transportations are now signaling that the stock market trend is up. And since our own leading indicators have room to rise further, stocks will likely continue to head higher at least in the months ahead. For now, the Dow Industrials will remain very strong above 10400. Most of our recommended stocks are rising and we expect they’ll move much higher, along with the general market. Keep your current positions.
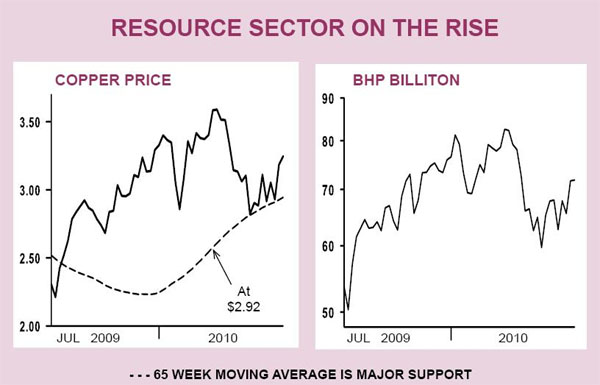
The resource sector is strong. Copper and the other base metals are on the rise, while our resource shares are rebounding nicely, (see chart). Even uranium rose this week, closing at an almost nine month high today. This sector rises when the global economy shows potential and copper is the barometer. Copper closed at a 2 ½ month high today, it’s in a solid uptrend above $2.92 and it’s strong above $3.08. Keep your positions. Crude is following; it’s strong above $76 and it’s in a solid rise above $73.50. Oil above $80 would show great strength.
The Aden Forecast is one of the most influential investment publications in the world today. Its easy to understand format and powerful advice has consistently produced double-digit profits for subscribers in 21 out of the past 25 years…That’s an 83% batting average, one of the best and most consistent long-term track records in the business. Contact The Aden Forecast HERE
Financials, Oil & Gold on the Move
Most traders I have been talking with are feeling the same thing. Something big is brewing for the equities market but most do not want to get heavily involved until there is a clear direction. The broad market has been consolidating for almost 3 months and it’s important to remember that the larger the consolidation the bigger the move.
Also the biggest and best moves come from failed patterns. So is the big head & shoulders pattern on the SP500 which everyone is yelling about (the sky is falling) really going to happen or is this the BIG fake out? Only time will tell, either way no matter which way it goes I will be sure to catch some of it.
Below area few charts pointing out patterns and trends which could provide some opportunity in the coming days or weeks.
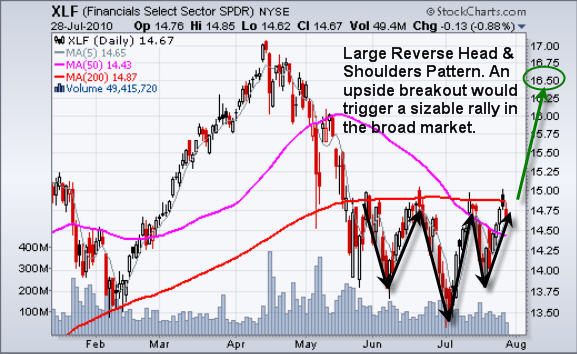
XLF – Financial Sector ETF
Financials play a large roll in moving the major indexes so if this reverse head and shoulders patter breaks out to the upside then the indexes should rally and XLF etf could reach its measured move of $16.50.
USO – Crude Oil Fund
Crude oil almost looked like it was going to breakout and mover higher this week but sellers jumped in sending it lower once again. The daily chart shows a large bearish pennant which is known as a continuation pattern. So it looks as though we should see lower pric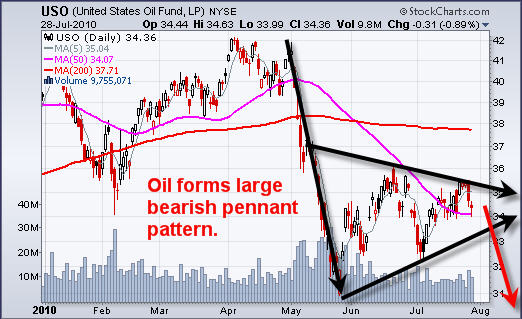 es for oil.
GLD – Gold Bullion ETF
Gold has been sliding lower for several weeks now and it looks to be showing selling exhaustion. The 5th wave down with the volume spike indicates panic selling as investors cannot hold onto those positions any longer and exit. This is a bullish sign for gold. Also we are seeing gold fall deep into a support level along with the 200 day moving average.

Mid-Week Financial, Oil and Gold Trading Conclusion:
In short, the equities market is in limbo until a clear trend is established. If the financial sector breaks out to the upside then we should see a sizable rally. As for oil it looks to be trading in near the middle of its range but is still in a down trend overall. Gold is almost looking ready for a bounce but I am waiting for more confirmation before jumping on the wagon.
Receive my Trading Analysis and ETF Alerts try my subscription service which has a 30 day money back guarantee: http://www.thegoldandoilguy.com/specialoffer/signup.html
Rick’s Picks frequently runs guest commentaries expressing opinions that differ markedly from our own. Below, Mario Cavolo, an expatriate who lives in China, argues that there is no global, deflationary depression bearing down on us, but rather a muddle-along economy with strong spots as well as weak ones. We disagree and see a period of economic darkness more severe and widespread than any in history. Our bottom line, very simply, is that the world is unwinding a financial asset bubble with a notional value of nearly a quintillion (i.e., $1,000,000,000,000,000) dollars. Considering the sum involved, there can be no easy return to economic health. More logical is that a totally corrupt global financial system will have to be destroyed before we can rebuild the economy on honest trade. As things stand, the world’s financial-products-and-services balance sheet is at least ten times as large as the ledger for trade in real goods and services.
Mario notes optimistically that Japan has muddled through its decades-long deflationary recession without experiencing social disintegration. Although this is true, we would argue that it is so only because Japan had the rest of the world – including an insatiable U.S. consumer – to keep its powerful export machinery humming. But who will bail out the U.S. and Europe as we continue to sink together? We could take on Mario’s arguments point by point here, but we’lll let that happen in the Rick’s Picks forum, which has attracted a very intelligent and articulate following. RA
Mario Cavolo: It is easy to continue feeling humbled and confused by the sentimental and fundamental dance of the world’s asset classes and regions, be they equities, currencies, commodities, or that shiny stuff; feel free to pick your basket of market sectors to analyze and track. DaBoyz is a moniker here at Rick’s advisory website, typically referring to the big time market players, institutional investors, bank/investment house trading desks and other various neo-elitists who have literally taken over the world’s free markets. Planet Hollywood was a great brand name idea. Today, so is Planet Las Vegas or Planet Macau.

The singular “George Soros who made billions shorting the British pound” example has become a cancerous plurality on the daily tape in a high stakes global trading playground. It is indeed real, a separate “sector” of reality, while the rest of reality — the real reality of the real world — goes on day by day, dealing with the damage trickling down. As might be suspected as the new
….read the rest of the article: _Risk of Depression Low, Says Our Man in China
Uranium soared from $10 a pound in 2000 to a stunning $136 a pound in 2007 – and then the bottom fell out. After three lean years, could another bull market be ahead?
According to the Ux Consulting Company, which tracks the price of uranium, the July 26 weekly spot price for U308 was $46 per pound. That is a 15% spike from the February lows around $40 per pound.
So does uranium at $46 per pound count as cheap, or expensive? That depends on how you look at it…
In the year 2000, uranium was well and truly dirt cheap. Thanks to a seemingly endless supply from decommissioned nuclear stockpiles, no one wanted the stuff… and the price of U308 (a standard mix of uranium oxides) fell to just $10 per pound.
Seven years on, however, uranium was at the pinnacle of a stunning bull run, riding a wave of increased demand for nuclear power plants around the globe. By the year 2007, U308 had hit an incredible $136 per pound – more than a 1,200% price increase from the bear market lows.
But then the bottom fell out for uranium prices – again – as hard assets got abandoned in the great financial meltdown. So now, in the mid-$40s, the uranium spot price is well off its year-2000 lows, but merely a third of bull market highs. Does that make it cheap?
China seems to think so…
….read more beginning with title The Dragon Inhales
-
I know Mike is a very solid investor and respect his opinions very much. So if he says pay attention to this or that - I will.
~ Dale G.
-
I've started managing my own investments so view Michael's site as a one-stop shop from which to get information and perspectives.
~ Dave E.
-
Michael offers easy reading, honest, common sense information that anyone can use in a practical manner.
~ der_al.
-
A sane voice in a scrambled investment world.
~ Ed R.
Inside Edge Pro Contributors

Greg Weldon

Josef Schachter

Tyler Bollhorn

Ryan Irvine

Paul Beattie

Martin Straith

Patrick Ceresna

Mark Leibovit

James Thorne

Victor Adair