
Daily Updates
Gold and Oil Shine Compared to the SP500
Wednesday August 4th
Commodities have been shining recently as the US Dollar loses its luster for investors. Also the weakening dollar has helped boost equities as a lower US dollar helps the large multi national companies. This report is a quick follow up from the Weekend report showing what the odds were favoring which was higher gold, oil and sp500. As of today each investment is unfolding as planned, once candle at a time.
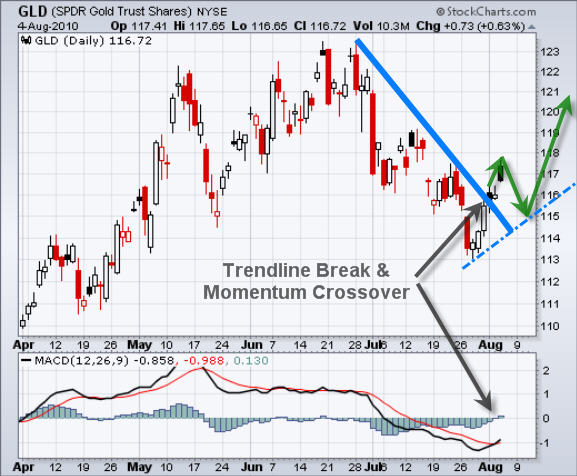
GLD – Gold ETF Trading
In my last report I pointed out how gold needed to break through its down trendline, the MACD had to crossover and then we needed to wait for a pullback which ends with a reversal candle to the upside. It seems gold is working its way through that process now.
Today’s Pop & Drop is not bullish price action and I expect we see a couple more down/sideways days before higher prices are reached. There are two bullish ways gold could pullback. First one would be a drop to $115 area with below average volume which could form the right shoulder of a reverse head & shoulders pattern, or we could see prices just fade sideways on light volume for 2-4 days before another up move starts.
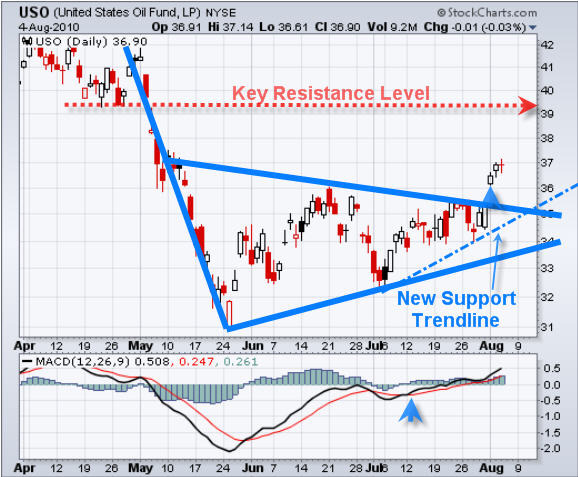
USO – Oil Trading Fund
Oil just had a 3 day pop and with today’s doji candle the chart is saying it needs a breather. That also falls inline with the price of the US dollar which should continue higher tomorrow (Thursday Aug 5th) putting downward pressure on crude oil.
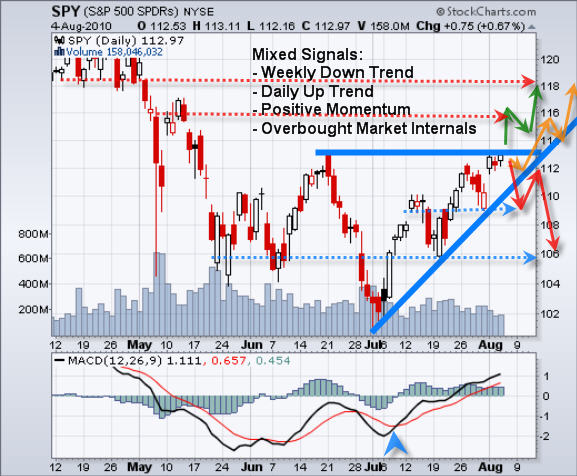
SPY – SP500 ETF Trading Signals
SP500 had a nice pop on Monday taking it up to the first key resistance level. The best play would have been to buy last Thursday or Friday when it dropped down to support unfortunately the intraday charts at that time were not that healthy looking.
I am not a fan of trading breakouts because so many of them fail and you end up paying a premium for your position and they can end up going against you very quickly. Rather I focus on trying to pick things up at support or sell them at resistance.
If we see the price pause for another 1-4 days on light volume and hold above the support trendline we could have a great low risk entry point with a stop set just below support. Or we could see a pop then pullback to test the breakout level as which point we can take a long position. This play needs to mature a little more.
Mid-Week Gold, Oil and Index Trading Conclusion:
In short, Gold, Oil and the SP500 look ready for a small pullback or some sideways price action. It will be interesting to see how strong the pullback will be on the SP500. The chart pattern and volume while they favor higher prices at the moment, if the support trendline is breached then selling volume will most likely spike and a sharp decline will occur causing the SP500 to drop approximately 3% all the way down to the $109 area.
Well, that’s it for now. If you would like to test out my trading service which has a 30 day money back guarantee visit my site at: www.TheGoldAndOilGuy.com
Chris Vermeulen
Even though St. Louis Fed President Jim Bullard created a bit of frisson last week by discussing deflation, and Treasury yields are awfully reminiscent of Japan, investors and consumers have been so conditioned to be on the watch for inflation (particularly increases in food and fuel prices), that the suck of deflation on much bigger fronts (housing and increasingly, pay) is not being weighted as seriously as it deserves to be.
Steve Greenhouse of New York Times, keying off a data release earlier in the day that showed a teeny fall in incomes, reports that more employers are rolling back pay. It’s most common among state and local government employees, but far from limited to them.
It is hard to prove in a tidy way, but I see more signs of discounting in the economy, even in goods and services aimed at upper income consumers supposedly unaffected by the downturn. There is a great deal of price cutting afoot, even in TARP/Fed funded Manhattan, via keeping nominal prices the same but offering more widespread and deeper “special” discounts or freebies. Readers are welcome to add to this list: rentals (free months, free amenities), health club memberships, cruises, decorators.
From the New York Times:
Pay cuts are appearing most frequently among state and local governments, which are under extraordinary budget pressures and have often already tried furloughs, i.e., docking pay in exchange for time off. Warning that they will have to lay off people otherwise, many governors and mayors are pressing public employee unions to accept a reduction in salary of a few percentage points, without getting days off in exchange.
At the University of Hawaii, professors have accepted a 6.7 percent cut. Albuquerque has trimmed pay for its 6,000 employees by 1.8 percent on average, and New York’s governor, David A. Paterson, has sought a 4 percent wage rollback for most state employees. State troopers in Vermont agreed to a 3 percent cut. In California, teachers in the Capistrano and Pacheco school districts have accepted salary cuts…..
In a 2010 survey by the National League of Cities, 51 percent of the cities that responded said they had either cut or frozen salaries of city employees, 22 percent said they had revised union contracts to reduce some pay and benefits, and 19 percent said they had instituted furloughs.
Some businesses are also cutting workers’ pay, often to help stay afloat or to eliminate their losses, although a few have seized on the slack labor market and workers’ weak bargaining power to cut pay and thereby increase their profits and competitiveness….
Factory owners sometimes warn that they will close or move jobs to lower-cost locales unless workers agree to a pay cut. In its most recent union contract, General Motors is paying new employees $14 an hour, half the rate it pays its long-term workers.
Sub-Zero, which makes refrigerators, freezers and ovens, warned its workers last month that it might close one or more factories in Wisconsin and lay off 500 employees unless they accepted a 20 percent cut in wages and benefits…
David Lewin, a professor of management at the University of California, Los Angeles, who has written extensively on employee compensation, says some cuts are also quietly taking place among nonunion employers.
Reed Smith, a firm with 1,500 lawyers, has cut salaries for first-year associates in major cities to $130,000 from $160,000. Warren Hospital, a nonunionized facility in Phillipsburg, N.J., ordered pay cuts of 2 to 4 percent because lower Medicaid reimbursements had squeezed the hospital’s finances…..
Fast-rising pension and health costs are making benefit costs grow more rapidly than wages, some employers say, and cutting wages is often easier than other ways to pare labor costs. But some workers say these cuts are unfair at a time when corporate profits and employee productivity have risen strongly.
With this sort of pressure on incomes (both direct and indirect; even if an employee’s compensation is intact, there is no assurance it will stay that way), it’s no wonder consumer confidence is plunging. In addition, the Consumer Metrics Institute, which maintains a set of indexes on consumer spending, sees patterns that bode ill (hat tip reader Scott):
Since last week our ‘Daily Growth Index’ has dropped significantly, putting the trailing 91-day moving ‘quarter’ at a contraction level that would place a similar calendar quarter of GDP growth below the 5th percentile of all quarters since 1947. Under normal circumstances we might expect a quarter that bad once in slightly over 5 years:

The chart above clearly shows that things were much better one year ago, when the recovery was peaking in late August and early September of 2009….The decline during in the 4th quarter of 2009 was spectacular, and it has been steady throughout 2010. For those of you who are curious, the last time that our ‘Daily Growth Index’ passed the 5th percentile on the way down was on July 16th, 2008.
Yves here. In another shades of Japan development, the consumer falloff, while not as bad as 2006 or 2008, looks more stubborn:
More telling perhaps for economic forecasts is that the longevity of the current contraction is somewhat rarer than its nominal severity. Our 183-day moving ‘two consecutive quarters’ growth index would place that 6-month span in the 4th percentile of consecutive quarters since 1947. Only roughly one in every 25 six-month periods since the first Truman Administration would have been worse. The lingering nature of the current contraction can be seen in our Contraction Watch:
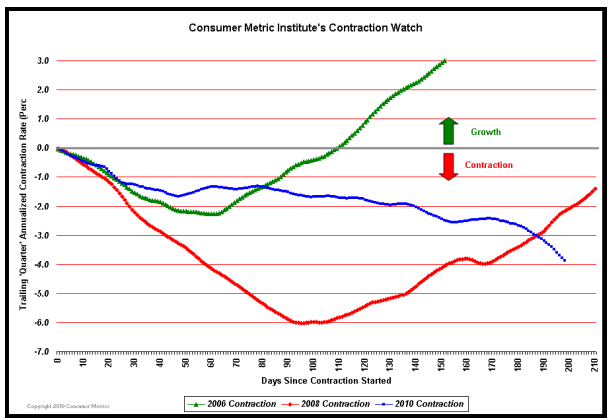
…. As we approach 200 days of contraction the 2010 event is now worse on a day-by-day basis than either of the two earlier slowdowns, and unlike the prior two events the current one has not yet formed a bottom.
Market Musings & Data Deciphering
Deep Dish with Dave
I see once again that the S&P500 is at a crossroad, but this time after a huge bounce. The market is having as much trouble now with resistance levels as it was encountering difficulty breaking below support levels just a short month ago.
Currently, the S&P 500 is a lock between 1,000 and 1,200 and we are now right at the midpoint. This range-trade pattern will break at some point and my sense is that it will be to the downside, and at that time we will see who has the cash (to put to work) and who’s left with the trash (and about to be trashed).
The level of complacency over the economic outlook is palpable and so reminiscent of the fall of 2007 when everyone believed the Fed could navigate us into a soft landing in the face of a credit collapse. Now the pundits have all but abandoned the ECRI index as a leading indicator (even the architects have) of economic activity. The ISM is dipping, but still above 50, didn’t you know. Corporate earnings were stellar in the second quarter — who cares if the results were skewed more to April than June? The savings rate has spiked to 6.4% in June, and many pundits see this as a valve for the U.S. consumer to reload the spending gun as opposed to a new secular theme of frugality.
…..read the whole report HERE
Gold and The Terminally Ill Dollar
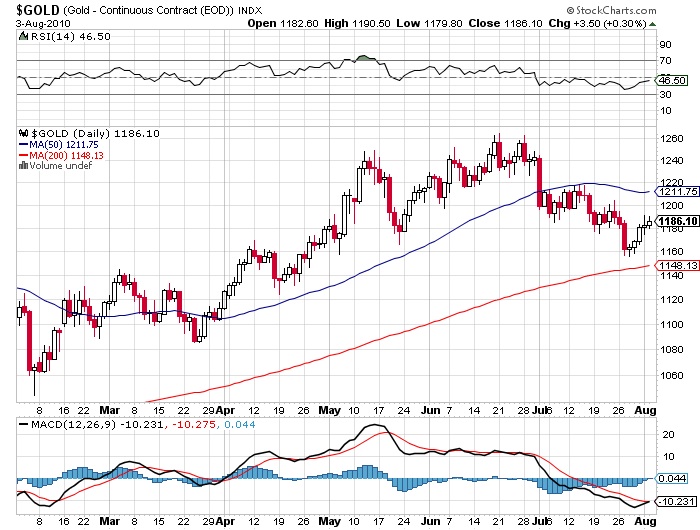
We’re at some key technical points on gold and the U.S. Dollar.
Gold is very close to giving an MACD buy signal. A close above the 50-Day M.A. just above $1,210 would also likely lead to some serious short-covering. The news out of China and elsewhere that gold demand is very strong comes as no surprise especially since “Tokyo Rose” has claimed the opposite forever.
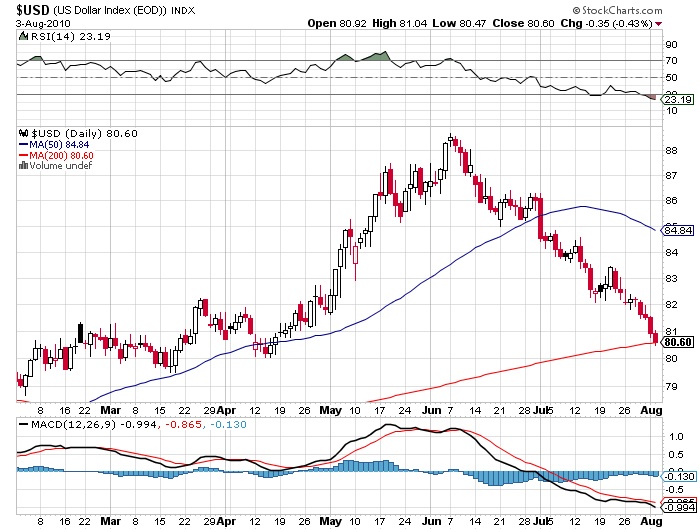
The 80 area on the U.S. Dollar Index is critical support and is being tested as we speak despite an already very oversold condition. Closes below 80 could bring on a wave of dollar selling.
No matter what the “Don’t Worry, Be Happy” propaganda tries to tell you about the U.S. Dollar, the reality of Uncle Sam is this:
“The moment many gold bulls have been waiting for….
Financial blog Zero Hedge made this statement after learning that the Chinese Central Bank has released a directive informing everyone it is commencing the development of a healthy gold market.
In the release, the People’s Bank of China (PBoC) stressed the need to develop the market to serve the overall situation of China’s gold industry, based on improving the competitiveness of China’s financial markets, effectively strengthening
innovation, and promoting the formation of a multi-level market system. Reportedly, the PBoC has asked the Shanghai Gold Exchange, Shanghai Futures Exchange and commercial banks to become actively engaged in developing a national gold market. Zero Hedge highlighted, “With China owning a mere 1,064 tonnes of gold (sixth in the world and well behind both France and the GLD ETF in terms of holdings), which represent just 1.6% of its reserve holdings, there is only one way to interpret this borderline revolutionary press release. China has now officially entered the gold market.” The PBoC said it will support overseas investment plans by large-scale bullion companies by backing them financially. Bloomberg highlighted thatChina is calling on its banks to extend credit lines to gold producers and offer loans for overseas acquisitions. This is the first time the Chinese government has singled out bullion producers for financial support in overseas purchases. Chinese bullion producers have completed fewer than five overseas acquisitions of rivals in the past 10 years, according to data compiled by Bloomberg.”
The Week’s Top Picks
It’s been my opinion that gold has been in the “mother” of all secular bull markets and before it’s all said and done, it can have a 2 handle in its price ($2,000+).
While we have had in the past (and can expect more in the future) some short buy sharp corrections, I continue to remain firmly in the bullish camp for three key factors:
The biggest single holders of gold, Central Banks, have gone from major net sellers to either net neutral or net buyers.
Gold producers, who IMHO once cut off their noses to spite their faces by selling forward large quantities of future production, have come to realize hedging is a “four letter word” among their shareholders and potential investors.
Gold has rightfully taken its place as the only real currency by rising and setting records in most major currencies (this feat was not to be if one had listened to one of the most notorious gold perma-bears).
There are numerous other bullish factors including growing geopolitical concerns worldwide, but in my opinion, the above three are the driving forces. Until such time one or more of these factors change, I don’t see any major top possible.
Silver, the poor man’s gold, should mainly play second fiddle to gold, but nevertheless should more than just tag along for the ride. I have for quite some time suggested being seriously over weighted in precious metals over base metals, but metals overall continue to be the primary place I suggest one look for long-term capital gains.
Yes, the easy money has been made but the fat lady hasn’t even gotten in the limo yet, let alone arrived in the building and is ready to sing.
Peter Grandich is the founder of Grandich.com and Grandich Publications, LLC, and is editor of The Grandich Letter which was first published in 1984. On his internationally followed blog he comments daily about the world’s economies and financial markets and posts his views on social and political topics. The result is an insightful and intuitive look at business, finances and the world, set in a vernacular that just about anyone can understand.
He is a member of the National Association of Christian Financial Consultants, and a long-standing member of The New York Society of Security Analysts and The Society of Quantitative Analysts.
Visit the Prosepctor’s Home Page…
A lot of wealthy people I talk to are building up sizable gold assets in their portfolios. They look at the long term fundamentals of the US economy and don’t like what they see. So they are accumulating gold as both a hedge and to some extent a capital gains play. Here’s a price chart of gold over the past five years (click to enlarge):

You can see that those who have owned gold for the past five years have made three times their money. And I’ve heard gold bulls say that $3000/ounce is their price target. So that’s 2.5x where it is now.
We’ve had a number of conversations about gold in the comments to this site, but I’ve never posted about my thoughts on the subject. So I thought I should.
I’m not a fan of gold. It does not produce any income. It is not a productive asset. It does have value in many commercial uses but that is not what drives its fundamental value.
Gold is valuable because it always has been. It has been used many times over the years as a backstop for currencies under a monetary system called the Gold Standard. The theory is that when investors lose confidence in a government’s currency, they can exchange the bills for gold.
So investors have been trained that in times of crisis, you want to own gold. And if you look at that five year gold chart, it sure looks like more and more investors want to own gold right now.
I’m not sold on gold. I don’t really know what I’d do with a bunch of gold. On the other hand, I do understand the need to have a portion of your net worth in tangible assets that you can touch, control, and physically own.
I prefer real assets like commercial real estate and land. These assets can be scarce, you can own them outright, you can touch and feel them, and most importantly you can generate income with them.
Let’s say you had $1 million of cash in the bank that you wanted to use as a hedge against a major financial disaster. You could purchase gold bullion and take delivery of it and put it in a safe at a bank. Or you could purchase a building with a number of apartments for rent with it. The gold will sit safely in the bank earning you nothing. A building purchased for $1mm could produce something like $100,000 per year in rental income if you buy it right.
If the financial disaster was really terrible, your building might go down in value, but as long as you own it outright and don’t have a mortgage on it, there is no reason that you’d have to sell it. You could continue to generate the $100k per year of income assuming rental rates hold up. And generally speaking, real estate will maintain its value over the long haul.
The same logic applies to productive land (ie farmland). If you buy it right and don’t borrow against it, land will produce income regularly and should retain its long term value.
So that’s my case against gold and in favor of real assets. I think it is very smart to have a percentage of your net worth in non-financial assets (stocks, bonds) and non-cash assets. We all saw what can happen with the financial system has a meltdown. And it could have been a lot worse had the government not stepped in.
So if you have a nest egg that you want to protect, think about putting some non-financial assets into the mix. But I’m just not sure that gold is the best way to do that.
Fred Wilson began his career in venture capital in 1987. He has focused exclusively on information technology investments for the past 17 years. From 1987 to 1996, Fred was first an Associate and then a General Partner at Euclid Partners, a New York based, early stage, venture capital firm founded in 1970. In 1996, Fred co-founded Flatiron Partners. He is currently the Managing Partner of Union Square Ventures (http://www.unionsquareventures.com/). Fred has a Bachelors degree in Mechanical Engineering from MIT and an MBA from The Wharton School of Business at the University of Pennsylvania. Fred is married with three kids and lives in New York City.
-
I know Mike is a very solid investor and respect his opinions very much. So if he says pay attention to this or that - I will.
~ Dale G.
-
I've started managing my own investments so view Michael's site as a one-stop shop from which to get information and perspectives.
~ Dave E.
-
Michael offers easy reading, honest, common sense information that anyone can use in a practical manner.
~ der_al.
-
A sane voice in a scrambled investment world.
~ Ed R.
Inside Edge Pro Contributors

Greg Weldon

Josef Schachter

Tyler Bollhorn

Ryan Irvine

Paul Beattie

Martin Straith

Patrick Ceresna

Mark Leibovit

James Thorne

Victor Adair