
Daily Updates

This Excerpt from Mark Leibovit’s VR Silver Newsletter covering Stocks, Bonds, Gold, US Dollar, Oil CLICK HERE.For a trial Subscription of The VR Silver Newsletter covering Stocks, Bonds, Gold, US Dollar, Oil CLICK HERE The VR Gold Letter is available to Platinum subscribers for only an additional $20 per month, while for Silver subscribers the price is only an additional $70.00 per month. Prices are going up very shortl, so act now! Separately, the VR Gold Letter retails for $1500 a year! The VR Gold Letter is published WEEKLY. It is 10 to 16 pages jam-packed with commentary and charts. Please call or email us right away. Tel: 928-282-1275. Email: mark.vrtrader@gmail.com
It’s Turnaround Tuesday, The Bonds Are Becoming Parabolic, And Maybe The Hindenburg Will Strike Iran – Not Israel!
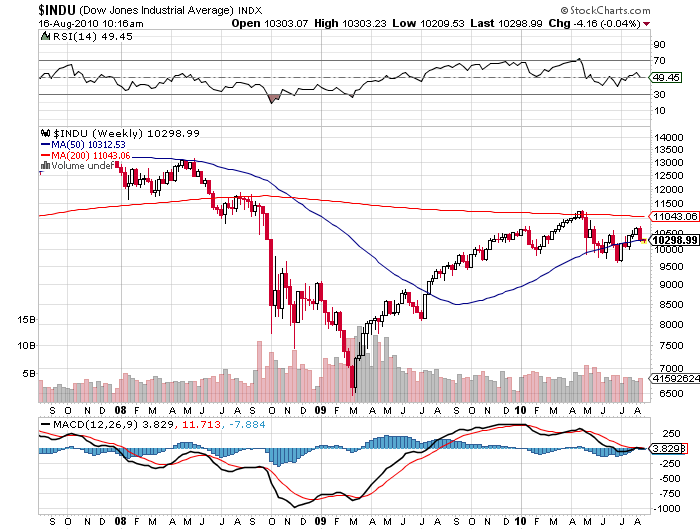
The stock market opened sharply lower yesterday after disappointing economic news but then recovered its losses and traded sideways for the rest of the session to finish the day mixed. The Dow slipped 1.14 to 10302.01, the S&P was up 0.13 at 1079.38, and the NASDAQ rose 8.39 to 2181.87. Volume was light and breadth was positive.
Although we saw some real safe-haven buying yesterday with gold and Treasuries rallying, inside the stock market we saw the opposite. Small Caps (IWM +0.80%) stages a decent rally compared to a small decline in Large Caps (SPY +0.05%), but Small Caps had underperformed recently and maybe now they are trying to regain lost ground. And despite the weak economic news, economically sensitive stocks didn’t do too poorly (XLI -0.20% and XLY -0.03%) yesterday. But of course, the Materials sector was the top performer (XLB +0.45%) as metals staged a big rally. Technology was not far behind (XLK +0.19%) after Dell (DELL -0.42%) said it would buy 3Par Inc. (PAR +86.53%), a data-storage company that specializes in virtualization-storage services, for $1.15 billion. On the other hand, Healthcare stocks fell (XLV -0.52%) after analysts at Deutsche Bank initiated coverage of Amgen (AMGN -1.71%) with a hold rating, citing valuation and weakened sales. Hold ratings from Deutsche Bank also pushed down shares of two other major biotech companies. Shares of Celgene (CELG -0.32%) and Biogen (BIIB -0.16%).
The S&P fell below its 50 day moving average last Thursday. For the last three days, it has barely budged as it sits just below that key level. We are entering a cyclically weak period, one that is prone to violent moves, especially down. I am open to playing either side of the market, but given the time frame and the recent decline, I am obviously more inclined to play the down side especially if can stage a rally this week and perhaps even into the end of the month and Labor Day weekend. Start of th business year, end of vacations, and back to school made September a leading barometer for many, many years and now portfolio managers back after Labor Day tend to clean house.
I recommend you watch the Russell 2000 if the market does move down here. While the S&P is trading 6.8% above its July low, the Russell 2000 is just 4.7% above its low and the small cap index is more prone to quick moves than the large cap indexes. If the market heads lower. It will likely be the small caps leading the way and the Russell 2000 is very likely to be the first major index to break down to new lows. [By the way, the less followed S&P 600 Small Cap Index is only 3.8% above its July low. Watch this one as well.
Platinum subscribers took profits last week on my inverse ETF recommendations and are now awaiting a re-entry opportunity, hopefully on a rally.
Gold
Gold rose to a six-week high amid safe-haven buying after some disappointing economic data, a weak Dollar, and renewed concerns over sovereign debt in peripheral euro-zone countries. Gold rallied 10.10 to 1225.50. There is growing press that Israel will attack Iran on or about August 21. Former U.N. Ambassador John R. Bolton is attributed to the story and revolves around the story that the clock is ticking sparked by the news that Russia will begin loading nuclear fuel rods into the Bushehr reactor next week. Technically, Gold has the potential to explode here to the upside.
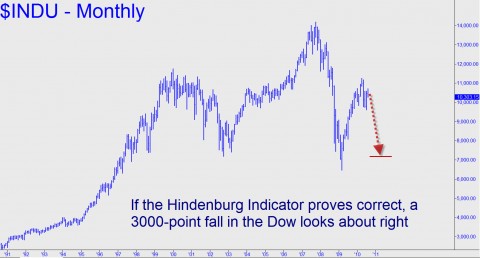
The Hindenberg Omen (via Money Talks)
Even Hindenburg Omen Is Right Sometimes
The Hindenburg Omen is once again predicting a stock market crash, and we don’t know whether to ignore it and relax because (even) the Wall Street Journal has picked up on it this time, or to batten the hatches because sometimes even lousy indicators can be right. Over time, however, the indicator, invented by a blind mathemetician named Jim Miekka, has racked up an unimpressive track record. While virtually every crash since 1987 has indeed been signaled by the Omen, there have been so many false signals that the indicator’s overall accuracy has been a dismal 25 percent. Now, according to Miekka, the Omen is signaling a crash in September, having registered two key statistical events. For one, NYSE highs and lows both exceeded 2.5%; and for two, a rising 10-week moving average for the NYSE diverged relative to a negative McClellan Oscillator.
The Journal had no trouble rounding up the usual skeptics to comment on the voodoo aspects of an indicator that takes its name from the fatal and still-unexplained 1937 explosion of a German passenger airship docked at Lakehurst (NJ) Naval Air Station. Thirty-six people died, including 35 people of the 97 people who were on board, and the cause of the fire was never determined. “We always love good conspiracy theories,” market strategist Joseph Battipaglia told the Journal. “I for one dismiss all these things because they usually erupt most numerously during bear markets.” Well, at least Battipaglia seems to be acknowledging that stocks are in a bear market. Many in his and the Wall Street Journal’s line of business – i.e., telling the public what it wants to hear abolut the economy – have yet to accept that all of those “green shoots” that supposedly were springing up a little more than a year ago were just hallucinations. For the hard-core optimists, the stock market’s weakness over the last three years, including the Dow’s horrific, 7728-point plunge from the October 2007 high, has been a mere correction in a long-term bull market begun in August 1982.
Who Is Rick Ackerman?
Barron’s once labeled him an “intrepid trader” in a headline that alluded to his key role in solving a notorious pill-tampering case. He received a $200,000 reward when a conviction resulted, and the story was retold on TV’s FBI: The Untold Story. But to the gang at CNBC, he’s been a pariah for the last ten years – a shoot-from-the-hip kinda guy whose irreverent style got him banned from the show after an interview on Squawk Box was alleged to have gone awry.
His professional background includes 12 years as a market maker on the floor of the Pacific Coast Exchange, three as an investigator with renowned San Francisco private eye Hal Lipset, seven as a reporter and newspaper editor, three as a columnist for the Sunday San Francisco Examiner, and two decades as a contributor to publications ranging from Barron’s to The Antiquarian Bookman to Fleet Street Letter and Utne Reader. His detailed strategies for stocks, options, and indexes have appeared since the early 1990s in Black Box Forecasts, a newsletter he founded that originally was geared to professional option traders.
Rick Ackerman is the editor of Rick’s Picks and a partner in Blue Fin Financial LLC, a commodity trading advisor.
Could Wall Street be about to crash again?
This week’s bone-rattlers may be making you wonder.
I don’t make predictions. That’s a sucker’s game. And I’m certainly not doing so now.
But way too many people are way too complacent this summer. Here are 10 reasons to watch out.
1. The market is already expensive. Stocks are about 20 times cyclically-adjusted earnings, according to data compiled by Yale University economics professor Robert Shiller. That’s well above average, which, historically, has been about 16. This ratio has been a powerful predictor of long-term returns. Valuation is by far the most important issue for investors. If you’re getting paid well to take risks, they may make sense. But what if you’re not?
2. The Fed is getting nervous. This week it warned that the economy had weakened, and it unveiled its latest weapon in the war against deflation: using the proceeds from the sale of mortgages to buy Treasury bonds. That should drive down long-term interest rates. Great news for mortgage borrowers. But hardly something one wants to hear when the Dow Jones Industrial Average is already north of 10000.
3. Too many people are too bullish. Active money managers are expecting the market to go higher, according to the latest survey by the National Association of Active Investment Managers. So are financial advisers, reports the weekly survey by Investors Intelligence. And that’s reason to be cautious. The time to buy is when everyone else is gloomy. The reverse may also be true.
…..read 4-10 HERE
When the Elliott wave count and a classic technical analysis pattern both say the same thing about the stock market, it’s best to pay attention.
Here’s how the August issue of the Elliott Wave Financial Forecast described the head and shoulders pattern unfolding now in the stock market:
“The weekly Dow chart [below] shows the development of an intermediate-term, head-and-shoulders pattern from the January high at 10,729.90 to the present. The January high marks the left shoulder, the April 26 high at 11,258 is the head, and the right shoulder is now ending. The April EWT discussed the pertinent characteristics that Edwards and Magee used to define this technical pattern… all apply to the current formation. Observe how weekly stock trading volume has contracted during the development of the right shoulder, a necessary trait of this pattern. The downward-sloping neckline–exactly as on the big ten year pattern–displays market weakness, which is consistent with our interpretation of the wave structure.”
This chart shows the head-and-shoulders pattern.
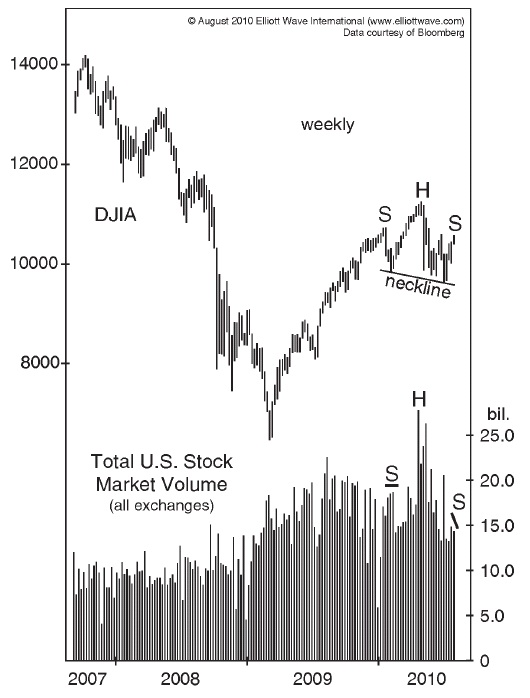
Here’s what Robert Prechter himself said in a recent Elliott Wave Theorist:
“Generally, when the neckline slopes downward, the right shoulder does not rise to the level of the left shoulder…”
Please look at the chart again — then re-read Prechter’s quote.
But how about the Elliott wave count? And what price target(s) are our analysts looking at now?
Following Chart by Money Talks
When Money Gets Scarce
By Robert E. Prechter Jr.
To anticipate great waves of change, investors need indicators that are ahead
of events. From 2000 to 2008, leading indicators such as debt expansion, debt
quality, extremes in leverage and record investor optimism warned of an
approaching sea change. In applying leading indicators, my book Conquer the
Crash — You Can Survive and Prosper in a Deflationary Depression was early in
expecting the turn. But its scenario — which was until then widely considered
impossible — is playing out.
In the past two years, even lagging indicators have showed signs of
deflation. But Americans lived in a climate of monetary inflation for
three-quarters of a century. Inflation was “normal” for so long that it
appeared to be the only possible reality. It is difficult to imagine its
opposite, even when it is already happening.
….read the rest HERE
Stockscores.com Perspectives for the week ending August 13, 2010
Trading By The Numbers
In this week’s issue:
Weekly Commentary
Strategy of the Week
Stocks That Meet The Featured Strategy
![]()
Here are some numbers that relate to trading, and some important lessons that come with them:
1.95
In statistical analysis, a T-statistic is a measure of how many standard deviations from the average a tested event is. A t-stat of 1.95 means that the result is two standard deviations from the average, which means the result is statistically significant 95% of the time.
This is important to me as a trader because I am always looking to trade abnormality. Where there is abnormal trading activity there is opportunity and the chance of success improves. The Stockscores Approach to trading is built around the number 1.95 and what it means in statistics.
90
90% is my guess for how many aspiring traders fail. Trading is simple but it is not easy. Do not expect to learn how to trade with consistent profitability overnight. It takes time, determination and discipline to learn how to trade well. Trading is a great profession and can certainly be lucrative, but don’t have illusions that success in the market comes easily.
70
If you are right 70% of the time in the market, you are doing amazingly well. However, don’t think that being right is what makes traders profitable. How much you make when you are right versus how much you lose when you are wrong is what is important. You can be a profitable trader by being right 10% of the time if you have big winners and small losers. Every trader needs to focus on the expected value of their trades; how much they expect to make if they do the same trade 100 times.
30
If you can be right 70% of the time then that means you will be wrong and lose money 30% of the time. Most rookie traders fail to realize that losing is part of making money. When the market proves you wrong, you must take the loss and move on. It is dangerous to hold on to losers, they tend to grow much bigger over time causing small losers to turn in to big losers. Big losers overpower the winners so overall profitability suffers.
(continued below)
- Get the StockSchool Pro Free


Open and Fund a brokerage account with DisnatDirect and receive the StockSchool Pro home study course free, including special Pro level access through the DisnatDirect client website. Offer only available to Canadian residents. For information, click HERE
20
I have been trading for 20 years and I still find that I learn something new every day. The market is a fascinating thing that can never be mastered . You can only know enough to make money, but the learning never stops.
1
There is only one person who can be blamed for your success or failure in the market, and that is you. As soon as you start to blame or rely on others you are destined to fail. Leverage the experience of others to help you succeed but remember where the buck stops – with you!
2
An average reward for risk of 2 is excellent. This means that your average winning trade delivers a profit that is double your average loss. As your success rate goes down, this number must increase if you are to be profitable.
4
There are four pillars to what I teach aspiring traders. To be successful, you have to learn and understand when to buy, how to manage risk, when to sell and how to manage your emotions. The last one is the hardest thing to do.
2008
The year that proved that diversification is not an ideal way to manage risk. Most investments are correlated to one another, especially during extreme times. Manage risk by limiting losses when you are wrong.
![]()
The market is not looking great right now, so this week I did some scanning to find stocks to hide out in. I wanted to find stocks that were optimistic despite the general fear that is in the market right now.
I began by focusing on Canadian stocks since the Canadian market has a heavy weighting of mining stocks, one area of strength right now. Canada is not suffering the same macro economic concerns as the US.
I did a pretty simple scan, looking for Canadian stocks that have a Sentiment Stockscore of 60 or higher and trading at least 500 times a day. This returns optimistic stocks that have decent liquidity.
Here are a few names to consider as they appear likely to hold up well in a bearish summer market.
![]()
1. T.CG
After trading sideways for a few months, T.CG is moving to new highs. The Gold sector is strong while the rest of the market is not. Support at $12.70.
2. T.REI.UN
Optimistic and paying a yield of 6.90%, support at $19.50.
References
Get the Stockscore on any of over 20,000 North American stocks.
Background on the theories used by Stockscores.
Strategies that can help you find new opportunities.
Scan the market using extensive filter criteria.
Build a portfolio of stocks and view a slide show of their charts.
See which sectors are leading the market, and their components.
Click HERE for the Speaker Lineup and to Purchase the video if you want to learn from some of the worlds best traders including Tyler Bollhorn.

Tyler Bollhorn started trading the stock market with $3,000 in capital, some borrowed from his credit card, when he was just 19 years old. As he worked through the Business program at the University of Calgary, he constantly followed the market and traded stocks. Upon graduation, he could not shake his addiction to the market, and so he continued to trade and study the market by day, while working as a DJ at night. From his 600 square foot basement suite that he shared with his brother, Mr. Bollhorn pursued his dream of making his living buying and selling stocks.
Slowly, he began to learn how the market works, and more importantly, how to consistently make money from it. He realized that the stock market is not fair, and that a small group of people make most of the money while the general public suffers. Eventually, he found some of the key ingredients to success, and turned $30,000 in to half a million dollars in only 3 months. His career as a stock trader had finally flourished.
Much of Mr Bollhorn’s work was pioneering, so he had to create his own tools to identify opportunities. With a vision of making the research process simpler and more effective, he created the Stockscores Approach to trading, and partnered with Stockgroup in the creation of the Stockscores.com web site. He found that he enjoyed teaching others how the market works almost as much as trading it, and he has since taught hundreds of traders how to apply the Stockscores Approach to the market.
Disclaimer
This is not an investment advisory, and should not be used to make investment decisions. Information in Stockscores Perspectives is often opinionated and should be considered for information purposes only. No stock exchange anywhere has approved or disapproved of the information contained herein. There is no express or implied solicitation to buy or sell securities. The writers and editors of Perspectives may have positions in the stocks discussed above and may trade in the stocks mentioned. Don’t consider buying or selling any stock without conducting your own due diligence.
The US Department of Agriculture may have some usefulness. Projecting future prices isn’t one of them. In 2005, it looked five years ahead and saw a bushel of wheat selling for $3.50. Last week, the price rose to more than twice that much.
Why? God himself is to blame. Not since 1880 has Russia been so dry. And not since Napoleon’s invasion has Moscow suffered so much soot. The government banned wheat exports and prices shot up to their highest point in 51 years. In the curious way that one thing lead to another, Napoleon’s Russian Campaign grew out of the French Revolution like a forest fire out of a careless barbecue. The revolution stirred up enemies on all France’s frontiers. When Napoleon had finished with them all, he had to reach farther – all the way to the banks of the Moskva River – to get his fingers burnt.
But the Revolution may never have happened without the summer of 1789. That was God’s work too. That summer was the opposite of the Russian summer of 2010. Europe was cold and rain-soaked, believed to be the result of the explosion of the volcano Laki in Iceland. The price of bread in Paris rose 67% in 1789. The average laborer only made about 20 sous a day, barely enough to buy a loaf of bread. The intellectuals may have been stirred by the Enlightenment. But it was high bread prices that gave the mob an appetite for revolution.
One of the awake observers of this period was a young Anglican clergyman named Thomas Malthus. While the rest of the intelligentsia imagined a world of industrial and social progress, Mr. Malthus peered down to the bottom of a dark well. Ten years after the French Revolution, he published his Essay on the Principle of Population. His point was simple, obvious and modest: populations can grow faster than food production. This led to the idea of a “surplus” of humanity, which was practically a Christian heresy. It presumes that God is a jackass, something that occurs to the average man about once a day, but which is a rare thought for a member of the clergy. Everything in nature is bounded by limits and hounded by failure. Trees don’t grow to the sky. Bull markets don’t last forever. And every step people take in life brings them closer to the grave. God told man to be fruitful and multiply. Was he just setting him up for catastrophe?
But the Malthusian limits keep getting pushed back. Even after nearly two centuries and 6 billion more people added to the human population, most people can still multiply without worrying about mass starvation.
Paul Ehrlich published his Population Bomb, in 1968. But his prediction was as big a bomb as Malthus’s. Populations didn’t outrun food supplies. Instead, output per acre doubled in the ‘green revolution’ that followed – rising faster than the number of people. If people starved, it wasn’t God’s fault. And now, Le Monde reports that obesity may be a bigger health threat to the poor than starvation.
Forty years ago, experts said the world was running out of oil, too, with only 40 years’ worth of reserves. They predicted disaster. But huge new discoveries of deep reserves have been made since then. Four decades later and the world still has 40 years’ of reserves. The only a disaster was for those who were counting on buying it at $10 a barrel.
And now, the alarmists are on to other worries. Water, for example. Not that there isn’t plenty. The seas and rivers are full of it. But getting the right kind of water to the right place is going to be expensive.
Peak water…peak oil…peak food…peak this, peak that. After so many alarms with so few fires, many people think they can put away the fire extinguishers. Higher prices draw forth more supply…and substitutes. The limits seem to recede forever.
But the threat of disaster hasn’t disappeared; it is just retreating in good order like the Tsar’s troops…waiting for the worst possible moment to strike. There is only so much arable land. There is only so much water. There is only so much energy to move food and water. Man has been growing food for 12,000 years. Surely, he’s reached capacity, no? Experts see disaster coming again. The undeveloped world is still multiplying – and with much larger numbers. The population of the earth is expected to add nearly 3 billion people by the middle of this century. On that basis alone we’d need another “green revolution” to keep up with it. But since the mid-90s there’s been little improvement in farm output. In fact, people have eaten more than they’ve produced for most of the last decade. And as people get richer, thy change their eating habits. Grain is fed to the cows and pigs; people want meat. China’s consumption of pork, for example, increased 45% between ’93 and 2005. The need for grain multiplies 5 times faster than the people they are meant to support; a calorie from grains takes only about 20% of the inputs needed to produce a calorie from meat.
Is the world running out of wheat? No. There will be plenty of wheat available. But probably not at $3.50 a bushel.
But every half-empty glass is also half-full. The summer of 1789 was a disaster for plants in Europe. But with so much volcanic ash in the air, the sunsets were uncommonly pretty.
Bill Bonner
for The Daily Reckoning
It’s hard to believe that more than ten years have gone by since we began writing The Daily Reckoning out of a Paris office back in July of 1999…
Since then, a lot has changed. We have seen the dot com boom and bust…a massive expansion of credit…real estate mania and meltdown…and epic highs and lows in the markets.
Nothing about the past ten years has been boring. And we have been there throughout, trying to help readers make some sense out of our global economy. And hopefully providing a few laughs along the way.
In short, we pen The Daily Reckoning each day – for free — to show you how to live well in uncertain times. We aim to make each article the most entertaining 15-minute read of your day.
If you haven’t signed up yet, I urge you to do so right here. And don’t worry. It’s 100% free – no credit card is required.
-
I know Mike is a very solid investor and respect his opinions very much. So if he says pay attention to this or that - I will.
~ Dale G.
-
I've started managing my own investments so view Michael's site as a one-stop shop from which to get information and perspectives.
~ Dave E.
-
Michael offers easy reading, honest, common sense information that anyone can use in a practical manner.
~ der_al.
-
A sane voice in a scrambled investment world.
~ Ed R.
Inside Edge Pro Contributors

Greg Weldon

Josef Schachter

Tyler Bollhorn

Ryan Irvine

Paul Beattie

Martin Straith

Patrick Ceresna

Mark Leibovit

James Thorne

Victor Adair