

When the Elliott wave count and a classic technical analysis pattern both say the same thing about the stock market, it’s best to pay attention.
Here’s how the August issue of the Elliott Wave Financial Forecast described the head and shoulders pattern unfolding now in the stock market:
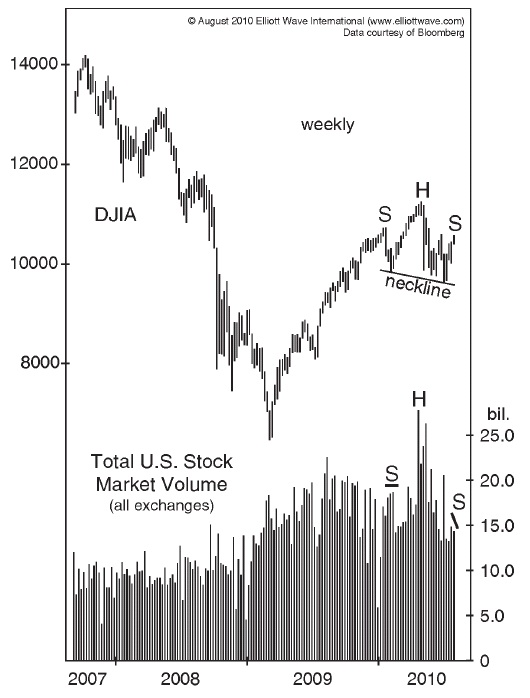
“The weekly Dow chart [below] shows the development of an intermediate-term, head-and-shoulders pattern from the January high at 10,729.90 to the present. The January high marks the left shoulder, the April 26 high at 11,258 is the head, and the right shoulder is now ending. The April EWT discussed the pertinent characteristics that Edwards and Magee used to define this technical pattern… all apply to the current formation. Observe how weekly stock trading volume has contracted during the development of the right shoulder, a necessary trait of this pattern. The downward-sloping neckline–exactly as on the big ten year pattern–displays market weakness, which is consistent with our interpretation of the wave structure.”
This chart shows the head-and-shoulders pattern.
Here’s what Robert Prechter himself said in a recent Elliott Wave Theorist:
“Generally, when the neckline slopes downward, the right shoulder does not rise to the level of the left shoulder…”
Please look at the chart again — then re-read Prechter’s quote.
But how about the Elliott wave count? And what price target(s) are our analysts looking at now?
Following Chart by Money Talks
When Money Gets Scarce
By Robert E. Prechter Jr.
To anticipate great waves of change, investors need indicators that are ahead
of events. From 2000 to 2008, leading indicators such as debt expansion, debt
quality, extremes in leverage and record investor optimism warned of an
approaching sea change. In applying leading indicators, my book Conquer the
Crash — You Can Survive and Prosper in a Deflationary Depression was early in
expecting the turn. But its scenario — which was until then widely considered
impossible — is playing out.
In the past two years, even lagging indicators have showed signs of
deflation. But Americans lived in a climate of monetary inflation for
three-quarters of a century. Inflation was “normal” for so long that it
appeared to be the only possible reality. It is difficult to imagine its
opposite, even when it is already happening.
….read the rest HERE