
Daily Updates
……read the whole 9 page Goldman report HERE
“Gold Market Poised For A Rally As US Real Rates Head Lower”
The recent sell-off has left speculative long positions in gold oversold relative to US real interest rates, which we believe has set the stage for a rally to our 6-month gold price target of $1,300/toz.
Via ZeroHedge: Goldman dedicates 9 pages to a regime change in which it goes openly bullish on gold. The report is attached, which we present without commentary but as always, if there is one flashing red light saying the peak price for any asset has been hit, it is a Strong Buy signal by Goldman. The report will likely result in a brief pop in spot over the next 24 hours as the idiot money rushes into the latest Goldman trap. Alas, it also means that GS is now offloading. Be very wary of market dynamics over the next month.
Richard Russell: The Fed didn’t come up with anything dramatic or exciting. There wasn’t even an announcement of plans for further “quantitative easing.” The Fed will continue to keep short rates at zero — and this for an extended period of time. Ed Note: Richard Russell has been “wracking my brain trying to come up with a vehicle that will allow (his) subscribers to receive some much-needed income.” In today’s letter he wrote about his solution to that difficult problem. It is an elegant solution and since his daily letter is only $300 a year, you might want to think about availing yourself of his valuable service. Especially since (The Hulbert Financial Digest has the 85 year old Russell tied for top place as a market timer on a risk-adjusted basis for the last 30 years, since 1980). Go HERE if you want to subscribe.
……read the whole 9 page Goldman report HERE
Ed Note: This is a transcription of Michael’s recent Market Minute on CKNW
Gord: Michael is the lower mainland housing market (greater Vancouver) slowing down not unexpected?
Michael Campbell: No it’s not. I mean this is what’s been on the table since the first quarter. I know in money talks we’ve been saying that the first quarter, if you had to sell, would be the time to do it. And it’s also what’s informing the predictions of people like the Bank of Canada. They really saw a much slower second half of last year. That was the one place (real estate ) that sort of had the bottom coming into the first quarter of 2009. Started to recover second quarter of 2009 and we really did head up with a vengeance then. A lot of pent up demand. I think that demand carried through right to the beginning, the first quarter in 2010. In April, people who had pre-approved mortgages, people who heard that ‘oh boy’ interest rates are going up jumped into the market too is my guess. So now affordability issues are coming in, maybe a slight bit of interest rate issues are coming in, and it is producing the kind of slow down that are reported in these numbers.
Gord: You mentioned affordability but that in layman’s language that’s good news for someone trying to break in to the market is it not?
Michael: Yes. It was interesting to see though we’re still up from this time last year in terms of price. But we have sagged a little bit at least and I was thinking when I first read the statics that we’ll get an adjustment in price now. I’ve in fact advised several people I knew to sell their homes going back a month or two, but to be very patient on the buy side because I thought the slow-down was coming and it always just takes a little bit longer for the price adjustment to really hit in and pull more buyers in. So if I was on the side lines and I was looking to be a buyer this is good news. Gord, it’s always a double edged sword. If I’m selling I wish I had a stronger volume mark and if I’m buying I’m kinda liking this.
Gord: Mike we have talked numerous times you and Michael Levi Saturday mornings on money talks and through out the week here on CKNW about some of the sunbelt states in the United States. That they need to recover before our forest sector in BC will really take off again. Where are we at with that?
Michael: Well you know they are really struggling down there and I just wanna give you a couple of examples. For me this are kinda wow numbers. I was thinking again sort of like you can’t help but look at the car accident as you drive by. I’ll give an example in Fort Lotterdale. Condos that were selling in this one complex, nice two bedroom, two bathroom condo’s are literary selling right now for $15,000. I personally know of an individual whose down in phoenix, they looked at an apartment. It was a three bedroom and I would call it a sort of a three and half to four star kind of complex out of five stars. The thing was listed at $325,000. After the drop it went to 275 they actually picked it up Gord, for 62 grand. You’re right. How do we get housing starts really going again in the States until that inventory is cleared up. I mean the numbers coming out of there for real estate still spell really bad news and really troublesome news for their economy. I mean we’re going to see predictions of one out of every three mortgages will be in some level of foreclosure in the states in the next year! I mean that’s crazy. So yes, they’ve got a long way to go and I think the implications are just huge. We’re feeling that reverberation, as you say, through the lumber industry. But think about somebody who gave me the old line, “well my retirement’s in my house”. Well good luck, it isn’t going to be much of a retirement.
Gord: Talk to me about the double dip recession, did those numbers make you think now that the United States is in a greater danger of a second full blown recession?
Michael: Well again I’m in that camp that says what we’re going to get is very slow growth. Very mediocre growth in the states and the worry is that you enter a sort of Japanese like long term slow growth environment. I’m not sure if we can start arguing at this point that we get 15 years of that. I think next year is going to show some pretty dismal numbers. Everybody listening should keep in mind that when we hear a gross domestic product number, an economic or growth number that says 3%, they’re comparing it with this time last year. Well it wasn’t very strong overall last year and we’ve had some of that recovery. I’ve got a feeling, for example, the first quarter of 2011 may be quite a week number cause you’ll be comparing it to a strong number in 2010. But I’m still in that camp that certain industries will certainly double dip. I’m not sure you can even argue you had a recovery in the US real estate market of any significance. I mean it’s sort of an L that went down and stays so long at the bottom. Different industries may have challenges there but I think the overall economy is still going to be able to show really mediocre growth numbers. Not negative growth. You need a couple of quarters of that before it’s a recession.
Gord: Michael one final question. Does this kind of environment mean that economic stats are to be paid attention to even more closely? I’m almost thinking that it’s a week by week story, I mean you’ve just said some numbers out of the United States that are eye poppers for you. That a couple of weeks ago we didn’t have…
Michael: I think what it is that whenever you’ve had a huge direction down, or if it happened to be a huge direction up, you are sort of making a change in direction so not all the stats come in consistently. Again remember we’re talking history when we’re reporting any stats. I mean even the housing it’s from last month so we’re talking history. But I’ll tell you this, I don’t think there’s a time where economics and financial stuff has ever been more important. I mean it has as direct impact on so many aspects of our lives, government’s ability to deliver services that many Canadians want, many Europeans want, many Americans want. I’ll just throw one final thing out Gord. I’m incredulous when I realize that people would tell me how dramatically things have changed in the world and then I come back and ask how is that impacted you? Do you do things differently? Are you thinking about problems differently? How has that change translated into either actions or at least approaches? I think we’re having trouble with that as a society and as individuals.
Gord: Michael as always thank you.
Michael: The cheerful Mike Campbell, thanks Gord.
Gord: Michael Campbell our mid week Money Talks on the world today. This is CKNW.
For more Michael Campbell commentaries go HERE
To read Peter Grandich’s Top Three Market Tips from his July 31st interview with Michael Campbell go HERE
To sign up for the new weekly “Top 3 Market Tips” as presented by each guest Michael Interviews on Michael’s 90 minute Saturday morning Money Talks radio show just send an email to info@moneytalks.net
Ready, Set, Gold: Best Months Are Just Ahead
Global economic conditions are now favorable for gold as a safe-haven investment. The US, Western Europe and Japan are close to buckling under the weight of their sovereign debt loads, government budget deficits remain large and persistent and, as a result, faith in major paper currencies is low.
On top of this, China – the world’s No. 1 gold producer and No. 2 gold consumer – is encouraging gold investing by its rapidly growing middle class, and will likely have to increase imports to meet this new demand.
If history is any guide, gold is about to get even more attractive because we are heading into the fall and winter gift-giving season. This is the time of year that gold jewelers typically do their biggest business. The kickoff is the Muslim holy month of Ramadan, which starts next week and ends with generous gift-giving in early September.

After Ramadan comes India’s post-monsoon wedding season, and in November there’s Diwali, one of India’s most important festivals. During the fall, jewelry makers in the US and Europe stock up in advance of the Christmas shopping season. And in China, there are two big gold opportunities: the week-long National Day celebration starting October 1, and the Chinese New Year in early 2011.
Looking at more than four decades of seasonality, September has been the best month of the year for gold and gold stocks.
The clear trend can be seen on the seasonality chart for spot gold. In a typical year, the September price rises 2.5% above the August price. And to make the case even more compelling, the gold price has risen in 17 of the 21 Septembers since 1989, by far the best success ratio of any month of the year.
In September 2009, the gold price jumped nearly 6%, well above the long-term average.
September is historically an even better month for gold stocks as measured by the NYSE Arca Gold Miners Index (GDM).
After the typically weak months of June and July, the gold miners start moving up in August and make an 8.3% leap in September. In September 2009, the jump was 14.5%. Since 1993, the GDM has been up 12 times in September and down just five times.
The strong correlation between the gold price and gold-mining stocks explains much of the average September jump for gold stocks, which have historically offered leverage to the gold price. In up markets, earnings growth has tended to exceed the increase in gold price. In down markets, the leverage works in the opposite direction – gold stocks also tend to decline more when the price of bullion is falling.
This leverage is shown on the chart of how bullion and the miners have fared in late-summer and fall rallies during the gold bull market that began in 2001. These up-trends have generally occurred between mid-July and early October, though in 2004 it extended into late November.
The gold price has climbed an average of 12.4% during the 2001-09 seasonal rallies even as the price steadily moved into four digits. As good as that result was, the impact on gold stocks was even stronger – their annual jump averaged more than 26%.
In 2010 the trend could be shaping up right on schedule. From a recent bottom of $1,157 per ounce in late July, spot gold had risen more than 4% through mid-afternoon on Aug. 6 and the TSX/S&P Global Gold Index had gained more than 6%.
Bank of America-Merrill Lynch recently called for $1,300 gold by October-November 2010 as a result of the seasonal demand, and the gold watchers at CIBC World Markets in Toronto see $1,400 gold next year due to strong investment demand and inadequate supply response.
Given the current economic weakness, CIBC pointed out that during the Great Recession, “gold was one of the only investment classes that provided positive returns. This fact will not be forgotten if the next recession materializes.”
Its analysts also say that gold equities look relatively cheap compared to bullion, adding that, for the first time ever, some of the big producers are trading at price-earnings ratios below the S&P 500 Index average.
Going back to 1971, when President Nixon ended dollar convertibility into gold and deregulated the price of gold, gold stocks have tended to outperform the S&P 500 when the federal government runs budget deficits. Through 2019, the annual federal deficit is projected to average around $1 trillion, creating the potential for gold stocks to remain an attractive investment relative to the broader market for years to come.
Based on the long-term record, this may be a good time for investors to consider establishing or adding to a gold or gold-stock position in advance of seasonal demand growth. Historical patterns may be a useful guide and improve the chances for investment success, but of course, there are no guarantees that the fall of 2010 will follow the well-established trend.
Frank Holmes is CEO and chief investment officer of U.S. Global Investors. This first appeared in his Frank Talk blog.
The NYSE Arca Gold Miners Index is a modified market capitalization weighted index comprised of publicly traded companies involved primarily in the mining for gold and silver. The index benchmark value was 500 at the close of trading on December 20, 2002. The S&P 500 Stock Index is a widely recognized capitalization-weighted index of 500 common stock prices in U.S. companies. The Toronto Stock Exchange Gold and Precious Minerals Index is a capitalization-weighted index designed to measure the performance of the gold and precious minerals sector of the TSX 300 Index. The S&P/TSX Global Gold Index is an international benchmark tracking the world’s leading gold companies with the intent to provide an investable representative index of publicly-traded international gold companies.
I married an attorney. I know damn well to review everything in a contract… everything.
I don’t care if it’s 200 pages long. My wife is on me like white on rice to review everything – well, before she reviews it a second time to see what I missed. (Ain’t marriage grand?)
So when I heard that there was a broad indemnity in Transocean’s agreement with BP, I went searching.
Sure, I knew BP countered Transocean, saying that Transocean would not be indemnified if it was found to be grossly negligent. But the contractual language used in Article 25.1 says different.
Here’s what it says word for word:
Except to the extent any such obligation is specifically limited to certain causes elsewhere in this contract, the parties intend and agree that the phrase “shall protect, release, defend, indemnify, and hold harmless the indemnified party or parties from and against any and all claims, demands, causes of action, damages, costs, expenses (including reasonable attorneys fees), judgments and awards of any kind or character, without limit and without regard to the cause or causes thereof, including preexisting conditions, whether such conditions be patent or latent, the unseaworthiness of any vessel or vessels (including the drilling unit), breach of representation or warranty, expressed or implied, breach of contract, strict liability, tort, or the negligence of any person or persons, including that of the indemnified party, whether such negligence be sole, joint or concurrent, active, passive or gross or any other theory of legal liability and without regard to whether the claim against the indemnitee is the result of an indemnification agreement with a third party.”
Notice the “without limit and without regard to the cause or causes” line. That line is why RIG should be safe.
BP can say it’s not obligated to indemnify Transocean. But in the end – and I’m no attorney – BP could have a heck of a time protecting itself from the contractual indemnifications, other than from suits brought on by the families of the 11 that died.
That could mean Transocean is in the clear.
And it looks like Wall Street agrees.
Not only did FBR reiterate its Outperform rating with a $70 price target, noting:
We continue to believe that Transocean is oversold, as we estimate the company’s ultimate liability will be far lower than the $6 billion currently priced into the stock. While we are reducing our EPS estimates, due to lower deepwater day rate forecasts, we reiterate our rating and price target since we believe investors will gain increased confidence that the shares are pricing in too much liability risk, particularly given Transocean’s seemingly ironclad indemnification clauses.
Buyers sent the stock up more than $10 last week alone (and handed Options Trading Pit readers a fat 180% gain in mere days).
Better yet, the deepwater moratorium could be lifted earlier than November 30, 2010… if oil companies can show improvement in spill containment and response plans. That alone could rocket shares of RIG.
So, what’s not to love here?
Buy more Transocean (NYSE:RIG)… and hold long-term. This is an $80 stock masquerading under $60.
Stay Ahead of the Curve,
Ian L. Cooper
Wealth Daily
Article from www.energyandcapital.com
On Junior Resource Stocks
Michael Campbell: What does it mean for the junior resource market if that’s the case? (from July 31st interview)
Peter Grandich: Well the junior resource market in my opinion, is probably in one of the worst states it’s been in almost the entire time I’ve been around it. I mean given the fact that where metal prices are compared to where they were, juniors in general are probably performing worse now than in any other time that I can remember in a couple of decades.
And part of that is for the reasons you just mentioned funding is difficult it’s not widespread there’s not a lot of money that’s flowing into this industry. Secondly despite the great increases in the Boolean prices we don’t have the same activity the level of people participated in the junior resource market that we used. So and an important part that a lot of Canadians don’t realize day to day because they are not down here in the US. The US market is all but closed for business for junior resource companies. The ability for an average individual down here to purchase or be solicited to purchase a junior resource stock trading up on the Toronto stock exchange has become almost impossible. So there’s not that market that used to exist where a lot of Americans used to play the junior market are just not doing that anymore. So the, all in all it’s a very tough time for the junior resource market despite still very, very attractive prices.
Michael: Yeah I mean I’ve obviously noticed exactly the same thing in terms of metal pricing, where you’re seeing even senior golds trading significantly below where they were when gold was at 700 – 800 dollars an ounce. Now that Gold is $1150 plus I just have noticed there’s been a reevaluation of that the entire sector from seniors down to juniors in that sphere. And I guess one of the things then that tells me to do is check out the companies back to where we were two years ago. Just saying where is their cash financing gonna going to come from if they are in a developmental stage or what have you? I want to know what kind of cash they have.
Peter: You know I think one of the things in the junior market that’s happened is it’s been a [nutrition] market not only among the players and the companies themselves but even the so called experts within, in that community. And part of the reason is there’s just been very little overall success in the junior market. We have really only one or two area plays and I wouldn’t even call them an area play compared to how they used to be 10 or 20 years ago. Most notably now in the Yukon we don’t have widespread interest the hedge fund industry and funds are closing not opening getting into juniors. And the flow through funding you know is still there in Canada and all but it’s not as big as it used to be. So it doesn’t hold well and we see that. We see companies have great news trade up 10% or 15% on that news and two or three days later, all that gain is evaporated. And I don’t see any significant change in that for the foreseeable future. That’s why despite still being very bullish on precious metals and particularly gold, the junior resource market is still a very tough market. It’s not something you can just buy and be successful cause the overall market’s going up.
Update: On Junior Golds and Junior Silvers
by Jordan Roy-Byrne
I maintain two indices for premium subscribers so that we can better track the junior precious metals sector. These four charts should give you a better idea of the current state of the sector. The first chart shows our junior gold index over the last year. The junior gold index consists of 25 companies, most of which are in the neighborhood of $100-$600 million in market cap. How a billion dollar company is a junior, is beyond me.
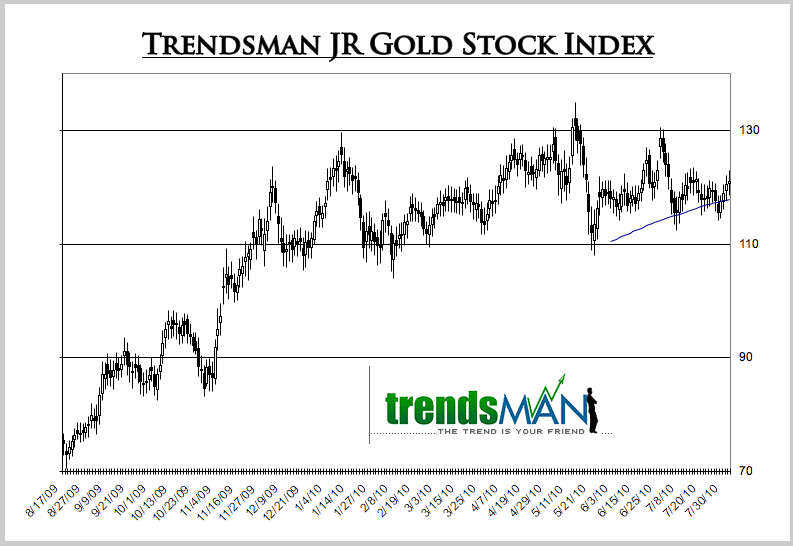
…..read and view more charts HERE
-
I know Mike is a very solid investor and respect his opinions very much. So if he says pay attention to this or that - I will.
~ Dale G.
-
I've started managing my own investments so view Michael's site as a one-stop shop from which to get information and perspectives.
~ Dave E.
-
Michael offers easy reading, honest, common sense information that anyone can use in a practical manner.
~ der_al.
-
A sane voice in a scrambled investment world.
~ Ed R.
Inside Edge Pro Contributors

Greg Weldon

Josef Schachter

Tyler Bollhorn

Ryan Irvine

Paul Beattie

Martin Straith

Patrick Ceresna

Mark Leibovit

James Thorne

Victor Adair