
Daily Updates
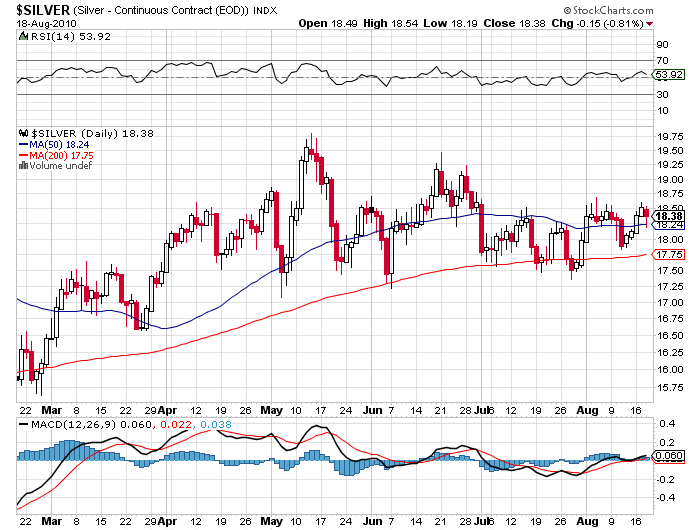
Those transfixed by gold topping the $1,200 level again have been missing the real action in silver. The white metal has soared 24% to $18.46 since the February low, compared to a more modest 15% move for the barbaric relic, an outperformance of 1.6 to one.
I have been a raging bull on silver all year, grabbing you by the lapels and shaking you senseless if you didn’t buy. It is nothing less than owning gold with a turbocharger. Silver gives you a nice double play. Its qualities as a precious metal are giving it a major boost from a weak dollar, always a risk that is out there. It is also an industrial commodity, which unlike gold, is consumed, and therefore gives you a call on the recovering economy.
If you don’t think this move is real, check out the shares of the silver producers. Coeur D Alene Mines (CDE) has rocketed by 444% the 2009 low, while Silver Wheaton (SLW) is up a staggering 893% and Hecla Mining (HL) has soared by 512%. To accumulate .999 fine Silver Eagles or silver bullion, click here.
How long will it take to get to the old high of $50? William Herbert Hunt, who engineered the 1980 squeeze with his brother Nelson with a 100 million ounce long position that last took it that high, could tell you, but only from the grave.
madhedgefundtrader@yahoo.com
The Mad Hedge Fund Trader graduated from the University of California at Los Angeles (UCLA) with a degree in Biochemistry and a minor in Mathematics in 1974. He moved to Tokyo, Japan to join Dai Nana Securities as a research analyst of Japanese companies, becoming fluent in Japanese. In 1976 he was appointed the Tokyo correspondent for The Economist magazine and the Financial Times. For the next seven years he published thousands of articles about the economies, companies, and leaders of every country in Asia. He was one of the first American correspondents to cover China during the cultural revolution. He reported on the American attempt to climb Mount Everest and guerilla wars throughout Southeast Asia. The major figures he interviewed included China’s Premier Deng Xiaoping, Ferdinand Marcos of the Philippines, the UK’s Margaret Thatcher, the PLO’s Yassir Arafat, and of course President Ronald Reagan.
In 1982 the Mad Hedge Fund Trader moved to New York as the US editor of Euromoney magazine. As a member of the White House Press Corps he covered the early years of the Reagan administration. In 1983 he was hired by a top investment bank to build a new division in international equities. In 1985 he was promoted to vice president and transferred to London to head up the sales and trading of Japanese equity derivatives in Europe and the Middle East.
In 1989 the Mad Hedge Fund Trader was appointed a director of the Swiss Bank Corp responsible for its then vast portfolio of Japanese equity derivatives. A year later he left to set up the first ever dedicated international hedge fund, which became a top performer in the industry.
In 1999 the Mad Hedge Fund Trader sold his hedge fund to concentrate on managing his personal investments. He focused on natural gas exploration and development in Texas and Colorado, as well as other commodities. Seeing the incredible inefficiencies and severe mispricing offered by the popping of multiple bubbles during the Great Crash of 2008, and missing the adrenaline of the marketplace, he returned to active hedge fund management.
The Mad Hedge Fund Trader has always devoted his life to understanding global capital markets not because of money he could make there, but because of the limitless intellectual challenge it offered. He created this website to air his iconoclastic, out of consensus, and often radical ideas in public, as well as to vent on the matters of the world at large.
In his free time, the Mad Hedge Fund Trader climbs mountains, does long distance backpacks, practices karate, performs aerobatics in vintage aircraft, collects vintages wines, reads the Japanese classics, and engages in a wide variety of public service and philanthropic activities. Why they call him “mad” he will never understand.
The austerity measures that were supposed to fix Greece’s problems are dragging down the country’s economy. Stores are closing, tax revenues are falling and unemployment has hit an unbelievable 70 percent in some places. Frustrated workers are threatening to strike back.
This dire prognosis comes even despite Athens’ massive efforts to sort out the country’s finances. The government’s draconian austerity measures have managed to reduce the country’s budget deficit by an almost unbelievable 39.7 percent, after previous governments had squandered tax money and falsified statistics for years. The measures have reduced government spending by a total of 10 percent, 4.5 percent more than the EU and International Monetary Fund (IMF) had required.
The problem is that the austerity measures have in the meantime affected every aspect of the country’s economy. Purchasing power is dropping, consumption is taking a nosedive and the number of bankruptcies and unemployed are on the rise. The country’s gross domestic product shrank by 1.5 percent in the second quarter of this year. Tax revenue, desperately needed in order to consolidate the national finances, has dropped off. A mixture of fear, hopelessness and anger is brewing in Greek society.
Unemployment Rates of up to 70 Percent
Unemployment in the city [the shipbuilding district of Perama] hovers between 60 and 70 percent, according to a study conducted by the University of Piraeus. While 77 percent of Greek shipping companies indicate they are satisfied with the quality of work done in Perama, nearly 50 percent still send their ships to be repaired in Turkey, Korea or China. Costs are too high in Greece, they say. The country, they argue, has too much bureaucracy and too many strikes, with labor disputes often delaying delivery times.
Barely any of the country’s industries can keep up with international competition in terms of productivity, and experts expect the country’s gross domestic product to fall by 4 percent over the course of the entire year. Germany, by way of comparison, is hoping for growth of up to 3 percent.
Sales Figures Dropping Everywhere
A short jaunt through Athens’ shopping streets reveals the scale of the decline. Fully a quarter of the store windows on Stadiou Street bear red signs reading “Enoikiazetai” — for rent. The National Confederation of Hellenic Commerce (ESEE) calculates that 17 percent of all shops in Athens have had to file for bankruptcy.
No Way Out
The entire country is in the grip of a depression. Everything seems to be going downhill. The spiral is continuing unabated, and there is no clear way out. The worse part, however, is the fact that hardly anyone still hopes that things will improve one day.
‘Things Are Starting to Simmer’
Menelaos Givalos, a professor of political science at Athens University, has appeared on television, warning viewers that the worst times are still to come. He predicts a large wave of layoffs starting in September, with “extreme social consequences.”
“Everything is getting more expensive, I’m hardly earning any money, and then I’m supposed to pay more taxes to help save the country? How is that supposed to work?” asks Nikos Meletis, the shipbuilder. He predicts the situation will only become more heated. “Things are starting to simmer here,” he says. “And at some point they’re going to explode.”
How Long Can Greece Hold On?
Inquiring minds just might be asking “How long can Greece hold on?”
I do not have the answer to that, besides it’s not the important question. A far more worrisome question is “When does similar strife spread to Spain, Portugal, and perhaps even Italy?”
Part of the blame for this goes to the bailout plan itself. France and to a lesser extent Germany would not take haircuts on Greek debt. Aid to Greece by the IMF and European banks simply threw good money after bad.
The problem did not go away. Instead, terms of the bailout made the situation worse.
Mike “Mish” Shedlock
http://globaleconomicanalysis.blogspot.com
Click Here To Scroll Thru My Recent Post List
Michael Campbell: Welcome back to the show with me Don Vialoux he’s the author of timingthemarket.ca tech talk. Don first of all appreciate you taking the time as I know you’re on vacation. Let’s start with just introducing people exactly what you do, about the style of Technical analysis that you’ve been doing for 37 years.
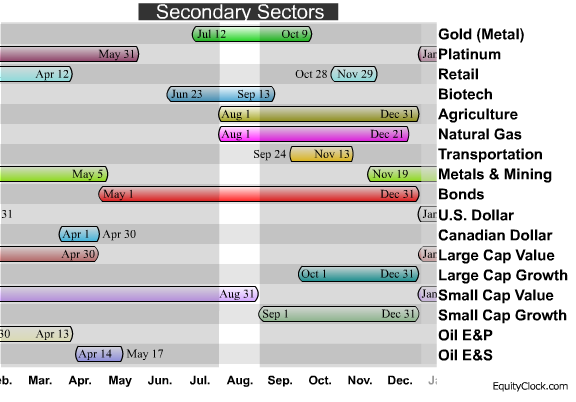
Don Vialoux: What we do is we combine technical analysis fundamental analysis and seasonality analysis to come up with investment recommendations. A good example is right now, right around this time of year there’s a very interesting sector which normally does very, very well and that’s gold.
Michael: Let’s start with seasonality. The seasonality is looking at patterns to find out as an example, 18 of the last 23 Augusts or August/September periods gold has risen. Is that the kind of thing that’s starting with seasonality?
Don: Yes that’s exactly what we do, historically gold equities move higher from July the 27th to September the 25th and that’s been a very consistent pattern for a very long period of time. In fact it’s very interesting no comment came up by Jim Kramer last week on CNBC, that wild guy. He mentioned that the price of gold during the last 17 periods and actually the gold Philadelphia gold index itself has gone up 8.3% per period on average during the last 17 Septembers. So we’re just entering this period when gold normally does very, very well.
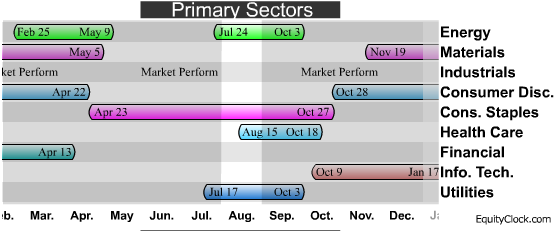
Click on the image or go HERE to view all of the Seasonality Charts.
Michael: Are you making a distinction here between gold bullion prices and gold stock prices or are they basically the same in this movement?
Don: They both [move in] about the same time. The key is you want to be in the sector that has the best relative performance. So right now for example gold stocks are out performing gold. So the preferred strategy this year for gold trade is to go into gold equities as opposed to gold.
Michael: I think what people really enjoy is looking at those historical probabilities, to say that July 27th to September 25th there is normally this kind of movement. How does technical analysis work into your analysis?
Don: Yes we use short term indicators to give us buy and sell signals. So for example this year we had a technical buy signal based on RSI (Relative Strength Index) and moving average convergence divergence. They all came in around the third week in July this year they actually came in slightly earlier than normal.
Michael: Now let me ask you when you look at these segments of the market do you find that some are more attuned to the seasonality analysis and in some segments it’s not as reliable an indicator?
Don: Yeah there are certain sectors which perform better on basis than others. The key is to look at the annual recurring events that trigger the seasonality. And if those annual events are happening then yes you go for it. And in the case of gold for example the annual recurring event is buying of gold to make into jewelry for Christmas and for the Indian diwali season. But this year there’s something different that’s happening which is I think even more important. We’re starting to see people in China buying more gold to make into jewelry than even India which is quite amazing. Historically India has been the biggest buyer of gold for jewelry purposes for many, many years and now we have an extra buyer coming in the market.
Michael: Now let’s come within the individual stocks themselves do you do, do you apply the same analysis to say some of the senior gold stocks I’ll pick a couple maybe a Gold Corp. or Barrick Gold.
Don: That’s a great question because my site timingthemarket.ca focuses on markets and sectors. It turns out there is another site that recently was introduced in February this year that focuses on individual security and that site is equityclock.com. Once again it’s a free site and it’s offered by my son John
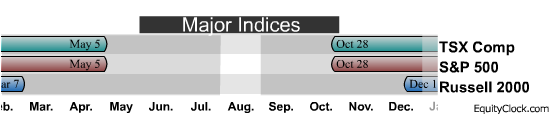
Michael: Let’s start with the big picture which is the overall market itself, maybe the Canadian market or the US market you tell me. Where are we at with those?
Don: Well first of all let me give you a very small bit of both. Next week economic data comes from the US will be slightly positive. So you might get a small bounce next week, however be very careful because historically in a mid term election year like we are in right now US equity markets get hit very hard from approximately the middle of August until the end of September. And there’s good reason to believe that that’s exactly what’s gonna happen again this year. That’s the bad news now let me give you the good news. Historically the bottom of the four year presidential cycle occurs in the fourth quarter of a mid term election year. So looking for a significant weakness we are probably gonna testing the lows that we saw in early July for all the major equity indices between now and let’s say at least the end of September. And after that look for a significant move on the up side in North American equity market.
Michael: Is October a factor? In October 1929 thats when that big crash took place, again in 1987. I can think of 2008 where the real damage was done by about the first week of October.
Don: Well historically the weakest month of the year is the month of September we’re finding out that once more for equity markets. The key is that often the month of October is a very interesting month because you’re right historically you had these big down movements in the month of October itself. The great thing is that historically the month of October is usually the bottom of the annual market moves. And that’s also getting lined up once again this year. Actually the low coming up this fall probably will not happen like it normally does at the end of September. I’m guessing it’s gonna happen a little bit later probably closer to the end of October this year. And there’s a reason for that it has got everything to do with taxes. Yes the Bush tax cuts expire at the end of this year. If you have a capital gain you’re gonna want to take that capital gain before the end of this year which implies significant selling by American investors prior to the end of the year. If you take the capital gain right now you pay a tax of 15%. Next year the tax from that same capital gain could be between 30 and 37%. So huge amounts of selling pressure coming into US markets just for tax purposes alone late this year, probably bottoming sometime in October.
Michael: Yeah I’m really glad you’ve brought this factor up because I’ve felt for the better part of this year that this is going to be a huge overhang in the market because the differences are so significant if those tax cuts just get allowed to expire. You’ve just outlined that in dividends or on capital gains there’s a huge change coming that really is going to motivate people to get out of the market. That’s a great example of how you said right at the outset you take seasonality you take technical analysis and then you mixed in the fundamentals. That’s a great example of the fundamental you know giving credence to what your seasonality tells you.
Don: Exactly
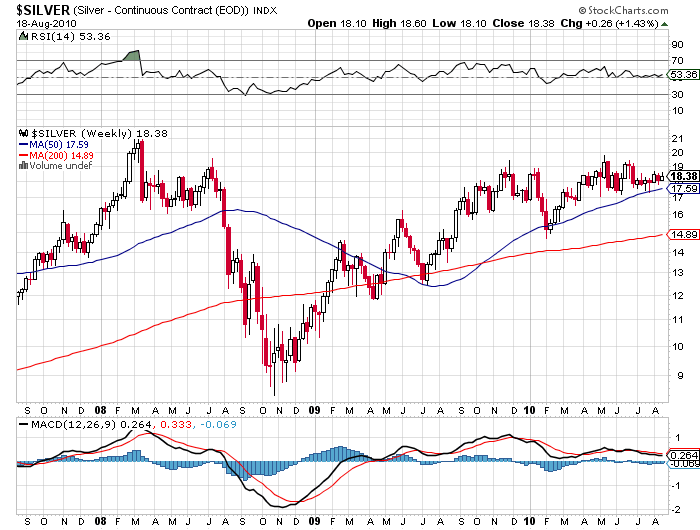
Michael: I just want to fire a whole bunch of sectors at you. We’ve just talked about gold what about seasonalities for silver before we leave those two?
Don: Yeah silver is slightly different than gold. It’s more of an economic commodity; its tendency is to strengthen from October to March of each year. But it clearly does benefit from strength in gold equities late in the year as well. It’s a little bit early to play the silver, silver has actually been significantly under performing gold during the last few weeks because it’s more of an economic commodity as opposed to a monetary commodity.
Michael: Let me go down to oil. We’ve had a little bit of a correction in the last week 10 days. What’s the seasonality for oil?
Don: Well actually oil’s kind of a mixed seasonality at this point in time of the year. It turns out another commodity related to it has a period of seasonal strength coming in around the end of August and that’s natural gas. Natural gas tends to respond late in August to hurricane season. We still have hurricanes around that time of the year and that tends to be the time when we get a boost in demand for natural gas because of concerns of what’s going to happen for hurricanes going into the gulf. We’re a little bit early to that trade yet but stay tuned it looks like a very interesting one. Historically natural gas prices do move higher right from usually say middle of August to the end of August right through until the end of December.
Michael: Has natural gas been a very reliable pattern?
Don: Yes it has. It is the most volatile of all the commodities so be very careful when you may go into the trade and when you come out of it.
Michael: Let me just go to the Canadian dollar right now.
Don: The Canadian dollar is kind of mixed right now. Actually if you’re looking at sectors which are of interest right now consider two that’s agriculture and technology. Those are a couple of areas to be of focus on right now.
Michael: Tell me a little bit more about agriculture.
Don: The periods of seasonal strength are between the beginning of August until the end of December. The reason for that is farmers receive their revenues in the second half when they receive funds from selling their grains. Right near the end of the year the farmers have to make some choices. At that point in time they have revenues at a certain level they have expenses at a certain level in between there’s tax flow income. Right near the end of the year farmers say okay I want to reduce my tax flow income so then they go out and buy a whole bunch of fertilizer or a John Deer tractor. And that result is that faith in the agricultural sector tends to peak right around the end of the year. And this year is looking like a banner year because grain prices are moving sharply higher that’s helping a lot.
Michael: So this is the entry point is right around this month?
Don: Actually it happened a little bit earlier than normal this year. The entry point occurred right around the third week in July. The sector on a short term basis is slightly over bought and you may want to wait for a little bit of weakness over the next week or two. But the sector does look very, very strong right through until the end of this year. Lots of reasons for it grain prices are moving strongly higher because of concerns about crops in quite a few countries. You see what’s happening in Russia, they are having a hard time over there. We saw what happened in western Canada a lot of the crops were wiped out by flooding. We’ve seen flooding in China and Pakistan. Meanwhile we are starting to hear about droughts in Western Australia and also Argentina. This is all good news for farmers in the US. And they are going to benefit from higher grain prices going forward. That means they’ll be buying a lot more fertilizer and a lot more John Deer tractors.
Michael: Lets come to the technology side that you mentioned. Is there a more specific idea within the technology side as there are so many aspects of technology?
Don: Yes the key is that right around from October the 9th on average right through until January the 17th the whole sector goes higher. It has a lot to do with people buying consumer electronic goods for Christmas. Now what happens is that there is a lot of buzz at that time for on these new technologies coming to market. And that causes stocks related to those consumer electronic goods to move significantly higher. A good example last year we had the introduction of Windows 7 of the newest edition of Office. At that time we had the iPhone 3 we had the latest Blackberry. So last year was a very good time to do this trade. This year looks even better because we have the iPhone 4 we have the iPad we have the latest Blackberry coming to market. There is 3D television and all kinds of really good and interesting technologies coming to market this fall. So the trade is getting lined up, it’s not there yet as we’re not into October but stay tuned to our sites timingthemarket.ca and equityclock.com and we’ll try to give you an idea on when to enter this trade.
Michael: That’s such a great example of how fascinating this work is. You look back to see if historically has there been a period of time when it’s been better to to buy or sell then you look at the technical side, relative strength etc. Then you look for a fundamental reason, that iPad or iPhone 4, the new RIM cell phone is coming out. The Kindle is a big success you know the new latest version of Kindle coming out of Amazon which is their biggest seller. There is just such a long list.
Don: Exactly something very important though when you’re looking at the technology sector. Notice that I said that January 17th historically is the time that the period of seasonal strength ends and that’s because of a very important event that happens every year that’ s when the Las Vegas consumer electronic show occurs in the second week in January. And that’s when all the technology companies introduce their products for the next Christmas. That’s the last of the good news so that’swhen you take your profits.
Michael: Any other sectors that jump out at you?
Don: Yes actually there is a couple of sectors one in particular transportation this is a sector which has been hot this year and now we’re starting to hear that the economies in the world in particular the United States are starting to show of slower growth. And that means that, the big premium that we’ve seen in transportations stocks is probably going to start coming out of the market. So look for the transportation sector to significantly under perform the market. It’s a good one to get out of right now historically the sectors would lower from approximately the second week in August right to until the end of September.
Michael: Okay. I guess the trouble is Don when I’m talking I’m always making notes at the same time I’m using this advice personally. Alright Don it’s always a pleasure to talk with you and we appreciate so much that you take time and I know you’re on vacation right now I hope the weather stays beautiful as it is and we’ll talk to you in early in the fall I hope.
Don: Thanks Michael.
Technical Analysis by the highly respected Don Vialoux of Timing the Market CLICK HERE for his full Report every day incuding Charts.
Don Vialoux has 37 years of experience in the Investment Industry. He is a past president of the Canadian Society of Technical Analysts (www.csta.org) and a former technical analyst at RBC Investments. Don earned his Chartered Market Technician (CMT) designation from the Market Technician Association in 1995. His CMT paper entitled “Seasonality in Canadian Equity Markets” was published in the Spring-Summer 1996 edition of the MTA Journal. Don also has extensive experience with Exchange Traded Funds (also know as Index Participation Units) as well as conservative option strategies. In 1990 he wrote a report that was released in the International Federation of Technical Analyst Journal entitled “Profiting from a Combination of Technical and Fundamental Analysis”. The report introduced ” The Eight Phases of the Stock Market Cycle”, an investment concept that continues to identify profitable entry and exit points for North American equity markets. He is currently a member of the Toronto Society of Fundamental Analyst’s Derivatives Committee. Now he is the author of a daily letter on equity markets available free on the internet. The reports can be accessed daily right here at www.dvtechtalk.com.
There Are Less Than 40 of These Companies… But They Pay 12%
I’ve mentioned before that I often go off the beaten path to find the best income investments in High-Yield Investing and High-Yield International. These days you have to — remember that the common stocks in the S&P 500 yield only 2% on average.
Luckily, there is an entire world of securities created with income investors in mind. You just have to know where to look.
Case in point: I’ve been tracking a rare breed of company — there are only about three dozen of them on the market. But these rare securities pay hefty yields, with a few exceeding 12%.
These companies are the 21st century version of venture capital funds. You’ve heard of venture capital — it generated a lot of press (and billions of dollars) during the tech bubble. These companies invested in start-ups like Google and Amazon, and made millionaires out of many of their investors.
But the venture capital world has historically been closed to all but the very wealthy. And it certainly hasn’t thrown off high yields for average investors. That’s until this new kind of income investment came to light. Now investors can invest just like venture capitalists — putting money into small companies off-limits to most — while being paid double-digit yields. And they can do it by easily buying and selling shares on the NYSE.
This comes thanks to business development companies — or BDCs for short — which make loans to small companies, often taking an equity stake as well. Most importantly, BDCs pass along the income earned from these investments, allowing them to pay great yields for aggressive investors — many currently yield 8-11% and a few are yielding 12% or more.
Yields are powered by the high-interest loans BDCs offer the companies they invest in. But yields are also given a boost because BDCs enjoy a tax-advantaged status. They pay nothing in income taxes as long as they distribute at least 90% of taxable income to investors. Dividends are paid at least quarterly and some even pay monthly.
But business development companies have been around for a while now, so why am I bringing them up?
To complement their high yields, BDCs look to be in a “sweet spot.”
Right now, conventional lenders have tightened up lending, leaving many companies with few options to fund growth. BDCs are one of the few sources of financing available for these businesses; a captive market is good for business.
But as I said above, these yields are for aggressive investors as investing in small companies (especially in a soft economy) can be risky. During the height of the recession, several BDCs were forced to cut distributions to investors.
To offset their investment risk, BDCs don’t invest in just any company — the best BDCs use their expertise to be highly selective. They find undervalued businesses with strong potential and guide their growth by taking seats on their boards and providing consulting advice.
These BDCs also manage risk by holding the bulk of their assets in debt securities. That way, if a company it invests in goes south, the BDC stands a better chance of being paid for its investment compared to an equity stake. BDCs further diversify their risk by owning stakes in many companies at once. The typical BDC spreads the risk across 50 or more different companies and 20 different industries.
With their diversified portfolios (and currently low borrowing rates), I expect select BDCs to continue to be a solid — albeit still volatile — place to earn a strong yield… if the economy can at least tread water.
Good Investing!
Read more about Dividends Higher Yields = Higher Safety, Too
Carla Pasternak’s Dividend Opportunities
P.S. — I recently selected one particular business development company as my August “High-Yield Security of the Month” in High-Yield Investing. This pick delivers a 12.4% yield and have gained roughly +30% so far this year. Learn more about this idea here.
Mining is a risky business and accidents happen. But when your mine is the world’s largest uranium deposit, fourth largest copper deposit, and fifth largest gold deposit, an accident can cost a little bit more than the average. Something BHP Billiton found out after the shaft accident at its flagship Olympic Dam mine located 560 kilometers north of Adelaide, South Australia.
In October of last year, a breakdown of one of two haulage systems saw a loaded iron skip plummeting to the bottom of the 800-meter-deep main shaft. It caused enough damage to the inside of the shaft, and to the gears and the wheels that bring the ore to the surface, that it took nine months to repair.
So much does it actually cost when production is halted at a mine that’s clearly won the geological lottery?
BHP Billiton revealed on July 21 that annual copper production was down 11% in 2010, uranium production off by 43%, and gold production was 19% below the normal. The amount of material mined in fiscal 2010 was 5.3 million tons, down 9.8 million tons from last year.
The mine has, according to the company, returned to full production now. There is however, the small problem of contracts. One of BHP’s largest clients is China, the country whose energy appetite just can’t get enough. The country that will be buying up to 5,000 metric tons of uranium this year.
The Olympic Dam mine produces 7% of the world’s uranium, production that was affected by the shutdown. While production is getting back on track today, the feeling in the BHP boardroom is one of unease.
The reason: the rise in the number of new nuclear power stations coming online in the next few years, along with all the contracts that need to be fulfilled. Expansion plans are in the works already. BHP is looking to massively increase the size of the mine and has handed in a 4,000-page environmental impact statement (EIS) draft to the Australian government.
The sticking point is, they’re going to have to go deeper, and it’s going to get a lot more expensive. The Australian government isn’t going to turn away from the opportunity to tax this goldmine either. And if the problems of additional cost aren’t enough, the rail system in Australia can’t handle moving that much ore at all times, so tack on some more delays.
Unsurprisingly, BHP is out scouting the market for some good deals on uranium. Top on their list is Saskatchewan, Canada.
Why Canada Is 45 Times Better Than the U.S.
The uranium deposits in Saskatchewan aren’t just significantly large; they’re also the highest-quality uranium known on the planet. The ore mined at MacArthur River has an average ore grade of 21%— average ore grades are given as a percentage of uranium oxide in the ore.
Just to compare, the uranium found in the U.S. is usually around 0.4– 0.5%. That makes the Athabasca Basin uranium 45 times higher-grade.
The uranium deposit at MacArthur River can be visualized as a few school busses parked within a school football field. It might sound small, but in uranium-speak, that deposit’s big! It’s big because the grades are incredible in the Athabasca Basin. And that makes it huge financially.
Canada also ensures that the uranium it sells is used solely for electricity generation at nuclear power plants. The end use is very strictly enforced through an assortment of international non-proliferation treaties and Canadian export restrictions. In fact, uranium on a per-ton basis is worth more than gold if you’re in the Athabasca Basin. Given current uranium spot prices, it can fetch a staggering US$13,500 per ton. That’s unheard of!
BHP Takes a Whole Building in Saskatoon
After meeting with many uranium executives, one can’t help but notice the large BHP building off 3rd Avenue while walking around Saskatoon. It’s not just the potash and diamonds that BHP cares about in Saskatchewan. The quantity of uranium underneath the Athabasca Basin is almost beyond reckoning. It can provide substantial wealth to the right company and the right investor.
If BHP decides to enter the uranium sector in Saskatchewan, which companies are on their short list?
That’s exactly what I was finding out while wandering the prairies.
Ed Note: For Uranium Mining Companies Listed in Canada go HERE
If you want to know which juniors are the most likely to be taken over by uranium-hungry BHP, you’ll find out soon in Casey’s Energy Report. After Marin has done his due diligence, he’ll emerge with a few handpicked small-cap companies that show the greatest potential to provide investors with handsome returns. Take your 3-month risk-free trial now and get in early when Marin gives the starter shot. Learn more here.
-
I know Mike is a very solid investor and respect his opinions very much. So if he says pay attention to this or that - I will.
~ Dale G.
-
I've started managing my own investments so view Michael's site as a one-stop shop from which to get information and perspectives.
~ Dave E.
-
Michael offers easy reading, honest, common sense information that anyone can use in a practical manner.
~ der_al.
-
A sane voice in a scrambled investment world.
~ Ed R.
Inside Edge Pro Contributors

Greg Weldon

Josef Schachter

Tyler Bollhorn

Ryan Irvine

Paul Beattie

Martin Straith

Patrick Ceresna

Mark Leibovit

James Thorne

Victor Adair