
Uncategorized
Real estate is heavily scewed to work UPFRONT: educate yourself, find the area, find the micro-location in a city, find a property, negotiate a deal, find a decent mortgage broker, find a decent lawyer, find an accountant, get the mortgage, find a property manager, do the right initial improvements, find JV partners .. MOST WORK IS UPFRONT (90% or so) .. but then it is downhill form there !
Similar to an airplane: 90% of the fuel is burned on the first few kilometers to get it to 30,000 ft .. then soaring / gliding for the next 1000 km .. then a bit more work / fuel for landing !
Some properties provide thousands of dollars per month cash-flow plus mortgage paydown plus at least some inflationary appreciation .. with perhaps 1-2h / month now .. but most of the heavy lifting happened 4-6 years ago !!
You reap what you sow !!
So, sow away big time now .. and reap lots later !!!
The article above courtesy of Prestigious Properties President Thomas Beyer.
There are really only five ways to generate your own cash for a real estate transaction .. and you can do all five in time .. but you have to take them all seriously !
1) You work
This is the most common way to start. You work, i.e. you exchange your time for money. The more time you give, the more money you get. A pretty linear relationship. Proven though through centuries !
Many people fail at that stage already. They don’t take it seriously. They show up late. They chat with friends online. They do personal business on the side. They don’t understand the business they’re in. They don’t give 110%. Maybe 50% or 85% .. or 35%.
Yes, you can hide for a few days or a few weeks. Most employers realize after a while who is an excellent performer and who isn’t. If you work hard at your job, you get ahead. Give the extra 10% or the extra 4-5 hours every week. Read up on your industry. Go to industry conferences. Seek a mentor. You get promoted. You get more $s per hour. If you have more skills, you get more $s. So, yes, formal and informal education helps. If you work hard, and get more $s than you spend, you can save some $s. Hence:
2) You invest your own $s.
You buy real estate or mutual funds or stocks or GICs or bonds or whatever seems to fit your risk tolerance, skills and timeline. Like 1) it takes time to find out what a good investment looks like. Take it seriously. This investment could be more passive (say a stock or mutual fund) or more active (say real estate or active stock trading)
3) You invest other people’s money.
Once you’ve mastered 2) you have the right to ask for OPM (other people’s money) such as JV partners or money partners or mortgages or lines-of-credit to invest, for example in real estate: Usually a combination of your own time, your own money and OPM (mortgage, LOC, JV money or all 3). You borrow money at, say 6%, and invest it for 12% to 150% ! This assume a modest degree of risk as you must pay the rate your agreed with OPM but invest at a more uncertain, yet frequently much higher rate. This assume 1) and 2) is in ship-shape ! If you invest other people’s money you take a fee or a percentage of the profit – upfront, as you go along and/or at the end of the venture.
4) You use other people’s time / employ other people
You have a small or large business where you pay people a wage/salary/hourly wage and then use their time to make money for yourself. This works usually only if you’re good at 1) 2) and 3) as usually your have to work hard too to lead by example and have some (of your own or other folks’) money at risk.
5) You have Intellectual property (IP)
Intellectual property or royalties make money for you once you have created them: maybe you have written a book. Maybe you have written lyrics or songs or music. Maybe you have painted a picture and it is copied widely for a fee. Maybe you have invented a name and copyrighted it. Maybe you have a patent or a system that can be used for a fee. Elton John makes money in his sleep today – but he was very good at 1) in the beginning of his career.
So, there you have it in a nut shell: 5 ways to make money. Are you aiming to fire on 5 cylinders ? Or is it only 1/2 ? Try harder .. or try different ways .. but usually they go in that order of: 1, 2, 3, 4 5 ..
The article above courtesy of Prestigious Properties President Thomas Beyer.
For rent for Olympics: Two-bedroom suite at EnglishBay, short taxi ride or leisurely stroll to some major Vancouver 2010 Olympic sites. $800 per night. Olympic pad: Whistler chalet, three bdrms, hot tub. $30,000 for month of February 2010.
The samples above, captured online last month, give an indication of the potential income for Vancouver and Whistler homeowners willing and able to rent out all or some of their property during the 2010 Vancouver Olympics and Paralympic Games, held February 12 to 28, 2010.
If you are planning to rent a suite or room for the games, you should be organizing right now. In February, NBC and CTV began heavily promoting Vancouver Olympics TV coverage, which should start the phones ringing for visitor accommodation.
Some of the 5,500 Olympic athletes, or their teams, will rent out private homes close to venues to escape the distraction of the Olympic village, while international media crews will need large houses or apartments. Most of these bookings will already have been made, or will be firmed up shortly, but visitor accommodations will be booked over the next year, likely right up to the opening ceremonies.
Average asking rent: $915 per night !
The average Olympic rental in the Vancouver area is a two-bedroom suite, and the average asking rental rate is $915 per night. Homes with more than four bedrooms show an average rent of $1,248 per night, according to Mark Szekely, who surveyed nearly 200 listings on his rent2010.net web page. In Whistler, the average asking rental rate, by bedroom, is $478 per day. Multiply by the 16 days of the Games, and you can see it can be worthwhile renting out the home, or at least a room or two.
Unlike in Salt Lake City, the last winter Olympics held in North America, there is no official rental program set up to list or monitor private rental accommodation for the 2010 Olympics.
Since there is no official Olympic visitor rental site, it is hard to know whether potential landlords are achieving the rents asked, says Bob Mackie, 2010 Olympic columnist for Business in Vancouver.
Mackie says there is a concern in the Olympic community that if rents appear too high, some visitors may forego the games. “But there will be no way of knowing until the Olympics actually start.”
The best advice could be to offer your Olympic rental at below the average asking rate to generate increased interest. Szekely recommends setting up a permanent listing on paid sites, such as rent210.net, with photos and information, and using the free Craigslist to direct traffic to it.
CHECK LOCAL BYLAWS
If you are planning on adding a rental suite to your home in time for the Olympics, be sure you are within local bylaws. At Whistler, the municipality has eased regulations to allow short-term rentals of commercial property to accommodate VANOC staff, but there is no plan to allow private homeowners to rent out their property nightly for Olympic visitors. Currently, such private rentals are restricted to a 60-day minimum.
In Vancouver, secondary suites in private homes have been allowed since 2004, and there are no restrictions on nightly rentals, but it may be wise to warn your neighbours.
Based on a look at properties being listed for rent, through sites such as 2010destinationplanner.com and craigslist.org, the selection extends right across Greater Vancouver, and includes condominiums, complete houses, single rooms, and self-contained rental suites in private houses.
The potential of making $10,000 to $30,000 in rental income during the Olympics may be impetus enough for local homeowners to go ahead with a rental suite in their home. As a ballpark, you could expect from $100 to $150 per square foot to add a rental suite in a basement, and even more for upscale finishing. Remember also, that the Olympic short-term rental will have to be offered fully furnished.
Renovating a primary residence to add a rental suite is a good way of boosting the resale value, adding value on which you don’t have to pay capital gains tax. Moreover, if you derive rental income from the renovated property, you may be eligible for a variety of tax deductions that will accelerate the return you see from the property.
Some of you may even be thinking of renting out your boat. Well, you can’t – at least not at the Coal Harbor Marina – you can have guests but you need to be there too.
The Olympics may have not driven up real estate prices … but they sure have an effect on rentals.
Article contributed by Ozzie Jurock
Benefits of Cash-Flow Real Estate in General
How profitable is real estate? VERY!
The following chart shows the overview of historical returns of stocks versus real estate. As you can see, un-leveraged real estate has outperformed the stock market for over 5 years and 50% leveraged real estate has outperformed the stock market over any period – including down markets.
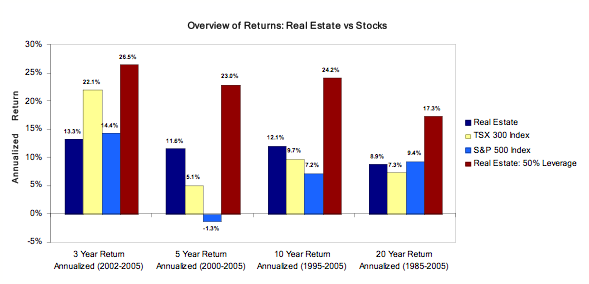
The benefits of cash-flow rental real estate assets in your portfolio are very evident from the historical returns of such assets when compared to other capital gain assets such as stocks. Like stocks, real estate goes in cycles, and therefore you want to buy in an upswing or emerging market, in an area where people move to, where income is strong and rents are going up or at least, are steady. Many US states are such markets as of 2008, despite all the negative press about falling US house prices. When house prices fall, even more people chose to rent, benefitting you, the (future) landlord or co-owner of an apartment building.
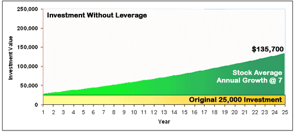
Here are some assumptions we made to calculate the yields in the following pages: Annual return for stocks is 7% and annual appreciation of real estate is 3%. If the rate of growth is less for real estate, why is a $25,000 investment worth more after 25 years?
Real Estate is a Leveraged Investment
While a bank would usually not put up 75% of the cost for an investment in stocks, bonds or mutual funds, a bank will provide 75% of the cost for an investment property, or even up to 85% if it is CMHC insured.
Banks do not like to take risks, hence they consider a leveraged stock investment to be risky.
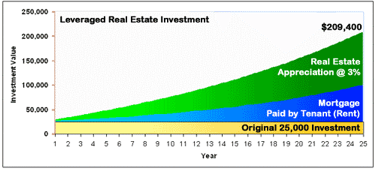
This picture assumes a cash investment of $25,000 for a $100,000 property (for example a condo) and an annual appreciation of 3%. As you can see, in 25 years the property is worth over $200,000 and is still providing monthly income! You have increased your investment 8-fold. Even in the worst case scenario of flat real estate, you have an asset worth 4-fold, which you own 100% and which is still providing monthly income. Even if the real estate drops 50% in value (extremely unlikely) you have doubled your money.
Well-researched leveraged real estate investments, on the other hand, are not considered to be as risky because they are secured by real property – hence the name “real” estate – unlike stocks which often use factors like P/E ratios or projected future earnings to arrive at some share price. Remember ENRON ? They hid details about their debts in so called SPEs (Special Purpose Entity) to show higher profit. How about WorldCom ? Martha Stewart rings a bell ? Conrad Black and Hollinger International ? Go for “real” assets with real value where real people pay real dollars every month, in every economy.
The Benefits of a Leveraged Real Estate Investment
An investment in stocks, bonds or mutual funds will buy the equivalent amount of equities. In other words, $50,000 buys $50,000 of equities, unless you buy on margin. A leveraged real estate investment buys real estate worth many times the down payment. A property worth $100,000 can be purchased with $25,000 down payment – or less if it is CMHC insured. You benefit from growth of the property total value, not just the original investment, which multiplies your returns.
The principal of the mortgage is paid down by your tenant who – over time – essentially buys the investment for you.
Calculating Real Estate Returns
Unlike a stock where the only measurement of a return is the price increase of the equity (see chart above), there are 3 to 4 factors which contribute to the overall return in a real estate investment. They are:
- Property Appreciation (the green area) – often the largest return on a long term hold asset which is held with the intention of producing rental income like our LPs. This appreciation is tax free, until sold, like an RRSP, and then it is usually treated as capital gains which is taxed at only 50% of regular income – or it is taxed as a dividend if held in a corporation or in a US corporation as a non-US resident !
- Principal Reduction of Mortgage (the blue area) adds to the equity but is paid by the tenant in the form of rent.
- Positive cash flow could be negative to very positive or even substantial in Prestigious Properties investments – especially in the latter years ! Normally, you want to have positive cash flow from day one but often we re-invest all the cash flow into the building in the first 9 to 15 months after acquisition to improve the building, and thus the value one to three years down the road.
- Possibly, tax losses in year one or two of a venture. This figure is usually 0 in a joint venture, but could be a small amount in a limited partnership scenario (don’t invest in a venture where the key benefit is a tax loss! Always, always treat a possible tax loss as a bonus and don’t include in your calculations).
In a Real Estate Investment:
- Your tenant or tenants pay down the mortgage which increases your return and essentially buys the investment for you.
- Each time your mortgage is reduced, your investment return increases.
- There is usually an initially small, later larger amount of money remaining each month even after mortgage and other expenses are covered (note this is usually taxable as income !).
- This money also contributes to your overall return.
- Even though you’ve only put up a portion of the cost of the entire investment, you benefit from the entire growth of the property value.
Income Streams from Real Estate
Once the principal on your investment is paid, or even well before it is paid off in its entirety, the monthly rental payments from your tenant become monthly income for you.
- Rent generally doubles in Canada or US growth markets every 15 years (this is over 4% annually – more than the 3% real estate growth we have assumed earlier !).
- Rental income is a great way to hedge against inflation as it increases with inflation, and in most cases at a quicker pace – important in the future as US or Canadian interest rates and thus inflation may rise in the latter half of this decade
- Owning 5 or 6 properties, or a share in a Real Estate Limited Partnership, can generate a substantial monthly income that will continue to increase with your life expectancy.
- The property is managed for you – there are no property management hassles (this is a major reason why many people shy away from real estate investments)—we make it easy for you!
- The key is POSTITIVE CASH FLOW: more money comes in than flows out! This is not possible in many parts of the world because prices are so high that rental properties don’t make sense unless purchased with very large down payments such that ROI’s get smaller and smaller.
Calculating Stock Returns
Unlike real estate, the only measurement of return on most stocks is when its price goes up (see chart). To generate income from a stock or mutual fund, the investment must be sold, unless it is a dividend rich stock.
Real estate produces income each and every month while at the same time the mortgage is usually paid down while the value of the property usually increases – and it is inflation proof – and it is a good investment even if the economy is flat or declining – there is always a demand !
Where to buy .. and where not to
Like a farmer, we also have different seasons for investing. Obviously, a season is usually longer than a year – sometimes a decade or two.
1) Real Estate Winter – time to study the markets, do your research and wait for the buy signals.
2) Real Estate Spring – this is when the fundamentals start to look strong and prices are poised to increase. This is when we buy property.
3) Real Estate Summer – the fundamentals continue to look strong. This is when we hold and improve our properties.
4) Real Estate Fall – the fundamentals show the value growth is slowing down. This is the time to sell many properties and prepare other properties for winter.

Profit Potential: Enormous with prudent leverage !
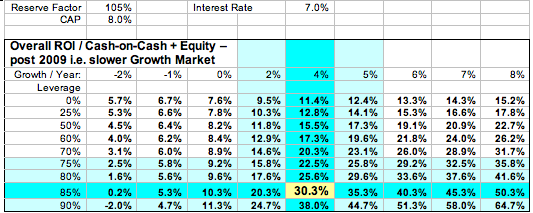
Over the last 6-7 years, Properties that have been acquired in Alberta or Saskatchewan with high leverage in areas of high growth have yielded great returns. As you can see in the chart below, with leverage of 85% and growth at 8-15% per year have been able to consistently provide cash-on-cash returns well above 40% to 60% PER YEAR. Neither AB nor SK apartment building values will not likely grow at 8-15% per year going forward, but still a respectable 4-6% and with property values much higher in AB or SK, we are now only able to purchase buildings with 50% to 60% leverage. Since we require more cash to close (less leverage), the ROI and cash-on-cash ROI will be lower than in previous years!

As shown in the chart below, even with higher interest rates, higher CAP rates and more moderated medium growth in select slower growth markets one can are deliver a higher cash-on-cash ROI investing in buildings with high leverage. Investing in these areas also provides us with better cash flow – an important element when holding longer term !!
Investment Approach – How to select properties for very high cash-on-cash returns
Locate under-managed, under-valued properties in growth areas of promising cities or emerging markets in North-America. With this mind, we use the following four steps to evaluate, then select and improve prospective investment properties:
1) Macro-Location: Markets with Declining Vacancies and Rent Growth – sometimes even CAP rate compression. As home ownership becomes less affordable, or foreclosures increase (as in many US markets) demand increases for rental housing. This in turns decreases vacancies, increases rents and increases values in select markets such as SK, CO, AZ, TX .. even some ON markets .. see chart on page 10 above ! Until recently, rent growth, declining vacancies and CAP rate compression was attainable in Alberta. However, with vacancies and CAP rates as low as they will likely go, CAP rate compression and high leverage with positive cash flow are no longer possible, only very slight rent growth is attainable. Hence, re-finance and hold most of your AB or SK properties and focus on new areas that meet these three criteria such as select pockets in Saskatchewan, B.C., ON, CO, AZ and Texas.
2) Micro-Location: Property Under-Valued with Upside (class “C” building in class “B” location). Buy in sub-markets that are desirable to live in. Would we personally live in that location? Would my daughter live here? Is this an area of positive transition ? Are there transportation improvements coming? Is there a Starbucks, a shopping centre, a desirable school or a park nearby ? Is this an area where “average” people want to live in?
3) Property Upgrades: In addition to buying in desirable sub-markets of growth markets, also improve the properties with appropriate spending. Look for assets that have higher than normal vacancies when you purchase, due to management neglect or poor spending by the previous owner. We then apply better management and marketing techniques (which cost relatively little) and also apply prudent spending as depicted earlier on page 6. The spending varies from inexpensive (like paint, clean-up, a new sign or cutting the grass) to full renovations in-suite or on common areas like hallways or exteriors – depending on the project.
4) Positive Cash-Flow with High Leverage (which is a function of going in CAP rate and debt coverage). Over the last few years in Alberta or Saskatchewan, investors have been able to create positive cash flow with a high leverage mortgage (i.e. typically 80 to 85% loan-to-value). With real estate prices so high in AB and now SK relative to rents, it is very difficult (even impossible) to find these types of properties. In select pockets of Canadian or US growth markets, you can still find these buildings!
Using these proven four approaches, you can repeatedly deliver high double digit to often triple digit returns on the cash invested .
Why Invest in Apartment Buildings (and not shopping centers or office towers)
1) High ratio and inexpensive financing (up to 80% loan-to-value is available).
2) Given strong in-migration, high house prices and rising interest rates there is substantial demand for affordable rental properties.
3) Like many urban areas of Central Canada, Coastal USA, or Europe, renting is the economic choice once ownership costs like utilities, condo fees, and/or mortgage payments are beyond the reach of the average blue collar worker, senior or college student.
4) Major infrastructure projects, new factories and expanding businesses/colleges are luring workers, students and seniors alike in SK, CO, AZ and TX with plenty of job opportunities, decent wages, low taxes and affordable rents.
5) The multi-family rental investment market trades well below replacement cost.
6) Without cash-flow, a real estate investment is more risky (such as development deals, international vacation properties, condo conversions, and land development deals). Go for boring, stable, predictable 15-20% annuallized returns for a long, long time. True wealth is created through long term asset ownership, not through speculative flips. Yes, in 2020 or 2030 we still have renters, and guess what: rents will likely be much higher than today!
The article above courtesy of Prestigious Properties President Thomas Beyer.
Stockscores Trading Challenge
The Stockscores Trading Challenge is an engaging and educational way to participate in the stock market without risking your capital. Use it to develop your trading skills, develop new strategies and test your market acumen. The Stockscores Trading challenges lets you see how your trading skills compare to the community of Stockscores traders.
It is important to know that the Stockscores Trading Challenge is a stock picking game. Each trade that you make will earn a TradeScore and the individual TradeScores are compiled to create your ranking in the game. This means you can join the game at any time and still have the potential to be on the Leaderboard.
We encourage you to view these short videos which explain how to play the Stockscores Trading Challenge and to understand how the TradeScores and rankings are calculated.
LINK TO INTRO VIDEO and LINK TO UNDERSTANDING THE TRADESCORE VIDEO (coming soon)
How to Play the Stockscores Trading Challenge
Overview
The Stockscores Trading Challenge is a stock picking game. It does not consider overall portfolio performance but instead, rates the quality of your trades based on reward gained for risk taken, percentage return and hold period.
The game is designed to be ongoing; a player who joins six months after another is not at a disadvantage. It is your most recent 30 trades that determine your ranking in the Challenge.
To play the game you simply need to make simulated trades using the Trade Ticket which is accessed from the Make Your Trade tab on the menu bar.
This game requires that you use stop loss points for every trade. You can put the stop loss at what ever price you like but where you place it will have a significant effect on your TradeScore. Set your stop too tight and you might get taken out before the stock makes its move. Set the stop too wide and you lose valuable points in the calculation of your TradeScore. See the “Measuring Performance” area of this How to Play description for more on how the TradeScores are calculated.
Practicing in the Trading Sandbox
We strongly suggest that you practice before you play the Stockscores Trading Challenge. When placing a simulated trade, you have the choice to make that trade in the Trading Sandbox by selecting it from the pull down menu on the Trade Ticket.
Trades made in the Trading Sandbox are tracked for your own purposes but they are not included in the actual trading challenge that you are participating in.
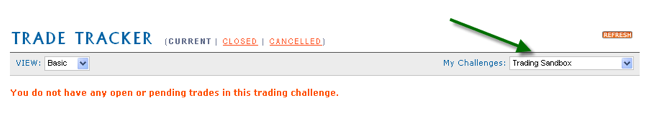
You can see the practice trades you make in the Trade Tracker by selecting the Trading Sandbox from the pull down menu shown below:
Entering a Trade
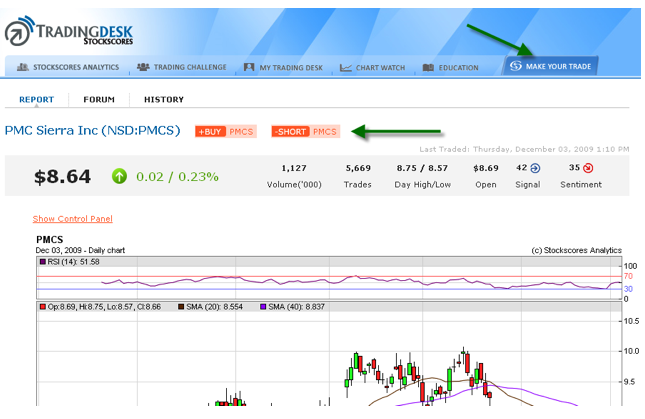
All trades for the Stockscores Trading Challenge are made through the Trade Ticket. This can be accessed from the Make Your Trade tab in the menu bar or from a Stock Report.
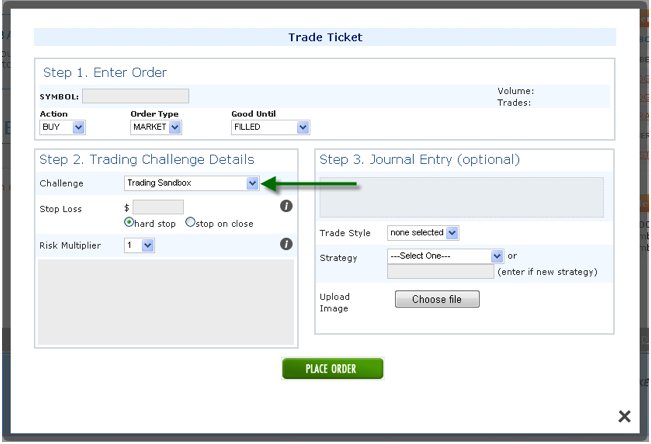
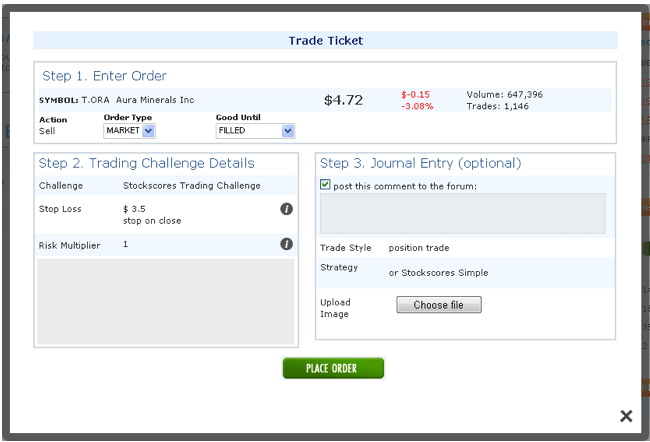
The Trade Ticket
This is the Trade Ticket. You will use this to make any trade in a Trading Challenge or the Trading Sandbox.
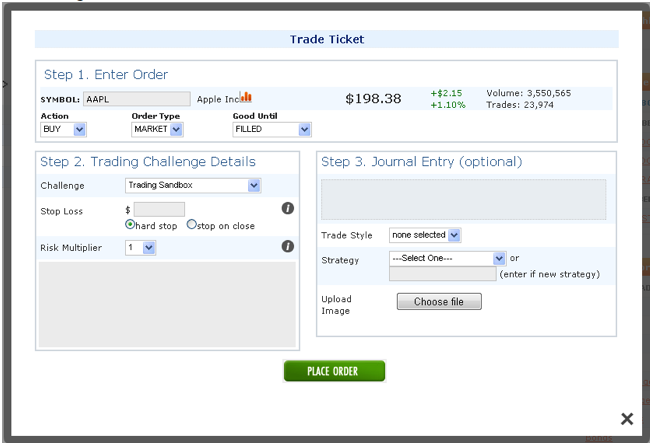
1. Enter Order
The first step is to enter the symbol of the stock you wish to trade. Once the symbol has been activated, there are three pull down menus to use to define your order.
Action
- Buy the stock
- Sell the stock (this will only appear if you already have a bought position in the stock)
- Short the stock
- Cover the short (this will only appear if you already have a short position in the stock)
Order Type
- Market – enter the trade at the market price at the time. Although the Trade Ticket will display a delayed price quote, you will actually be filled at the real time price at the time you make the trade.
- Limit – enter the trade at a specific price that you select. For a limit order to be filled requires that the market trade at the limit price.
- Stop – enter the trade if the market comes to the stop price you enter. For example, if the stock is trading at $10 and you enter a Buy Stop at $10.50, the trade will only be entered if the stock rises in price to trade at $10.50.
Good Until
This pull down menu determines how long your order is valid for. You can select until the end of today, until filled or a specific date. Once the Good Until threshold is hit, the trade will either be executed or deleted.
2. Trading Challenge Details
This is the other mandatory part of the Trade Ticket. Here you can select the Trading Challenge that would like the trade applied to and enter your stop loss price and risk multiplier.
Stop Loss
This is the price where your trade will be exited at a loss. A hard stop triggers an exit if the stop loss price is hit. A stop on close triggers an exit if the stock closes the trading day below the stop loss price.
The Stop Loss is required because it plays an important role in the calculation of the TradeScore. Risk management is an essential part of trading and traders will earn a higher TradeScore if they manage risk effectively. The more reward (the difference between a profitable exit price and your entry price) you earn for the risk (the difference between the entry price and the stop loss price) you take, the higher your TradeScore. This is discussed in more detail in the Measuring Performance Section of this document.
Risk Multiplier
The risk multiplier allows you to allocate more risk to a particular trade. Position size is determined by the Risk Tolerance divided by the Risk per Share. If you buy a stock at $10 with a stop loss price of $9, you have $1 in Risk per Share. If you are willing to take $500 of risk on one trade (the Risk Tolerance) then you would purchase 500 shares.
With the risk multiplier, you could take a greater multiple of Risk Tolerance. If you choose to apply a Risk Multiplier of 2 to a trade, you will take double the position that you would normally take. This also means that your TradeScore will be doubled for that trade and its inclusion in the calculation of your overall ranking for the Challenge.
Use the Risk Multiplier if you have a higher degree of confidence on one trade but recognize that if you are wrong and you lose on the trade, you will have a higher negative TradeScore to be used in your overall Trading Challenge ranking.
3. Journal Entry (Optional)
The Journal Entry section of the Trade Ticket is optional. It allows you to enter comments to be review for your self and to be shared in the Stockscores Trading Desk community. This is a good place to write your reasoning for making a trade, define the style of trade, the strategy or include an image that you want to include.
Your comments and images entered here will form an entry in your Trade Journal so that you can go back and review the trade later. You will also be able to add comments to your Trade Journal once you are in a trade.
Place Order
Once you have filled out the Trade Ticket, click on the Place Order button to execute the trade.
When the order is filled, it will be listed on the Current tab of the Trade Tracker, found in the My Trading Desk section.
Remember that your fill prices are based on the real time pricing at the time you make the trade. We are unable to display the real time quote when making the trade but you will be filled at the prevailing price in the actual stock market.
Tracking a Trade
The trades you make in the Trading Challenge or the Trading Sandbox are tracked within the My Trading Desk section.
My Trading Desk
There are four functional areas of the My Trading Desk section.
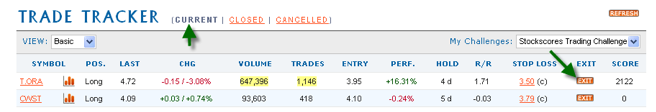
Trade Tracker
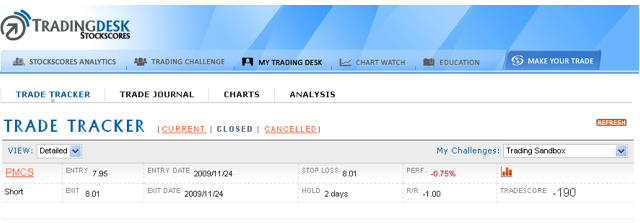
The Trade Tracker provides a table view of your Current, Closed or Cancelled trades. Here you can see the TradeScores and other performance metrics for the trades you are in or have completed.
There are two view types for the Trade Tracker which can be selected from the pull down menu in the upper left of the screen.
By clicking on the small chart icon,![]() , you can bring up a small chart of the stock that was traded. If you click on the symbol of the stock, you will go to a larger and more detailed chart view.
, you can bring up a small chart of the stock that was traded. If you click on the symbol of the stock, you will go to a larger and more detailed chart view.
Trade Journal
The Trade Journal is an important tool for every trader. It allows you to keep a log of your trading thoughts, chart references and trade details. Images uploaded to the Journal form part of it, to be referenced any time in the future.
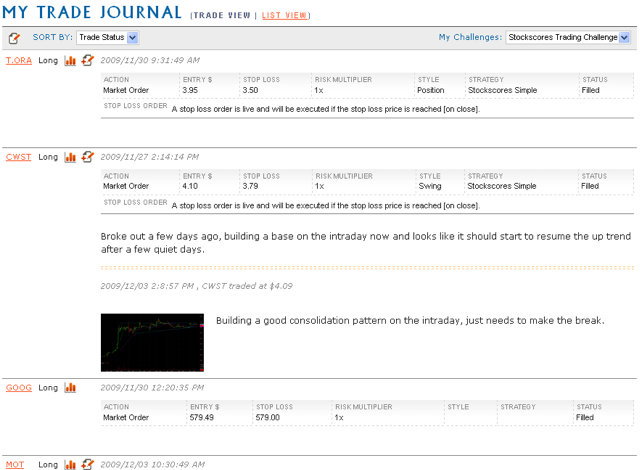
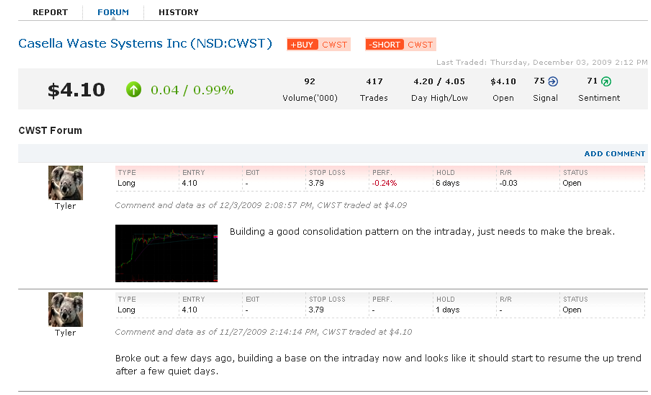
Plus, the trades that you make and the comments you post to the Journal form part of the Stockscores Trading Desk community discussion.
Exiting a Trade
The simplest way to exit a trade is to initiate an exit order from the Trade Tracker inside the My Trading Desk section.
Go to the Current trades table and click on the Exit button:
This will bring up the Trade Ticket for the stock you have selected.
The Trade Ticket
Enter Order
Choose the Order Type and Good Until selections, enter any comments or images you wish to post to your Trade Journal and then click on the Place Order button.
Once your trade has been exited, it will appear in the Closed trades table in the Trade Tracker.
Measuring Performance
The trades you make in the Trading Challenge earn individual TradeScores but they also contribute to your overall trader rank. You can join the game at any time and have a chance to sit atop the leaderboard in the overall Trading Challenge.
How the TradeScore is Calculated
There are four important components determining the TradeScore.
• Risk – the dollar difference between the entry price and the initial stop loss price.
• Reward – the dollar difference between the exit price and the entry price.
• Hold Period – the number of days a position is held (minimum used is 5 days)
• Risk Multiplier – the weighting of risk tolerance for the trade
From these variables, we can calculate the components of the TradeScore.
• Percent gain/loss – Reward/Entry Price
• Reward for Risk Ratio – Reward/Risk
• Annualization Factor – Hold Period / Number of Trading Days in Year
This leads to the TradeScore formula
Percent Gain/Loss * Absolute Value of Reward for Risk * Annualization Factor * Risk Multiplier * 100
For example, a stock is bought at $10 with an initial stop at $9. 10 days later, it is sold at $12. The trader used a risk multiplier of 1 when submitting the trade.
Percent Gain/Loss = ($12 – $10)/$10 = 20% or 0.20
Absolute Value of Reward for Risk = ($12 – $10)/($10-$9) = 2
Annualization Factor = 252 trading days in year / 10 day hold period = 25.2
Risk Multiplier = 1
0.20 * 2 * 25.2 * 1 * 100 = 1008
How the Rankings are Calculated
Your ranking in the Trading Challenge is based on the recent trades that you have made. If you have made less than the minimum number of trades, your ranking will be lower because we take an average of the qualifying trades.
First, we must establish three different trades types as these determine how the ranking is calculated.
• Day Trade – Hold period of 2 days or less
• Swing Trade – Hold period of greater than 2 days but less than or equal to 30 days
• Position Trade – Hold period of greater than 30 days
Days held are based on trading days and not calendar days.
Individual trades are weighted based on their age. This is done so that traders who are active in the game and have made recent trades are able to rank higher than those that are not playing.
This does not mean that you have to be a short term trader to compete as how trades are weighted varies based on their hold period.
To achieve a 100% weighting in the calculation,
• Day Trades must have been exited within the last 30 days
• Swing Trades must have been exited within the last 90 days
• Position Trades must have been exited with the last 365 days
A trade will suffer a declined weighting according to the following:
- Closed Day Trades will decline at 3-1/3% per day for 30 trading days, starting 31 days past the exit date
- Closed Swing Trades will decline at 2% per day for 50 trading days, starting 91 days past the exit date
- Closed Position Trades will decline at 1% per day for 100 trading days, starting 366 days past the exit date
- Open Trades will have 100% weighting
The average Tradescore will be a numerical average of the weighted TradeScores based on a minimum # of trades.
- Day Trader – 20 trades
- Swing Trader – 16 trades
- Position Trader – 10 trades
The following types of trades will always be included:
- Open trades that have a hold period that is greater than the average hold period for the trader
- Closed trades that have a 100% weighting
Where there are more than the minimum required, all trades will be included in the average.
If the total of the above trades does not reach the limit based on the type of trader, weighted trades will be used to reach the minimum limit according to the following hierarchy:
- Closed trades that have a weighting of 50% or better
- Open trades
- Closed trades that have a weighting of less than 50%
The Average TradeScore adds up all the applicable TradeScores and divides by the total number of applicable trades. If there are less than the minimum required trades, the Average TradeScore will be multiplied by the fraction of the # of trades/minimum required (eg/ 18/20=0.9)
Understanding the Reward for Risk Measure
The Stockscores Approach puts a heavy emphasis on risk management. At the core of good risk management is the Reward for Risk ratio.
Traders should never judge their success by the dollar or percentage value gained or loss. Instead, the outcome of the trade should be judged in consideration of risk taken. Making $1000 with $5000 risked is not as good of a trade as one that makes $1000 with only $500 risked.
The amount you risk is not based on the total value of the trade, but instead, by the difference between your entry and stop loss price.
If you buy a stock at $10 with a stop at $9, you have $1 a share in risk. If you are willing to risk $500 on that trade then you will buy 500 shares.
This approach to risk management allows you to assign the same amount of risk regardless of a stock’s volatility. A more volatile stock will have a wider stop loss point and therefore, more risk per share. This means that the dollar position size will be smaller.
This approach to risk management requires a good understanding of where to put stop loss points. Stops set too tight can be triggered before the stock has a chance to make a move. Stops set to wide will lower the size of the position and hurt overall profitability.
-
I know Mike is a very solid investor and respect his opinions very much. So if he says pay attention to this or that - I will.
~ Dale G.
-
I've started managing my own investments so view Michael's site as a one-stop shop from which to get information and perspectives.
~ Dave E.
-
Michael offers easy reading, honest, common sense information that anyone can use in a practical manner.
~ der_al.
-
A sane voice in a scrambled investment world.
~ Ed R.
Inside Edge Pro Contributors

Greg Weldon

Josef Schachter

Tyler Bollhorn

Ryan Irvine

Paul Beattie

Martin Straith

Patrick Ceresna

Mark Leibovit

James Thorne

Victor Adair