
Timing & trends
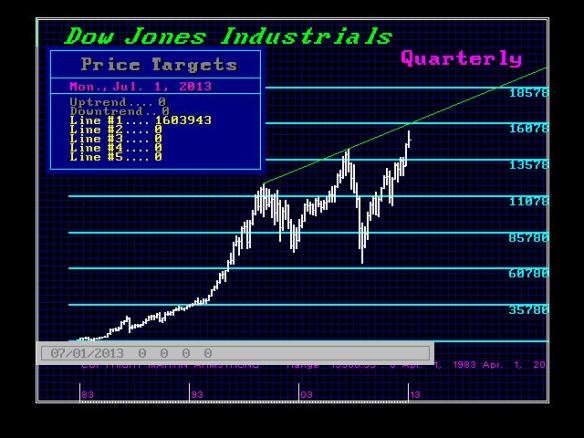
The Dow Jones Industrials are approaching the major top of the up uptrend channel. which stands at the 16000 level for the 3rd quarter. We have a turning point in September. The real question is will we breakout and move into a Phase Transition going into 2015.75? This depends entirely how we interact with this technical resistance projection. We can exceed it, and then fall back to retest it from above. Holding this projection then becomes the springboard for a Phase Transition to the upside.
The second pattern would be to peak at this projection in September, fall back as retest support holding the Weekly Bearish Reversals generated from that high, and then resume the uptrend to blast through to the upside. in 2014.
Many question have been coming in regarding seminars and a forecasting report for the share markets. We have these under consideration right now. The maximum target for the Dow Jones Industrials by 2015.75 is actually 43,390. This becomes a viable target depending upon all markets and how they set up for September aft er the ECM mid-point target of August 7th.
Fed Minutes Show 50% of Board Want QE To End by Year-end
The minutes of the Fed meeting are showing that we may not be talking about tapering the Quantitative Easing, we may be looking at its end. Bernanke is leaving because the Fed has no room to manipulate the economy no less interest rates. This is perhaps the greatest dissent within the Fed we have every seen. QE is going to die and Bernanke is leaving. So say Hello to the next 2 years.
Where will Capital Go After 2015.75?
QUESTION: When the capital flows change direction after 2015.75, . . . .. If the inflows come to the USA after Japan & Europe implode, where does capital go after 2015.75??????
ANSWER: ….read & view it all HERE

Gold futures reversed course to trade sharply lower after rising to a three-week high earlier in Wednesday’s U.S. session.
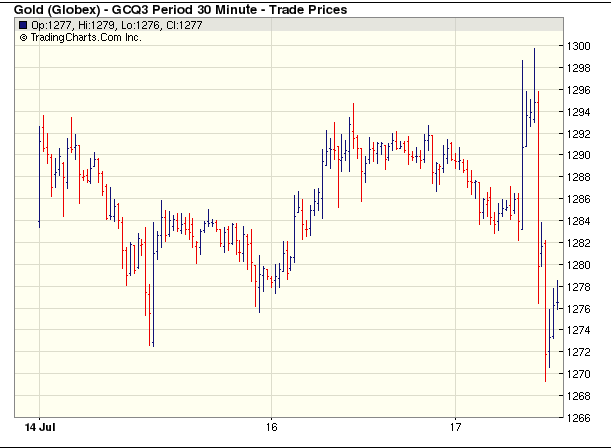
On the Comex division of the New York Mercantile Exchange, gold futures for August delivery slid 1% to USD1,277.55 per troy ounce in U.S. trading Wednesday after earlier flirting with USD1,300 an ounce.
Traders bid bullion higher earlier in the session after Federal Reserve Chairman Ben Bernanke said the pace of the central bank’s bond purchases are not a “preset course” In prepared remarks released before his testimony to Congress later in the day, Fed Chair Bernanke said the pace of the central bank’s bond purchases are not a “preset course”.
“I emphasize that, because our asset purchases depend on economic and financial developments, they are by no means on a preset course,” Bernanke said.
Bernanke reiterated that the Fed will continue to maintain its accommodative monetary policy for the foreseeable future.
The Fed chief also overtly pointed out that the central bank’s USD85 billion-a-month bond-buying program will in fact be tapered later this year and perhaps ended outright by the middle of 2014. Easing programs are seen as destructive currencies, which in turn boosts dollar-denominated commodities such as gold.
Elsewhere, Comex silver for September delivery plunged 2.47% to USD19.443 per ounce while copper for September delivery shed 1.76% to USD3.130 per ounce.
Michael Lewitt is one of my favorite credit analysts. If I want to know what is happening in the credit markets, one of my first calls is to Michael. He has been doing deep dives into some rather esoteric markets as well as traditional bonds over the course of his career, and he really understands what is happening under the surface.
In the latest issue of The Credit Strategist, which Michael has given me special permission to pass on to you as today’s Outside the Box, he gets our attention right off the bat by comparing the recent big move in the benchmark 10-year Treasury yield to a comparable two-month move in 1994, a year that, as he says, was “generally viewed as Armageddon for bond investors.” But in percentage terms, the 1994 move was only 20% over that period while the recent move was 40%.
And what caused that move? Ben Bernanke blinked, that’s all. It’s high time, says Michael, for investors to prepare their portfolios for the eventual termination of the Fed’s monetary fun and games, since:
The comparison between the recent interest rate spike and 1994 underlines just how Fed-dependent markets have become and how incredibly difficult it is going to be for Mr. Bernanke and his colleagues to alter policy without causing serious market dislocations….
Mr. Bernanke is creating the conditions for a violent market reversal. As I wrote last month (“Delusions of Stability”), the dependence of markets on the continued beneficence of the Federal Reserve is profoundly unhealthy.
Then Michael takes us straight into the nitty-gritty of how to put in protection. Read and learn – then act while the acting is good.
You’ll notice that in this issue of The Credit Strategist, in addition to the first-rate macroeconomic analysis, there are sections on equities, credit, currencies, and gold. And it’s this way every month – Michael is comprehensive and he’s astute. You can learn more and subscribe to The Credit Strategist by going to www.thecreditstrategist.com.
I am in Dallas tonight and feeling much better, trying to catch up on my reading as well as some deadlines that slipped while I was sick. I am taking it easy and letting my body recover, though. It is raining in Dallas, and is a cool night with open windows in July. Not sure I remember the last time that happened.
I am looking over the shoulder of my architect/designer and general contractor as the two ladies work on getting my new abode ready. They tell me late October is a real possibility. I am ready. We are trying to find someone to do the work on the media room and all the networking, as it is no longer a simple matter of dropping in a few wall connections. Now, everything talks to everything else. We are looking at systems that let you control everything from a mini-iPad-type device: sound, TVs, lights, screens, security, locks, pretty much everything but the refrigerators. I am seriously open to suggestions from readers who know what I should be looking at installing now and thinking about for the future.
Have a great week, and if someone knows an exec at eBay I would like to talk with them.
Your glad to be back at work analyst,
John Mauldin, Editor
Outside the Box
JohnMauldin@2000wave.com
The Mirror Cracks
“Life invests itself with inevitable conditions, which the unwise seek to dodge, which one and another brags that he does not know, that they do not touch him; but the brag is on his lips, the conditions are in his soul. If he escapes them in one part they attack him in another more vital part. If he has escaped them in form and in the appearance, it is because he has resisted his life and fled from himself, and the retribution is so much death.”
– Ralph Waldo Emerson
The financial markets have now seen what a world without quantitative easing is going to look like, and they don’t like what they see one bit. In fact, the mere possibility of an end to the Federal Reserve’s monetary experiment sent credit markets to some of their biggest losses in recent history both in absolute and percentage terms. All of these losses were triggered by a move in the benchmark 10-year Treasury yield from a low of 1.63% on May 2 to a high of 2.66% just a few days before ending the quarter at 2.49%. ISI Group has done some great work placing this move in context. In 1994, a year generally viewed as Armageddon for bond investors, the 10-year Treasury only increased by 90 basis points during a comparable 2-month period that started a sustained increase in rates. Moreover, in percentage terms, the 1994 move was only 20% over that period while the current move was 40%.
Conditions today are far different than those in 1994, however; today they are far more conducive to rates staying low. During that period in 1994, the Federal Reserve hiked the Federal Funds rate by 70 basis points (the first leg of a move that would see the Federal Reserve raise rates by another 175 basis points by the end of that year – with 10 year Treasury yields following by another 100 basis points). In contrast, today there is no chance that the Federal Funds rate will be increased for at least the next two years. For another, the Federal Reserve’s balance sheet has already increased by more than $400 billion this year and is expected to increase by another $450-500 billion by year end. So while the Federal Reserve tightened by 250 basis points in 1994, the Federal Reserve’s bond purchases are effectively lowering interest rates on the order of 70 basis points (ISI’s estimate) today. The comparison between the recent interest rate spik e and 1994 underlines just how Fed-dependent markets have become and how incredibly difficult it is going to be for Mr. Bernanke and his colleagues to alter policy without causing serious market dislocations. What investors should learn from this is that they should be preparing their portfolios now for serious – perhaps unprecedented – volatility when the Federal Reserve finally does what it needs to do and stops propping up the markets. Some of us began doing this several months ago and avoided damage to our portfolios in May and June (while still earning decent returns in the interim).
The pain in credit markets was widespread. High yield bonds, which were trading at an oxymoronic yield of 4.8% in early May, closed June at 6.66% after reaching a high of 6.9%. Average bond prices fell about 6 points from a high of 107 in early May and spreads widened by more than 100 basis points. Historically, spreads have contracted when yields have increased, but as with many traditional correlations this one did not hold in an era of unprecedented central bank policy manipulation. This is likely because the duration of high yield portfolios has lengthened as issuers steadily stretched their debt maturities through refinancings. Despite all the talk of the importance of keeping portfolio durations short, many managers succumbed to the temptation to lengthen them as stable credit conditions persisted. The sell-off created some interesting anomalies (i.e. opportunities), including an inversion of high-quality cash curves, a widening of the cash/credit default swap basis, outperformance of high quality loans, and underperformance of high quality high yield bonds. For example, BB-rated bonds performed worse than CCC-rated bonds (the reverse of what has normally happened in the past), while the reverse happened in the loan space. As for credit default swaps, it appears that the use of these instruments by mortgage hedgers to protect their structured portfolios forced single name credit default swap spreads to widen; this has made it more attractive for investors to sell protection rather than own cash bonds in many credits. Before too many observers get too tempted by near 7% yields, however, they should take a deep breath and remind themselves that high yield bonds (and their derivatives) are hybrid debt-equity securities that on averagestill offer far too little reward for the risk involved in owning them. Relative value is not value.
Investors have clearly been shaken. High yield mutual funds and ETFs have reportedly seen $12 billion of outflows over the last five weeks, representing about 7% of their total assets. According to Citigroup, this reversed the total inflows of the past 14 months. Investors in this asset class are nothing if not fickle. Put another way, these assets – at least at the margin, which is what matters in markets – are held by weak hands. There lies the risk … and the opportunity.
By way of comparison, leveraged loans saw their average price drop by less than $1.00 in June; their yields increased by 56 basis points and their spreads widened by only 33 basis points according to J.P. Morgan, demonstrating again why they remain extremely compelling defensive holdings.
Investments that are considered the most conservative (not by me but by the consensus) – municipal and investment grade bonds – were also battered. For example, the iShares S&P National AMT-Free Muni Bond ETF (MUB) sold off from 111.60 on May 1 to a low of 100.28 before recovering to end the month at 105.04 (a loss of 5.88%). The iShares iBoxx Investment Grade Corporate Bond ETF (LQD) saw a loss of 3.56% in June (from $117.85 to $113.65). While significant, these losses should be seen in the context of the significant returns that these asset classes have generated in recent years. Mortgage-backed securities suffered their worst performance since 1994 with a 2% loss in the second quarter. Subprime mortgage bonds also lost 2% during the quarter including a whopping 4.9% drop in June alone. This is hardly surprising in view of the obvious dependence of the mortgage market on the Federal Reserve’s $40 billion monthly bid for paper. These losses may be painful but they are hardly catastrophic as long as they don’t persist.
Some of the best bond investors with the most impressive long-term track records were badly hurt. Bill Gross’s $285 billion Pimco Total Return Bond Fund (PTTRX) lost 2.8% in June (dropping from $11.07 to $10.76) and is down -4.27% for the year (from $11.24 on December 31, 2012), while his colleague Mark Kiesel’s $11 billion Pimco Investment Grade Corporate Bond Fund (PBDAX) lost -4.08% in June (from $11.01 to $10.56) and is down -5.04% for the year (from $11.12 on December 31, 2012). Even Jeffrey Gundlach was taken by surprise by the sudden sell-off in the 10-year Treasury as his DoubleLine Total Return Fund (DLTNX) lost 2.13% in June (from $11.26 to $11.02) and is down -2.38% for the year (from $11.33 at year end). Both Mr. Gross and Mr. Gundlach were apologetic about their performance, but neither man has anything to apologize for in view of their outstanding long-term records. Nonetheless, the fact that two of the market’s greatest long-term perf ormers were unprepared for the market’s reaction to Mr. Bernanke’s words suggests just how deeply embedded Fed-dependency has become in the financial markets. Both men have stated that they believe that Mr. Bernanke’s forecast of 3.0-3.5% GDP growth in 2014 is too optimistic, and both have reiterated their view that Treasuries are attractive at 2.5% (views first stated when Treasuries were at 2% after selling off from their low of just over 1.6% at the beginning of May). I concur with them that the economy is unlikely to grow at better than 3.0% in 2013, but I find nothing remotely compelling about lending to the U.S. government for ten years at 2.5%. Buying 10-year Treasuries as a trade may make sense for the most nimble, but it is difficult to be nimble when managing tens or hundreds of billions of dollars. Investing in Treasuries at their currently artificially depressed yields is playing with fire. It is one of the wonderful ironies of the English language that the word “taper” not only means to “gradually withdraw” but is also a noun used to describe a long, thin candle or a long, waxed wick used to light candles or fires. Perhaps the Princeton economics professor was playing with the market in more ways than people realize when he used that term to describe his future policy moves.
There is little question that markets were overdue for a correction. That is why I advised investors to reduce their equity holdings two months ago and why I have been recommending limiting credit exposure to short duration corporate bonds and floating rate bank loans since the beginning of the year. By April, the most prudent posture was to be hedged against rising interest rate risk and widening spreads. In high yield, there are three risks that have to be addressed at any given time: interest rates, credit and systemic/macroeconomic risk. For the moment, credit risk is well-contained (the default risk is about 3.0% and any capable manager should be able to avoid defaults), so the focus is on hedging rising rates and an equity market correction. It is likely that the 4.8% average yield on high yield bonds reached in early May will prove to be a generational low, just as some believe that the March 2009 S&P 500 level of 666 will serve as a generational low for s tocks. The difference, of course, is that the S&P 500 low was expressing the depths of investor despair while the May 2013 low in yields was the apogee of investor complacency. And while it took only a short time (about six weeks) for high yield investors to be dealt a dose of reality, average yields of under 7% remain far below what is appropriate to reward them adequately for the equity risk inherent in the asset class.
Spreads of about 550 basis points over still shrunken Treasury yields may seem like a reasonable risk premium in historical terms, but it is highly misleading in measuring the true risk of these instruments. First, the prices of all financial assets – including high yield credit – is still being artificially depressed and distorted by years of zero interest rate policy and successive bouts of quantitative easing by the Federal Reserve and other central banks. Second, “spread” is a fixed income measurement tool being applied to a financial instrument – a high yield bond – that shares both fixed income and equity attributes. I often tell investors that high yield bonds are like a child who has inherited the worst attributes of both of his parents. When the bond market sells off, high yield bonds sell off; when stocks sell off, high yield bonds sell off as well! As the ultimate “risk-on” asset class, high yield bonds find any excuse to pile on to the “risk-on” trade and any excuse to run for the hills when the “risk-off” button flashes red. Any equity investor will tell you – or should tell you – that 7% is an inadequate return for taking equity risk (which involves the risk of loss of all or part of your principal).
Ben Bernanke, of course, is trying to lower investors’ threshold regarding the return they require for taking risk, but investors should not be fooled. By doing what he is doing, Mr. Bernanke is actually significantly increasing the systemic and other risks that investors are facing. And for that reason, investors should actually be demanding higher, not lower, real returns on their investments. I realize that last statement is directly contrary to the consensus that argues that the Federal Reserve (and other central banks) have taken the tail risk out of the markets with their extraordinary market interventions. My response to the consensus is that central banks have done nothing of the kind; at best, they have delayed the occurrence of tail risks, but in doing so have guaranteed that the consequences of trail risks will be far more severe when they inevitably materialize. The policies that are being employed to create the appearance of economic and market sta bility are not effectively addressing the underlying symptoms of economic malaise; in fact, they are exacerbating them. Debt is being used to cure a debt crisis in the hope that fiscal policies will be implemented that will foment sufficiently high economic growth to create the income necessary to service and ultimately repay that debt. But even in the best of all possible worlds such an outcome would be a long shot since the sheer amount of debt being generated to keep economies afloat is too large to be serviced or repaid. And as we are all painfully aware, we don’t live in the best of all possible worlds – we live in a world populated by corrupt and narcissistic politicians and business leaders who refuse to effect the necessary fiscal reforms that would at least give monetary policy a chance to work. As a result, the post-crisis world has been left more indebted and more interconnected than the pre-crisis world. The tails may be buried a little deeper than they were, but they are fatter than ever.
Mr. Bernanke is creating the conditions for a violent market reversal. As I wrote last month (“Delusions of Stability”), the dependence of markets on the continued beneficence of the Federal Reserve is profoundly unhealthy. When Mr. Bernanke said that the Federal Reserve expects 2014 growth to clock in at 3-3.5% (too high in my opinion – I expect 2.75-3.0%), and that if this growth comes to pass, the Fed will then begin to taper (which means to reduce gradually, not to stop suddenly) its bond purchases at the end of the year, the market’s reaction was sudden and violent. Yet at the end of the day, the S&P 500 barely lost 5% before Mr. Bernanke sent his minions out into the media to dispel any fears that the Federal Reserve would abandon the markets. Such backpedaling is highly dysfunctional. As David Rosenberg wrote, “I guess the premise is there should never ever be periodic setbacks even for a market that has surged 135% from the c ycle lows. Incredible.” (David Rosenberg, Gluskin Sheff, Breakfast with Dave, June 26, 2013, p. 3.) Mr. Bernanke mentioned at his post-FOMC news conference in June that he was surprised by the rise in interest rates after his May 22 testimony, which suggests that he may not appreciate just how Fed-dependent the financial markets have become since the financial crisis. Now that is really incredible.
Sometimes it seems like our central bankers populate a parallel universe completely detached from the real world of markets. Take their fear of deflation. There is an enormous difference between a debt-induced deflation of the kind we saw during the financial crisis, where massive debt destruction led to systemic stresses, and the type of low consumer inflation (which I don’t believe for a second, but that is a separate conversation) that the Federal Reserve is now obsessing about. As David Rosenberg notes, “as for ‘goods deflation’, what is wrong with consumers being able to buy more eggs, bread and T-shirts with the dollar they earn? This push against deflation is remarkable in its own right – historically, this was the norm and inflation was the hallmark of wartime, and the economy looking back at centuries of data did quite well in this respect, thank you very much.” (David Rosenberg, Gluskin Sheff, Breakfast with Dave , June 26, 2013, p. 3.) Uber-dovish St. Louis Fed President James Bullard not only dissented from the most recent Federal Reserve Open Committee statement (because he thought it was too hawkish), but later stated that the Fed might have to provide more accommodation to protect its inflation goal. In view of the trillions of dollars of direct and indirect accommodation that has already been provided, the gross distortion of the value of all financial assets (even after the recent minor correction), and the long-term risks of such an unprecedented policy, it would not be inappropriate to consider Mr. Bullard’s stance a form of lunacy. The United States is hardly at risk of experiencing a deflationary spiral downward in consumer prices, and the Federal Reserve’s focus on deflation is profoundly misguided.
Equities
The hysteria over a 5% correction suggests that the only thing that matters for stock market investors is what the Federal Reserve says and does (or doesn’t do). I believe that Ben Bernanke was trying to take some air out of the financial markets, including both stocks and bonds, with his cautionary comments about the possibility of the Federal Reserve tapering its bond purchases by year end if economic growth meets his expectations. Some argue it will happen as soon as September; others that it will not begin until sometime in 2014. Regardless of when it happens, what stock market investors need to be concerned about is the weak support for stock prices above 1600 on the S&P 500 (or above 15,000 on the Dow Jones Industrial Average) without the Federal Reserve’s current level of bond purchases (zero interest rates are here to stay until at least 2015). From that perspective, stocks may be living on borrowed time. Earnings momentum alone is unlikely to sustain stock prices in the next few quarters. Companies warning investors to expect disappointing results outnumbered those promising better results by a 6.5-to-1 margin, the worst ratio since 2001. And analysts are projecting second quarter profits growth of a modest 3%, down from the 8.4% they were expecting in January. Revenue growth, which disappointed in the first quarter, is projected to increase by only 1.8% in the second quarter. GDP growth is stretching to reach 2.0%. At this point, the strongest factor supporting the case for higher stock prices is the 90% correlation between rising stock prices and the growth of the Federal Reserve’s balance sheet. That balance sheet is likely to rise by another $450 billion over the rest of 2013. Investors willing to count on that correlation persisting may be rewarded, but they should limit their holdings to special situations (i.e. stocks where there is an identifiable catalyst to higher value) or those trading at discoun ts to the market’s price/earnings multiple (i.e. value stocks). I would expect growth stocks and dividend stocks to lag as growth struggles and interest rates edge higher over the next 12-18 months.
Credit
Many investors will be tempted to see value in suddenly battered debt instruments of all kinds – munis, investment grade and high yield bonds, mortgage-backed securities. It needs to be pointed out that this is only relative value – in absolute terms, all of these instruments – on an average basis – are still trading at artificially depressed yields as a result of the Federal Reserve’s policies (which, just to be clear, haven’t yet changed and are unlikely to change for at least several months). The fact that so few investors in credit were prepared for the recent sell-off is a classic example of Hyman Minsky’s financial-instability hypothesis whereby stability breeds instability: as stable financial market conditions persisted and extended since 2009, credit investors grew increasingly complacent and added leverage, duration and illiquidity to their portfolios. The correct approach was to do the opposite – as the cycle became more extended, they should have been shortening duration, eliminating leverage and selling their least liquid holdings. They might have been “early” and sacrificed some returns in the short-run, but in the long-run their returns would be much better. At this point, investments should be focused with managers who understood this. In the high yield space, the sell-off has created a new set of opportunities in short duration bonds and loans with low ratings (that overstate their default risk) issued by some of the large buyouts of the mid-2000s (these securities held up extremely well during the sell-off). In general, investments in credit need to be focused on event-driven special situations where there is (like in the equity space) an identifiable catalyst to near-term value realization. Investors do not want long-term exposure to interest rate or macroeconomic risk.
Currencies
I expect the Yen to resume its weakening against the U.S. Dollar and Euro again shortly. Japan remains set on its policy course and will not stop until the Yen trades at much weaker levels (at least 120 to the U.S. Dollar). This should allow the Yen carry trade (properly hedged) to remain attractive for a while longer. For the moment it appears that Japanese Government Bond rates have stopped rising although the possibility remains that the Bank of Japan could lose control over the long end of the curve at any time. The Euro continues to maintain its strength as the region’s economies wither on the vine, but there is no reason to believe that the currency’s strength will persist forever (although every time I recommend that investors stay short the euro, Keynes’ words “in the long run we are all dead” run through my head). Europe is still a mess and little is being done to fix it. Interestingly enough, the European Central Bank’s b alance sheet has actually been shrinking over the past year, something that is hardly conducive to economic growth. The fact that the European currency remains above $1.30 in the face of all of these factors has to make this among the most frustrating trades in recent memory. It is also a great example of why financial markets work in practice but not in theory and why investors have to be very careful using leverage when investing in currency markets. All that being said, the Euro will crack sooner or later and I would remain short (without leverage obviously).
Gold
Gold has been decimated in recent weeks, with the spot price closing the quarter at $1,234.57/oz. Gold was down -27% over the first half of the year (-23% in the second quarter), about twice the inverse of the rise in the equity markets. Even as a hedge, therefore, gold didn’t work. I would attribute the plunge in gold to several factors. First, a lot of gold was held by leveraged speculators who were forced out of the market as prices dropped. Second, investors who view gold as an inflation hedge are abandoning the trade based on the low level of reported consumer price inflation in the U.S. Third, investors who view gold as a hedge against the inevitable demise of the fiat paper standard are coming to believe – wrongly in my view – that central banks are going to change their ways. For all of these reasons, gold is back to levels last seen in 2010.
Gold remains an insurance policy against the inevitable decline of the fiat paper standard. There is far too much debt in the world that can never be repaid in constant dollars. This debt can only be repaid in one of three ways: (1) partially, which means through defaults and restructurings (see, for example, Greece, Cyprus); (2) through inflation; and (3) through currency devaluation. The global economy is simply incapable of generating sufficient income to service and then repay the trillions of dollars of debt on the balance sheets of the central banks not to mention all of the other public and private sector debt, nor the hundreds of trillions of dollars of future entitlement obligations of its governments. In the end, paper money will continue to be devalued and gold will be the beneficiary of that phenomenon. I would be perfectly comfortable adding to gold positions at this level as a long-term trade, and would strongly advise investors who do so to purchase phy sical gold.
Last week the price of the white metal climbed to an over two-week high after U.S. Federal Reserve Chairman said its huge stimulus program would stay in place for some time. Investors are now focused on Ben Bernanke once again.
“The main focus is Bernanke’s testimony to the Congress, and that should really give us more guidance to whether tapering will start in September or December,” Danske Bank analyst Christin Tuxen said.
Could this above-mentioned event trigger a breakout above the important resistance level? Or maybe the worst is not behind us and we will see furtherdeclines in silver?
Recently, there has been much talk about gold’s price. This has pushed silver a little bit to the side, which we don’t think is quite fair. Because of that, we devote our today‘s analysis solely to the white metal. Let’s take a look at the charts and find out what’s the current outlook for silver.
Today we will start with the analysis of the silver long-term (charts courtesy byhttp://stockcharts.com)
Click HERE or on Chart for Larger Image

In this week’s very long-term silver chart, we have a situation somewhat similar to what we saw happen with gold last week. Silver also moved higher and attempted to move above the declining resistance line, finally closing right at it (a few cents below the $20 level) without breaking it.
Technically, at this time we have no breakout, so the situation remains bearish (even the short-term trend). The downtrend will remain in place here unless silver can increase and hold a breakout above the $20.70 price level (this is a short-term resistance level based on the intra-day highs).
In the recent days we haven’t seen such action. Therefore, in our opinion last week’s rally was nothing more than a contra-trend bounce.
Once we know the current situation in silver, we think it would be interesting to revisit the silver-to-gold ratio to see how the two are valued relative to each other.
Click HERE or on Chart for Larger Image

In the silver-to-gold ratio chart, we still see no signal of a bottom.
As we wrote in our essay on gold, stocks and the dollar on June 26, 2013:
“(…) the final bottom for the white metal is often preceded by a big underperformance of silver to gold.”
We have not seen signs of such action last week, so it seems that the final bottom is still ahead of us.
If that’s the case and the white metal is about to move lower, let’s take a look at our final chart today and find out if it confirms the bearish clues.
In this medium-term SLV ETF chart we see that silver is now slightly above the declining resistance line. We should pay attention that this level coincides with two more resistance levels.
The first is the 20-day moving average, the red slope in our chart, which has proven to be an important resistance line since it was broken in February. It has been tested a number of times since, and such is the case once again. All the previous cases were followed by downswings.
The other level is the first Fibonacci retracement level, 38.2% based on the June decline. From this point of view we can clearly see that silver did not move above these two resistance levels.
At this point, we think it’s worth to mention another bearish indication.
Last week we saw a move to the upside for silver on relatively weak volume. In the recent past, this was also seen before bigger declines. This was the case in early June, late May, early May and also in April. It seems that we have this once again (the volume we saw yesterday was exceptionally tiny).
Summing up, silver moved higher last week and rose on Thursday to its highest level since the June 28 low. Despite this growth, there was no breakout and the downtrend is still valid. We think that the next move for silver will be down and in tune with its recent and current short-term trend.
Thank you for reading. Have a great and profitable week!
Przemyslaw Radomski, CFA
Founder, Editor-in-chief
Gold Investment & Silver Investment Website – SunshineProfits.com
* * * * *
Disclaimer
All essays, research and information found above represent analyses and opinions of Przemyslaw Radomski, CFA and Sunshine Profits’ associates only. As such, it may prove wrong and be a subject to change without notice. Opinions and analyses were based on data available to authors of respective essays at the time of writing. Although the information provided above is based on careful research and sources that are believed to be accurate, Przemyslaw Radomski, CFA and his associates do not guarantee the accuracy or thoroughness of the data or information reported. The opinions published above are neither an offer nor a recommendation to purchase or sell any securities. Mr. Radomski is not a Registered Securities Advisor. By reading Przemyslaw Radomski’s, CFA reports you fully agree that he will not be held responsible or liable for any decisions you make regarding any information provided in these reports. Investing, trading and speculation in any financial markets may involve high risk of loss. Przemyslaw Radomski, CFA, Sunshine Profits’ employees and affiliates as well as members of their families may have a short or long position in any securities, including those mentioned in any of the reports or essays, and may make additional purchases and/or sales of those securities without notice.

 In the full interview below, Don Coxe, chairman of Coxe Advisors LLP answers Michael’s penetrating questions about not only what is driving markets, but also how to interpret the big changes afoot and profit from them.
One of the reasons Michael likes Don so much as a strategist and investor, is that he has been engaged at the senior level in global capital markets through every recession and boom since the onset of stagflation in 1972. Indeed Don was interpreting markets well before the 34 year Bull Market in Bonds began, the Bull market in Bonds that he thinks recently topped and entered into a Bear Market.
Don begins answering Mike’s questions with an analogy, comparing Battlefield surgeons use of heroin on serious injuries with the Fed’s use of Quantative easing. This interview is only 19 minutes long really fascinating, particularily the last 4-5 minutes:
{mp3}mtjuly132013hour2{/mp3}

-
I know Mike is a very solid investor and respect his opinions very much. So if he says pay attention to this or that - I will.
~ Dale G.
-
I've started managing my own investments so view Michael's site as a one-stop shop from which to get information and perspectives.
~ Dave E.
-
Michael offers easy reading, honest, common sense information that anyone can use in a practical manner.
~ der_al.
-
A sane voice in a scrambled investment world.
~ Ed R.
Inside Edge Pro Contributors

Greg Weldon

Josef Schachter

Tyler Bollhorn

Ryan Irvine

Paul Beattie

Martin Straith

Patrick Ceresna

Mark Leibovit

James Thorne

Victor Adair