
Stocks & Equities
Is It Right Time to Buy Mining Stocks?
The most important Wednesday’s event was Ben Bernanke‘s testimony. The Fed Chairman said the U.S. central bank still expects to start scaling back bond purchases later in the year, but left open the option of changing that plan if needed.
We all know that every action has a reaction. Yesterday gold rallied and climbed to a three-week high at $1,300 per ounce after Bernanke’s remarks. This optimism didn’t last long. The yellow metal gave up the gains as the dollar remained strong and dropped slightly above $1,270 later in the day.
“Yesterday, gold was unable to convincingly break above $1,300 and some took this as a sign of weakness,” Commerzbank analyst Eugen Weinberg said. “We don’t expect any strong increase in the short time,” he added.
Does it mean that we see may further declines in the yellow metal? If gold moves lower, it may trigger a move down in mining stocks. How low can they go? Let’s examine the situation in the charts (charts courtesy by http://stockcharts.com.)
At the beginning let’s take a look at the gold stocks index – the HUI.
Click HERE or on chart for larger version:

In this week’s very long-term HUI index chart (a proxy for the gold stocks) we see that miners finally moved close to the upper border of the declining trend channel. Soon after that, they declined once again (it happened yesterday) and could be that the correction to the upside is already behind us.
The trend remains down, and another decline is likely before the final bottom is formed.
Where will it form? In our opinion, close to or slightly above the 2008 low as indicated in the above chart by the red ellipse (which also includes the 61.8% Fibonacci retracement level).
Once we know the current situation in the HUI index let’s take a look at the GDX ETF chart. Does it confirm the bearish outlook?
In this medium-term GDX ETF chart, we continue to see an analogy to the previous price patterns. The corrective ABC or zig-zag price pattern was previously followed by a period of declines. On each occasion, the GDX ETF did not move to the 50% Fibonacci retracement level. It declined after getting to or slightly above the 38.2% level. This same type of move was seen on Wednesday, and prices then declined. They seem ready to decline once again.
Furthermore, the volume levels on Wednesday being significant on a move to the downside suggest that it may be the start of bigger declines. The RSI level is close to 50, a level previously seen when the miners formed a local top.
In the past, sharp declines were not seen immediately after local tops. Moderate moves to the downside were seen initially and then – after a few days of moderate declines – we saw a period of accelerated declines.
Before we summarize, we would like to present you two interesting ratios: the gold-stocks-to-gold ratio and the ratio of the HUI Gold Bugs Index to the S&P 500.
Let’s start with the HUI-to-gold ratio. After all, gold stocks used to lead gold both higher and lower for years.
In the gold-stocks-to-gold ratio chart, we didn’t see a real improvement in the situation this week. Although the HUI-to-gold ratio moved higher on Tuesday, this move was barely visible from the long-term perspective. That was just a blip on the radar screen, just like when miners rallied relative to gold in the previous months.
Besides, when we look at the above chart, we clearly see that the HUI:gold ratio remains below the 50-day moving average, a level which has served as approximate resistance for the past month.
Therefore, in our view the downtrend is still valid and the implications remain bearish.
Now, let’s find out how the HUI is doing compared to the stock markets.
In this very long-term gold-stocks-to-other-stocks ratio we have seen a breakdown below the important support level created by the bottoms of 2005 and 2008. The ratio has been clearly below this level for several weeks now so the breakdown is confirmed.
The next support line is all the way down at the 0.1 level so it seems that further significant declines are likely before the final bottom is reached here. This target level is created by (applying Fibonacci techniques) extrapolating previous declines by the Fibonacci transformation of the Phi number (1.618) . It coincides with the local bottom seen in the middle of 2002.
This chart confirms what we’ve seen in other charts: the bottom is not in yet, another big drop is likely ahead, but the majority of the declines are probably behind us.
Summing up, the outlook for mining stocks remains bearish. Miners are still in a downtrend and it seems that the next move lower will probably be the one to take miners to their final bottom.
Thank you for reading. Have a great and profitable week!
Przemyslaw Radomski, CFA
Founder, Editor-in-chief
Gold Investment & Silver Investment Website – SunshineProfits.com
* * * * *
Disclaimer
All essays, research and information found above represent analyses and opinions of Przemyslaw Radomski, CFA and Sunshine Profits’ associates only. As such, it may prove wrong and be a subject to change without notice. Opinions and analyses were based on data available to authors of respective essays at the time of writing. Although the information provided above is based on careful research and sources that are believed to be accurate, Przemyslaw Radomski, CFA and his associates do not guarantee the accuracy or thoroughness of the data or information reported. The opinions published above are neither an offer nor a recommendation to purchase or sell any securities. Mr. Radomski is not a Registered Securities Advisor. By reading Przemyslaw Radomski’s, CFA reports you fully agree that he will not be held responsible or liable for any decisions you make regarding any information provided in these reports. Investing, trading and speculation in any financial markets may involve high risk of loss. Przemyslaw Radomski, CFA, Sunshine Profits’ employees and affiliates as well as members of their families may have a short or long position in any securities, including those mentioned in any of the reports or essays, and may make additional purchases and/or sales of those securities without notice.

The Dow just made another post-financial crisis rally high. To provide some further perspective to the current Dow rally, all major market rallies of the last 112 years are plotted on today’s chart. Each dot represents a major stock market rally as measured by the Dow with the majority of rallies referred to by a label which states the year in which the rally began. For today’s chart, a rally is being defined as an advance that follows a 30% decline (i.e. a major bear market). As today’s chart illustrates, the Dow has begun a major rally 13 times over the past 112 years which equates to an average of one rally every 8.6 years. It is also interesting to note that the duration and magnitude of each rally correlated fairly well with the linear regression line (gray upward sloping line). As it stands right now, the current Dow rally that began in March 2009 (blue dot labeled you are here) would be classified as well below average in both duration and magnitude. However, when compared to the most recent post-major bear market rally (i.e. the rally that began in 2002), the current rally is significantly greater in magnitude and accomplished this feat in less time.
Notes:
Where’s the Dow headed? The answer may surprise you. Find out right now with the exclusive & Barron’s recommended charts of Chart of the Day Plus
Quote of the Day
“Bulls markets have no resistance-bear markets have no support.” – anonymous
Events of the Day
August 05, 2013 – PGA Championship begins (ends August 11th)
Stocks of the Day
— Find out which stocks investors are focused on with the most active stocks today.
— Which stocks are making big money? Find out with the biggest stock gainers today.
— What are the largest companies? Find out with the largest companies by market cap.
— Which stocks are the biggest dividend payers? Find out with the highest dividend paying stocks.
— You can also quickly review the performance, dividend yield and market capitalization for each of theDow Jones Industrial Average Companies as well as for each of the S&P 500 Companies.
Mailing List Info
Chart of the Day is FREE to anyone who subscribes.
To ensure email delivery of Chart of the Day, add mailinglist@chartoftheday.com to your whitelist.
Sign up HERE to Free Chart of the Day

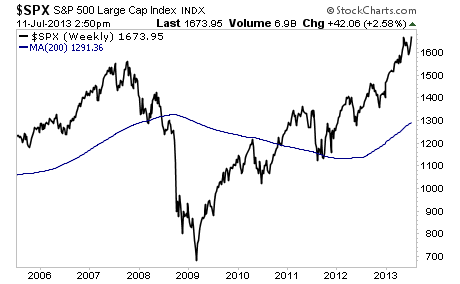
the S&P 500 is sitting a full 30% above its 200-weekly moving average
Are You Prepared For the Coming Epic Market Meltdown
Ben Bernanke has created the mother of all bubbles.
Today, the S&P 500 is sitting a full 30% above its 200-weekly moving average. We have NEVER been this overextended above this line at any point in the last 20 years.
Indeed, if you compare where the S&P 500 is relative to this line, we’re even MORE overbought that we were going into the 2007 peak at the top of the housing bubble.
We all know how bubbles end: BADLY.
This time will be no different. The last time a major bubble of these proportions burst, we fell to break through this line in a matter of weeks.
We then plunged into one of the worst market Crashes of all time.
By today’s metrics, this would mean the S&P 500 falling to 1,300 then eventually plummeting to new lows.
This is not doom and gloom. This is a fact. The Fed has created an even bigger bubble than the 2007 one.
Ed Note: Though this all sounds like terribly bad news, if you read Rick Rule’s article posted on Money Talks today you’ll find out that he and Eric Sprott made their fortunes from Bear Markets. With that in mind, I enclose the rest of Graham’s article below:
The time to prepare for this is not once the collapse begins, but NOW, while stocks are still rallying. Stocks take their time moving up, but when they crash it happens VERY quickly.
With that in mind, I’ve already urged my Private Wealth Advisory clients to start prepping. We’ve opened six targetted trades to profit from the stock bubble bursting.
We’ve also taken care to prepare our finances and our loved ones for what’s coming, by following simple easy to follow steps concerning our savings, portfolios, and personal security via my Protect Your Family,
Protect Your Savings & Protect Your Portfolio reports.
I’ve helped thousands of investors manage their risk and profit from market collapses. During the EU Crisis we locked in 72 straight winning trades and not one loser, including gains of 18%, 28% and more.
In fact, we’re currently on another winning streak having locked in nine winning trades in the last two months, including gaiins of 21% and 25%.
All for the the small price of $299: the annual cost of a Private Wealth Advisory subscription.
To take action to prepare for what’s coming… and start taking steps to insure that when this bubble bursts you don’t lose your shirt.
Yours in Profits,
Graham Summers
Economist Marc Faber Predicts Stock Market Crash : Marc Faber had a grim prediction for the Stock Market when he appeared on The Crash Proof Retirement Show® and spoke to Phil Cannella about the future of the markets. He thinks a big crash is coming soon, and that now is not the time to be investing in stocks. (in 38 seconds Marc outlines the 2 scenarios he sees)
Ed Note: 2 more short commentaries made on Monday from Marc below….
Marc Faber warns about colossal Credit Bubble in China
This Money Printing has a number of unintended consequences that will eventually be very costly
screenshot below is linked to the youtube above (its just for presentation on front page)

 Oil may hold the key to the next big move in gold. On the geopolitical front, the Iranian government’s nuclear program could trigger an attack from Israel, and that could cause oil to surge higher.
- Syria and Egypt are two more “hotspots” that could cause traders to buy oil aggressively, if military action intensifies.
- Please click here now. You are looking at the monthly oil chart, and it could be argued that a major upside breakout is now in play.
- I’ve highlighted a symmetrical triangle on that chart. The technical target is about $145, which is close to the all-time highs in the $147 area.
- If oil surges higher because of a geopolitical shock, gold is likely to follow.
- Despite the breakout, there is strong HSR (horizontal support and resistance) in the $110 – $115 area. Oil is likely to hesitate there.
- If there is no intensification of military action in Iran, Syria, or Egypt, and the US economy shows growing inflationary pressures while slowing down, value-based fund managers could move funds from the general stock market to gold.
- Monday’s retail sales report was disappointing, and today the key CPI (Consumer Price Index) report will be released, followed by the Fed’s industrial production report.
- In the eyes of mainstream fund managers, today’s reports are important economic barometers, and if economic production is disappointing, they could buy gold aggressively. That could push the price to $1300, or higher.
- I’ve suggested that traders should be sellers in the $1280 – $1340 price zone. If today’s reports cause gold to rally, book some profit.
- Please click here now. That’s the daily gold chart. Note the position of the lead line of my stokeillator. It’s risen to about the 70 level. Minor market trends tend to last for about one to three weeks. My stokeillator is arguably ideal for identifying the potential start and end of these price movements.
- In the “minor trend picture”, profit booking is the current theme, because the move to the upside is getting a little long in the tooth. When the stokeillator gives a sell signal, the price can turn lower or just drift sideways.
- In the biggest picture, events in India have become very important to the gold price. A ban on gold coin and bar sales to all citizens is in effect now, and it is being enforced.
- Almost 40% of the Indian population makes less than two dollars a day, yet they are the largest gold buyers in the world. The industrialization of India will dramatically increase the gold-buying power of Indians, and I expect that Indian demand for physical gold will exceed global mine supply by around the year 2020. Also, I believe the current coin and bar sales ban in India will be lifted fairly quickly. Here’s why:
- The government blames the current account deficit on gold imports. I blame it on foreign investment outflows and government corruption. Regardless, the Indian government seems to be working quickly to not only halt the outflows, but reverse them. Legislation is pending that should increase FDI (foreign direct investment). Foreign ownership restrictions are set to be chopped, in a big way.
- If that happens while US stock markets enter the dangerous “crash season” of September – October, institutions could pour a lot of money into India.
- Please click here now. You are looking at the daily chart of the dollar versus the rupee. As the dollar has surged, money has poured out of India, but you can see that the dollar just broke the uptrend line.
- The rupee is already stabilizing, and a stable currency, regardless of the price level, attracts foreign investment.
- As I mentioned earlier, if oil surges on a geopolitical shock, gold should leap higher too. If it falls on economic downturn news, while the rupee is stable, it will help India’s current account deficit, because the nation is a massive importer of oil. The price action of oil, up or down, is likely to be a “win win” situation for the gold community!
- India’s central bank hiked short term lending rates yesterday, further stabilizing the rupee. It’s highly likely that Indian finance minister CP Chidambaram and central bank governor Duvvuri Subbarao will gain global support for their plan to stabilize the currency, and increase FDI. The G20 central bank and finance minister meeting in Russia is only two days away, and I think Chidambaram and Subbarao will make it very clear to the rest of the G20, that India is critically important to the health of the global economy.
- While India is probably the “prime mover” of the gold price for now, events in America are also important. Ben Bernanke makes it pretty clear that he has major concerns about deflation and the US economy. The longer that QE continues, whether tapered or not, the more diluted the US dollar becomes. The weakening of the dollar is a much longer term process than most analysts realize, but it is very real.
- My recommendation every year is for US stock market investors to sell all holdings around August 7th. Stay on the sidelines until the market either crashes, or to the end of October. Historically, the cost of taking a two or three month break from the stock market has been very small, and most of the worst crashes tend to occur in September and October. Also, I think it is good for the spirit, not just for the pocketbook, to take a break from playing the stock market.
- Please click here now. This weekly chart compares the Dow to GDX (gold stocks). I’ve highlighted an RSI technical non-confirmation. It doesn’t suggest that the Dow is about to crash, but it does suggest that investors may be wise to sell the Dow and buy gold stocks.
- Please click here now. You are looking at the daily GDX chart. Note the hesitation at $25, highlighted with a blue HSR line. Also, there may be a bullish wedge pattern forming; note the black trend lines that are converging. The technical action on this short term chart adds weight to the argument that gold stocks could be the best asset to hold, going into stock market crash season!
Special Offer For Website Readers: Please send me an Email to freereports4@gracelandupdates.com and I’ll send you my free “Battle Of The Metals!” report, comparing the relative merits of gold, silver, platinum, and palladium!
Thanks!
Cheers
St
Note: We are privacy oriented. We accept cheques. And credit cards thru PayPal only on our website. For your protection. We don’t see your credit card information. Only PayPal does. They pay us. Minus their fee. PayPal is a highly reputable company. Owned by Ebay. With about 160 million accounts worldwide.
Written between 4am-7am. 5-6 issues per week. Emailed at aprox 9am daily.
Email: stewart@gracelandupdates.com
Rate Sheet (us funds):
Lifetime: $799
2yr: $269 (over 500 issues)
1yr: $169 (over 250 issues)
6 mths: $99 (over 125 issues)

-
I know Mike is a very solid investor and respect his opinions very much. So if he says pay attention to this or that - I will.
~ Dale G.
-
I've started managing my own investments so view Michael's site as a one-stop shop from which to get information and perspectives.
~ Dave E.
-
Michael offers easy reading, honest, common sense information that anyone can use in a practical manner.
~ der_al.
-
A sane voice in a scrambled investment world.
~ Ed R.
Inside Edge Pro Contributors

Greg Weldon

Josef Schachter

Tyler Bollhorn

Ryan Irvine

Paul Beattie

Martin Straith

Patrick Ceresna

Mark Leibovit

James Thorne

Victor Adair