
Stocks & Equities
 ….Worse Than 2007.
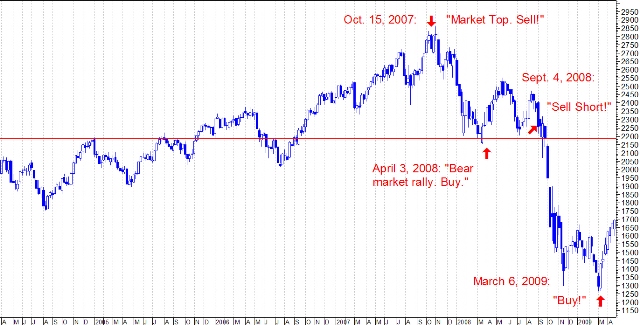
This predicition is coming from the man who successfully predicted the huge 54% 17 month Crash of 2008 when the Dow fell from its its peak of 14164 on October 9, 2007 to 6469 on March 6, 2009.
Click on image for larger view
Schiff: We’re Heading For A Crisis Worse Than 2007
Washington is engaged in a massive “campaign” to make Americans believe the economy is in recovery. But in reality the United States is at the brink of a devastating economic crash that will cause catastrophic market losses and impoverish millions.
Peter, the best-selling author and CEO of Euro Pacific Capital delivered this frightening warning to investors in a recent interview on CCTV.
“The problem with politicians is they don’t want to level with the voters and tell them how bad the economy really is and what the cure for the disease is,” Schiff said.
Click to view a larger image
The “disease” Schiff refers to is a toxic combination of our massive $16.4 trillion debt and the Fed’s continued devaluing of the dollar through its controversial 7-year long “easing” program.
The Fed is currently purchasing $85 billion a month in Treasury and mortgage bonds, a form of stimulus.
President Obama and like-minded politicians claim this stimulus has pushed the economy forward, boosting GDP and keeping inflation low.
But Schiff says “it’s another lie.”
In fact, according to Schiff, the government has done nothing more than create a “phony” economy that is “completely dependent on the ability to borrow more money that we can’t pay back.”
“The Fed knows that the U.S. economy is not recovering,” Schiff said. “It simply is being kept from collapse by artificially low interest rates and quantitative easing. As that support goes, the economy will implode.”
“The crisis is imminent,” Schiff said. “I don’t think Obama is going to finish his second term without the bottom dropping out. And stock market investors are oblivious to the problems.”
Schiff charged Washington with cooking the books on its latest GDP and inflation figures.
He cites the government’s recent move to raise GDP 3% by including items never calculated before and that “no other country on the planet counts.” These include such intangibles costs and royalties from books, magazines iTunes song and movies.
The Financial Times reported this strange maneuver as the “U.S. Economy’s “Hollywood Makeover.”
“That’s what the government does,” Schiff said. “Whenever they don’t like the results, they change the methodology for calculating those results.”
“Maybe some of our creditors will be dumb enough to believe the hype,” Schiff added.
“The fact is, Schiff said. “We’re broke. We owe trillions. Look at our budget deficit; look at the debt to GDP ratio, the unfunded liabilities. If we were in the Eurozone, they would kick us out.”
Schiff points out recent market gains, with the Dow topping 14,000 on its way to setting record highs, is yet another lie giving investors a false sense of security.
“It’s not that the stock market is gaining value… it’s that our money is losing value. And so if you have a debased currency… a devalued currency, the price of everything goes up. Stocks are no exception,” he said.
“I think we are heading for a worse economic crisis than we had in 2007,” Schiff said. “You’re going to have a collapse in the dollar…a huge spike in interest rates… and our whole economy, which is built on the foundation of cheap money, is going to topple when you pull the rug out from under it.”
In August 2006, when the Dow was hitting new highs nearly every day, Schiff said in an interview: “The United States is like the Titanic, and I’m here with the lifeboat trying to get people to leave the ship… I see a real financial crisis coming for the United States.”
Just over a year later, the meltdown that became the Great Recession began, just as Schiff predicted.
He also predicted the subprime mortgage bubble burst, nearly a year before the real estate market fully crashed.
His recent warnings, however, have been even more alarming. Will they also prove to be true?
In his most recent book, “The Real Crash” How to Save Yourself and Your Country“, Schiff writes that
when the “real crash” comes,” it will be worse than the Great Depression.
Unemployment will skyrocket, credit will dry up, and worse, the dollar will collapse completely, “wiping out all savings and sending consumer prices into the stratosphere.”
Schiff estimates this “cancer” could consume a trillion dollars from consumers this year.
“Today we’re the world’s greatest debtor nation. Companies, homeowners and banks are so highly leveraged, rising interest rates will be devastating.”
According to polls, the average American is indeed sensing danger. A recent survey found that 61% of Americans believe a catastrophe is looming – yet only 15% feel prepared for such a deeply troubling event.
Editor’s Note: As a service to Money Morning readers, we’ve arranged a way for you to get a copy of Peter Schiff’s new best-selling book, The Real Crash: How To Save Yourself And Your Country, for free, including shipping. The book shows in plain language exactly what economic dangers ordinary Americans face right now and how you can protect yourself. Please go here for your free copy.
Is Devastation The Ultimate Cure?
Despite its bleak outlook, Schiff’s book has become a real wake-up call for millions of readers.
While Schiff’s predictions can be grim, he also offers step-by-step solutions that average Americans can follow to protect their wealth, investments and savings.
According to Schiff, “the crash and what follows” can be beneficial. But only for those who understand beforehand what is happening and have time to prepare for the devastation.
“All we can do now is prepare for the crash,” Schiff said. “If we brace ourselves properly and control the impact, we will survive it.”

 We have officially entered into uncharted territory. As the markets continue to surge higher, as earnings falter, valuations have once again reached extremes. As my friend Doug Short recently penned:
“Essentially we are in ‘uncharted’ territory. Never in history have we had 20+ P/E10 ratios with yields at the current level, although as I type this, the 10-year yield is at 2.69%, which is 1.26% above its all-time low set in July of last year. The closest we ever came to this in US history was a seven-month period from October 1936 to April 1937. During that timeframe the 10-year yield averaged 2.67%. How did the market fare? The S&P Composite hit an interim high (based on monthly averages of daily closes) in February 1937. The index plunged 44.9% over the next 15 months.
If we look to the Dow daily closes during that period, the index hit an interim high on March 3, 1937 and fell 49.1% to an interim trough on March 31, 1938 — 13 months later.
What can we conclude? As I said above, we’re in ‘uncharted’ territory. Despite increasing references to near term tapering of QE, many analysts assume that continued Fed easing will keep yields in the basement for a prolonged period, thus continuing to promote a risk-on skew to investment strategies despite weak fundamentals.
On the other hand, we could see a negative market reaction to a growing sense that Fed intervention has its downside, especially if Treasury yields continue to rise despite FOMC policy. The recent trend and volatility in the Nikkei in the wake of Japan’s massive monetary intervention could give investors second thoughts about US equities.
We are indeed living in interesting times.”
With the last comment I do readily agree. We live in interesting times, and much like “Alice In Wonderland,” we are indeed all mad here.
This week we will review the markets and our allocation models.
>> Read More. Download This Weeks Issue Here.
Lance Roberts is the General Partner & CEO of STA Wealth Management, Host of the “Streettalk Live” Daily Radio Show (streamed live at www.streettalklive.com), and Chief Editor of the X-Report and the Daily X-Change Blog.
Follow me on Twitter: @streettalklive
Can It Get Any Better Than This?
A Korean Black Swan?
Maine, Montana, San Antonio, and Bismarck
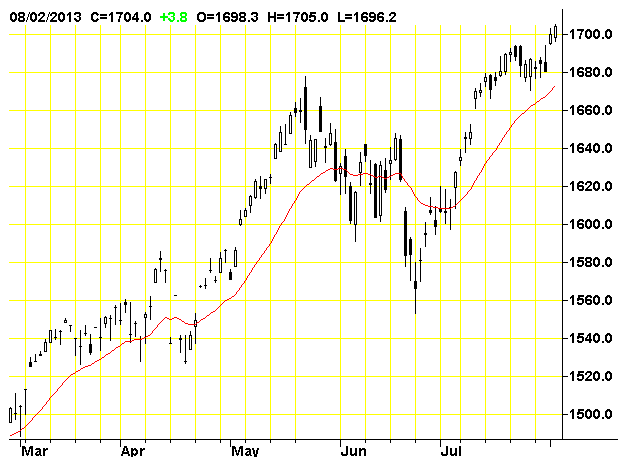
What in the world is going on?! As I write this letter from the Maine woods, the S&P 500 has just cleared 1,700 for the first time. The German DAX continues to set all-time highs above 8,400. The United Kingdom’s FTSE 100 is quickly approaching its 1999 record high of 6,930, and its mid-cap cousin, the FTSE 250, just broke through to its all-time level above 15,000. And last but not least, Japan’s Nikkei 225 is extending its gains once more, toward 14,500. This weekend I am sitting around with some of the smartest economic and trading minds in the country. At Leen’s Lodge, where we’re fishing and eating where our phones don’t work, the question on our minds is, how long can this run go on? The debates can get intense in a room full of strong opinions.
So, with a little help, I did some research on what our forward-looking prospects are for the markets. Let me take this opportunity to introduce a new name to readers, one that will become familiar over the next few years. I have gotten to know Worth Wray, a young economist (though I should say that, as I stare 64 in the face, a lot of people are looking young these days) who has really impressed me with the breadth of his knowledge and insights. He was the former portfolio strategist for my good friends at Salient down in Houston, and they were kind enough to let me entice him to come to Dallas to work with me. This is a big move for both of us, and I am finding that it’s one I should have undertaken a long time ago. Worth is really going to help me expand my abilities to do research and present my thoughts to you. I asked him a few questions, and he helped me tee up this week’s letter. Plus, we’ll look across the Pacific, and I’ll share some though ts I’ve had about an interesting black swan that could be developing in the Korean Peninsula. Let’s get started!
Can It Get Any Better Than This?
To many investors, developed markets appear healthier and stronger than they have in years. Major equity markets are rallying to record highs; corporate credit spreads are tight versus US Treasuries and getting tighter; and broad measures of volatility continue to fall to their lowest levels since 2007.
This kind of news would normally point to prosperity across the real economy and call for a celebration – but prices do not always reflect reality. Moreover, the combination of high and rising valuations, low volatility, and a weakening trend in real earnings growth is a proven recipe for poor long-term returns and market instability.
Let’s take the S&P 500 as an example. It returned roughly 42% from September 1, 2011, through August 1, 2013, as the VIX Index fell to its lowest levels since the global financial crisis. Over that time frame, real earnings declined slightly (down about 2% through Q1 2013 earnings season), while the trailing 12-month price-to-earnings (P/E) ratio jumped 44%, from 13.5x to 19.5x. That means the majority of the recent gains in US equity markets were driven by multiple expansion in spite of negative real earnings growth. This is a clear sign that sentiment, rather than fundamentals, is driving the markets higher.
Of course, the simple trailing 12-month P/E ratio can be misleading at critical turning points if you are trying to handicap the potential for long-term returns. For example, the collapse in real earnings during the global financial crisis sent the S&P 500’s trailing P/E multiple through the roof by March 2009. So, while trailing P/E is a useful tool for understanding what has already happened in the market, the “Shiller P/E” is far more useful for calculating a reasonable range of expected returns going forward. This approach won’t help you much with short-term market timing, but current valuations have historically proven extremely useful in forecasting long-term returns. In his bookIrrational Exuberance (2005), Robert Shiller of Yale University shows how this approach “confirms that long-term investors – investors who commit their money to an investment for ten full years – did do well when prices were low rel ative to earnings at the beginning of the ten years. Long-term investors would be well-advised, individually, to lower their exposure to the stock market when it is high … and to get into the market when it is low.”
As you can see in Figure 6, compared to the more common trailing 12-month P/E ratio in Figure 5, the Shiller P/E metric essentially smooths out the series and helps us avoid false signals by dividing the market’s current price by the average inflation-adjusted earnings of the past ten years. Historically, this range has peaked and given way to major market declines at around 29x on average (or 26x excluding the dot-com bubble), and it has bottomed in the mid-single digits. Not only does today’s Shiller P/E of 24x suggest a seriously overvalued market, but the rapid multiple expansion of the last two years in the absence of earnings growth suggests that this market is also seriously overbought.
John Hussman helps us keep current valuations in historical perspective:
The Shiller P/E is now 24.4, about the same level as August 1929, higher than December 1972, higher than August 1987, but less extreme than the level of 43 that was reached in March 2000 (a level that has been followed by more than 13 years of market returns within a fraction of a percent of the return on Treasury bills – and even then only by revisiting significantly overvalued levels today). The Shiller P/E is presently moderately below the level of 27 at the October 2007 market peak. It’s worth noting that the 2000-2001 recession is already out of the Shiller calculation. Moreover, looking closely at the data, the implied profit margin embedded in today’s Shiller P/E is 6.3%, compared with a historical average of only about 5.3%. At normal profit margins, the current Shiller P/E would be 29.
While it may be impossible to accurately predict when this policy-driven market will break, history suggests it would be very reasonable for the secular bear to eventually bottom at a P/E multiple between 5x and 10x, opening up one of the rare wealth-creation opportunities to deploy capital at truly cheap prices. Some of these technical details are rather dry, but I hope you’ll focus on the main idea: We are not talking about the potential for a modest 20% to 30% drawdown in the S&P 500. If history is any indication, we are talking about the potential for a 50%+ peak-to-trough drawdown and ten-year average annual returns as bad as -4.4%, according to the chart above from Cliff Asness at AQR. Such a result would fall in line with somewhat similar deleveraging periods such as the United States experienced in the 1930s and Japan has experienced since 1989. There is no way to sugarcoat it: too much equity risk can be unproductive and even destructive in this kind of economic environment.
But where there is danger, there is also opportunity. This is a terrific time to take some profits and diversify away from the growth-oriented risk factors that dominate most investors’ portfolios. Instead of concentrating risk in one asset class or one country, investors can boost returns and achieve more balance by taking a global view, by broadening the mix of core asset classes, and by weighting those return streams to achieve balance across potential economic outcomes (rather than trying to predict the future). Since equities and credit are essentially a directional bet on positive economic growth and benign inflation, you have a lot to gain from diversifying into other core market risks: commodities, which thrive when inflation, or more specifically expected inflation, is rising; and nominal safe-haven government bonds, which thrive as inflation gives way to deflation and the oth er assets typically decline. While each group of asset classes responds to economic conditions differently and exhibits low correlations to the others, each of them tends to offer similar risk-adjusted returns over long periods of time, thus warranting constant inclusion in any core portfolio.
It also makes sense to embrace truly diversifying alternative strategies that are either less correlated or negatively correlated. When valuations are expensive across the board, momentum-based strategies like managed futures can be a fantastic addition to a portfolio. Aside from government bonds, momentum is the only easily accessible strategy that tends to become more negatively correlated with broader markets during times of extreme stress and tends to deliver outsized returns when your other investments are losing money.
Of course, combining the asset classes into one portfolio is the hard part, but research going back to the early 1970s suggests that broadening this mix of core assets – so that you have some element of your portfolio that responds positively to every potential economic season – and managing the relative allocations to each economic scenario may be your biggest opportunity to add value in the investing process.
You have a lot to gain from diversifying as broadly as possible, eliminating unrewarded costs, reducing your reliance on equity risk, and reining in the emotional mistakes that often lead investors to dramatically underperform. Remember, in a world characterized by deleveraging, changing demographics in aging populations, financial repression, and increasingly experimental monetary policy, every basis point counts and anything can happen.
With that, let’s end our discussion with a few words of advice from the world’s largest and arguably most successful hedge fund manager, Ray Dalio:
What I’m trying to say is that for the average investor, what I would encourage them to do is to understand that there’s inflation and growth. It can go higher and lower and to have four different portfolios essentially that make up your entire portfolio that gets you balanced. Because in every generation, there is some period of time, there’s a ruinous asset class, that will destroy wealth and you don’t know which one that will be in your life time. So the best thing you can do is have a portfolio that is immune, that is well diversified. That is what we call an all-weather portfolio. That means you don’t have a concentration in that asset class that’s going to annihilate you and you don’t know which one it is.
A Korean Black Swan?
Last week I was in Newport, Rhode Island, at the Naval War College, where I participated in a summer study group focused on possible futures and how they might affect the strategy of the US Defense Department. The discussions were wide-ranging and mind-expanding, at least for me. As readers know, I believe that Japan has begun a long-term process of continually devaluing its currency. For reasons I have written about at length in previous letters, I think the yen could go to 200 to the dollar in the next five years. I don’t see a precipitous move, simply a steady erosion as Japan tries to bring back inflation and export its deflation.
While the yen at its current valuation is not a particular problem for the rest of the world, when it hits 120 we will start to see raised eyebrows and political speeches from the countries most affected. At 140 we could start to see serious reactions.
One of the countries that I think is put into a most difficult situation is South Korea. Their options for responding to a weakening yen are quite limited. If they respond by printing more of their own currency, they are likely to engender a debilitating inflation, which is of course not a good thing. Protectionism will have little real effect vis-à-vis Japan. Remember that the Japanese yen was 357 to the dollar about 40 years ago. The Japanese watched their currency rise by almost 400% in the decades since. The only real response available to them was to simply become more competitive and more productive as their currency got stronger, and to their great credit they did.
Honing their competitive edge may also be the only real option for South Korea. But it is not an easy one, of course, and you will hear lots of complaints from Korean politicians and businessmen. Not an easy environment, to be sure.
Now let’s shift our focus to North Korea. Everyone (including your humble analyst) is worried about the isolationist regime in North Korea having access to nuclear weapons and the ability to deliver them on missiles. But a few conversations I had this past week led me to think there is another scenario we should consider.
A side conversation at the study group began with an observation by a senior officer about the ability of the North Korean military to actually project power. As this information is nothing more than what you can find in the newspapers, I feel comfortable discussing it here. Everyone knows that North Koreans have been malnourished for multiple decades. Studies suggest that North Koreans may be up to three inches shorter than South Koreans and have diminished IQs because of malnourishment as children. The latter is a known effect on human beings anywhere who are subjected to a starvation diet. The North Korean population has suffered from severe diet restriction for decades.
How capable is the North Korean military of actually mounting an offensive when their soldiers are simply not physically able to withstand the pressures of combat? I was also able last week to visit with one of the great geopolitical strategists of our time, Professor Ian Bremmer of Columbia, who is the president and founder of Eurasia Group, with some 100 geopolitical analysts working for him. I shared with him my concerns about the Korean peninsula. He immediately said that he was more worried about the Korean peninsula than any other part of the world, including the Middle East. One of the interesting things that he shared is that an increasing number of cell phones are being smuggled into North Korea from China and that the North Koreans are beginning to get the real story about the world rather than just the propaganda fed to them by their government.
While there is little ability for the North Korean population to actually stage a revolution, as they do not have the weapons and hungry people really have difficulty mounting military operations, there is the possibility of the country becoming increasingly difficult to manage. Combine that with the potential for a disastrous food-production year, and the potential for the collapse of the government is not all that far-fetched.
There were not many people forecasting the collapse of the USSR in 1987. Yet as we look back, the confluence of causes that resulted in its collapse seems rather obvious. Probably, the current dictatorship will maintain its stranglehold on North Korea. That is the tendency with repression and tyranny – witness Cuba and any number of other countries. But one cannot dismiss the possibility of a collapse of the North Korean state.
If that were to happen it would be a humanitarian disaster. In the long run it might be better for the North Korean people, but in the short run it would be catastrophic. It is not unreasonable to expect that South Korea would have to do the bulk of the heavy lifting, especially after the first year or so. And should the world no longer have to focus on the ability of North Korea to create mischief with nuclear weapons, North Korea could soon become page 16 news.
No matter how positively you would want to view Korean unification, the process would be enormously expensive for South Korea. Assimilating a population long challenged by hardship into a new reality, not to mention incorporating it into a modern economic model, is a daunting challenge. I think the task would be more difficult and more expensive on a per-capita basis than the unification of Germany.
And this could happen while the attention of South Korea is focused on dealing with the devaluation of the yen and the need to become progressively more competitive to maintain its export and business model. There is also the possibility of massive refugee movements into China. That is a significantly different issue than worrying about a million-man army crossing the DMZ into South Korea.
I’m not saying this will happen, but it is a possibility we need to keep an eye on.
Maine, Montana, San Antonio, and Bismarck
I’m at Leen’s Lodge in Grand Lake Stream, Maine, at “Camp Kotok,” with about 50 people from all areas of the financial sector: money managers, traders, writers, real economists (as opposed to your humble analyst), financial media, Federal Reserve economists, and other guests. Old friends whose names are familiar to my readers have become regulars here – people like Paul McCulley, Barry Ritholtz, Jim Bianco, David Rosenberg, Mike McKee of Bloomberg, Bill Dunkelberg (chief economist of the National Federation of Independent Businesses), Phillipa Dunne of the Liscio Report, and others too numerous to mention. David Kotok of Cumberland Advisors organizes the event and masterfully crafts the mix of guests and the agenda for the long weekend. Some people have referred to this group as the Shadow Fed, but that is far too serious a moniker for what really happens here. This is one of the more fascin ating discussion groups I ever get to participate in, and I always learn a great deal. I should note that at least ten of our group are women, which makes it somewhat unusual for a financial-industry gathering, but it’s a trend I would like to see more of.
This is the seventh year I’ve attended, and each year I’ve come with my youngest son, Trey. He was 12 the first year we came and is now 19. He has grown up with these men and women. Being with my son each year has made this a very special week in my life. Each year’s event is an emotional and very personal measuring stick as I watch him grow up. The annual competition to see who among us will catch the most fish is a small part of the experience, but Trey does not let me forget that he has won for six years in a row. After our first rain-soaked half-day of fishing, I am ahead by one, but there are two more full days ahead. Watching him grow up here is very special. There is a part of me that hopes he catches at least one more fish than the old man. But I will never tell him that.
Grand Lake Stream is in the middle of Washington County, Maine, which is about the size of Connecticut yet has only 30,000 people. As it turns out, it is also the poorest county east of the Mississippi. Who knew? Local officials assure me that our gathering of economists is one of the biggest financial events for the area each year. In a few weeks they are going to announce what is a fascinating economic experiment. The state of Maine is going to make the entire county an enterprise zone. They are going to eliminate all taxes in the county – every last corporate, personal, and sales tax. As one former state official told me tonight, the state gets such a small amount of taxes from this county that eliminating the taxes won’t affect the state budget whatsoever. And the poverty here is quite real. I will give you an update, down the road, on whether the Washington County experiment makes a difference. My philosophical bet is that it will. In a few years the results will not be just philosophical but something we can all see.
As long as I keep getting an invitation to return, I intend to spend the first weekend of every August in Maine. It is truly a slice of heaven and one of the gatherings I most look forward to every year.
We go back home on Monday, and then the next week I’m off to Montana with Darrell Cain for a week to read, relax, and gather my thoughts. At the end of the month I go to San Antonio for the World Science Fiction Convention (WorldCon), where I get to play groupie for a few days. Then in the middle of the month I will go to Bismarck, North Dakota (details later), and hopefully make a side trip to South Dakota, which will allow me to finally say that I have been in all 50 states.
It is time to hit the send button, as the group is gathering for Lobster Night. Charles Driza, the owner of Leen’s Lodge, and his staff provide fabulous gourmet meals. And the conversation is even better. Have a great week and find a few friends and family to be with. That time is an investment where the valuation is always rising.
Your soaking up the beauty of Maine analyst,

John Mauldin
subscribers@MauldinEconomics.com
Copyright 2013 John Mauldin. All Rights Reserved.
European stocks advanced for a sixth day, the longest winning streak this year, as services output shrank at a slower pace than initially estimated last month. U.S. index futures were little changed, while Asian shares fell.
In my article, “Why A Stock Market Bubble Is Forming Right Now” written in early May, I described how unprecedented levels of excess liquidity combined with declining liquidity preference were pointing to a rising probability of the formation of a stock market bubble. In mid-May, I followed this up with an article entitled, Beware Long-Term Damage From Stock Market Bubble Forming Now, in which I said the following:
The thesis of this article is that given the current course of events, broad stock market indices such as the S&P 500, Dow Jones Industrials and Nasdaq could very well rise by 30% or more within the next 6-12 months. However, such spectacular gains, far from acting as a harbinger of economic health (as most assume), would only be symptomatic of highly damaging relative price distortions that are ravaging the US economy from within.
Some investors may be able to profit from such circumstances on an intermediate term time frame (0-12 months) even if the long-term implications are less sanguine.
In both of these articles, and in the comment sections I made two things clear:
1) Stock valuations were not currently indicative of a bubble.
2) It has become increasingly likely that stock prices will rise sharply in the next 12 months in such a manner and to such an extent that would be indicative of a bubble.
In this article, I provide a progress report on this thesis.
Valuations Becoming A Bit Stretched, Not Yet Near Bubble Territory
Based on an S&P 500 index level of 1690, the forward 12-month P/E based on IBES bottom up consensus for operating earnings is 15.1. This compares to the historical average since 1976 (inception date for IBES estimates) of 12.9.
Based on trailing 12-Month (TTM) EPS, the current P/E is at 18.47 versus long-term historical average since 1871 of 15.5.
These two numbers cannot be entirely taken at face value as indicators that the stock market is dangerously overvalued. I will cite only three reasons here. First, the forward P/E average is downward biased due to the start date as well as by inflation-induced earnings distortions that artificially inflated GAAP earnings during the mid 70s and early 80s. Second, with respect to the TTM P/E average, for various reasons I cannot expand upon here, I question the validity of historical P/E data prior to 1960 for purposes of comparisons with current P/Es. In this regard, suffice it for now to say that the world is radically different today than it was between 1871 and 1914 and than it was during the war eras of 1914 through 1960. Third, current P/Es should not be compared to aggregate averages, but to historical P/Es at similar stages of the macroeconomic and earnings cycles. Finally, other valuation methods are superior to simple historical P/E comparisons and these other methodologies should be taken into account when valuing stocks.
Without entering into details regarding all of the various methodologies that should be utilized to value stocks, it is my view that stock valuations are currently within or even slightly above a broad range that could be considered “normal.” I would characterize valuations as starting to become only slightly “stretched” – sort of like when you first start to feel a bit of tension when stretching a rubber band. Valuations are NOT yet at levels that can be considered indicative of a bubble.
It is my position that a bubble is forming, not that a bubble is yet fully formed. It is also my position that it is most useful to predict a bubble, not to merely announce one after it has already been formed – much less after it has already burst. Finally, when I speak of “prediction” I use this term in an expected return context. – i.e. the probability distribution indicates that the potential rewards of acting upon my bubble thesis outweigh the potential risks.
Will The Fed Allow A Bubble To Inflate?
A critical element of my thesis is that while the Fed does not desire asset bubbles to form, it will as a practical matter be unable to prevent them from forming under current circumstances, given its dual mandate to promote price stability and full employment.
I believe that many officials within the Fed are keenly aware of the risk of asset bubble formation. Indeed, I believe that it was this concern rather than any concerns about CPI inflation that drove the Fed to initiate its warnings about “tapering.”
Having said this, the prevention of asset bubbles is of secondary importance to the Fed’s monetary policy considering both its legal mandate as well as the political realities within which the institution must operate. When push comes to shove, if the Fed must choose between monetary accommodation to facilitate the reduction of high unemployment and asset bubble prevention, it will always chose the former so long as the Fed believes that consumer price inflation is contained. If core measures of consumer price inflation were accelerating above the Fed’s targeted levels and/or unemployment were at low levels, the Fed would have sufficient legal and political “cover” to proceed to act affirmatively to prevent asset bubbles via its broad and somewhat vague mandate to promote financial stability. As it stands, in the face of high unemployment and low inflation, the Fed is virtually obliged by its legal mandate as well as political realities to maintain an accommodative monetary stance.
Therein lies the risk of asset bubble formation. The Fed can and will try to “jaw-bone” to the effect that it is concerned about the formation of asset bubbles. However, as a practical matter, as long as the Fed fails to withdraw the unprecedented liquidity it has injected into the system, it will be serving as an “enabler” of asset bubble formation.
And to be clear, “tapering” does not involve any withdrawal of excess liquidity from the system – it merely involves reducing the pace at which excess liquidity is being added to the system. Therefore, the policy of “tapering” is functionally an “enabler” of asset bubble formation.
If It Is Not Yet A Bubble, How Can One Know One Is Forming?
In a future article, I will lay out a formal typology for identifying a fully-formed stock market bubble. However, I will preview my belief that bubbles are not merely a matter of extreme overvaluation (as some suppose). Various other fundamental, technical and psychological elements must be considered in determining the existence of an asset bubble. In this regard, the following questions would be part of a “checklist” to be consulted:
1. Fundamentals. Does the change in fundamentals such as GDP growth, earnings growth and real interest rates support the magnitude of stock price increases above and beyond established historical means?
2. Technical. Is the price action normal, or does it indicate abnormal exuberance?
3. Psychological. Are there signs that investors are becoming too complacent about risk?
I will address these questions briefly.
First, in the past 8-9 months, expectations of GDP and earnings growth have been steadily declining while real interest rates as indicated by the yields of long-term treasury bonds (TLT) and TIPS (TIP) have been rising. This notable deterioration in fundamentals has occurred at the same time that stock valuations have been rapidly rising above their historical mean levels (although still below bubble levels). This notable disconnect between the change in fundamentals and the change in stock prices is a sign of potential of a bubble formation.
Second, even within the context of a prolonged uptrend, normal price action is characterized by volatile and seemingly irregular patterns of rises and falls. Rises will be followed by periodic and seemingly unpredictable “back-filling” and “consolidation” prior to resuming an uptrend. The rise in the stock market since last fall has been extraordinary in the slope of its ascent, its persistence, the extraordinary decline in volatility and lack of correction or consolidation. This abnormal price action is indicative of a potential bubble in formation.
Third, asset allocation data indicate that many retail and institutional investors remain cautious in their allocation to equities relative to historical norms. This is an indication that a bubble has not yet fully formed. However, various flow of funds data indicate that the caution exhibited by previously wary retail investors is now in the process of being “thrown to the wind.” Furthermore, there is a narrative that is becoming conventional wisdom that provides a clear warning sign of bubble formation: The “nowhere else to go” narrative. Just do a Google search of “nowhere else to go stocks” and you will see just how prevalent this meme has become. This is a clear indicator that many investors are investing in equities because they feel that they do not have a “choice,” not because they have rationally determined that such investment is warranted based on fundamentals. This building psychological pressure driven by fear and greed is an indicator of potential bubble formation.
Taken individually, none of these indicators is sufficient to confirm the formation of a stock market bubble. However, taken in combination, these three indicators, along with the fact that valuations have risen rapidly above historical means, support the thesis that a stock market bubble may be forming.
Conclusion
Stocks’ values are not in bubble territory at this time. However, there are a number of fundamental, technical and psychological indicators that strongly support the thesis that a bubble is currently in the process of forming.
How should investors deal with this? The correct approach will vary from individual to individual. Aggressive traders may choose to “ride the bubble” hoping to bail out of the market right before the bubble bursts. Other investors may choose to wait this out, just as many waited out the tech-led bubble in 1999 or the housing and mortgage-securities led bubble in 2007, based on the premise that better long-term buying opportunities will present themselves in the aftermath of the bursting of the bubble. Both approaches are potentially valid.
My own position is clear and remains unchanged since August of 2012: Probabilities favor further sharp rises in stock prices in the intermediate term, defined as the next 0-12 months. Stock indices such as the S&P 500, Dow Jones Industrial Average and the Nasdaq and their respective ETFs such as (SPY), (DIA) and (QQQ) could rise by 20%-30% or even more during this time. Furthermore, since May I have emphasized that the risk of bubble formation further skews reward/risk to the upside on an intermediate term basis. At the same time, it is my view that a scenario of rising asset prices driven by excess liquidity and declining liquidity preferences, far from constituting a positive indicator of economic health, is symptomatic of long-term pathologies that are developing beneath the surface in economic and financial conditions. There is no contradiction whatsoever in these two outlooks; they are indeed fundamentally linked. Investors should not confuse predictions about the likely level of stock prices in the intermediate term with predictions about long-term economic conditions. Investors should plan their asset allocation accordingly.
About James Kostohryz
 James Kostohryz has accumulated over twenty years of experience investing and trading virtually every asset class across the globe.
Kostohryz started his investment career as an analyst at one of the US’s largest asset management firms covering sectors as diverse as emerging markets, banking, energy, construction, real estate, metals and mining. Later, Kostohryz became Chief Global Strategist and Head of International Investments for a major investment bank. Kostohryz currently manages his own investment firm, specializing in proprietary trading and institutional portfolio management advisory.
Born in Mexico, Kostohryz grew up between south Texas and Colombia, has lived and worked in nine different …More

-
I know Mike is a very solid investor and respect his opinions very much. So if he says pay attention to this or that - I will.
~ Dale G.
-
I've started managing my own investments so view Michael's site as a one-stop shop from which to get information and perspectives.
~ Dave E.
-
Michael offers easy reading, honest, common sense information that anyone can use in a practical manner.
~ der_al.
-
A sane voice in a scrambled investment world.
~ Ed R.
Inside Edge Pro Contributors

Greg Weldon

Josef Schachter

Tyler Bollhorn

Ryan Irvine

Paul Beattie

Martin Straith

Patrick Ceresna

Mark Leibovit

James Thorne

Victor Adair