
Stocks & Equities
Recently we’ve been writing that another opportunity is coming to buy gold stocks. While this is still the case, the facts have changed and we have to tweak our view. The evidence argues that the mining stocks are now likely to retest their lows. Rather than that buying opportunity being days away, we now feel it is weeks away. Investors and speculators need to have more patience. In this missive we discuss why a retest is coming but why it could mark a final bottom and a tremendous buying opportunity.
The first reason I expect a retest is the current recovery has veered off historical course. At the current juncture three of the four similar recoveries (chart below) were at a new recovery high and the fourth closed at a new high next week. Simply put, last week was the turning point. This is confirmed by the stocks slicing through their 50-day moving averages rather than holding.
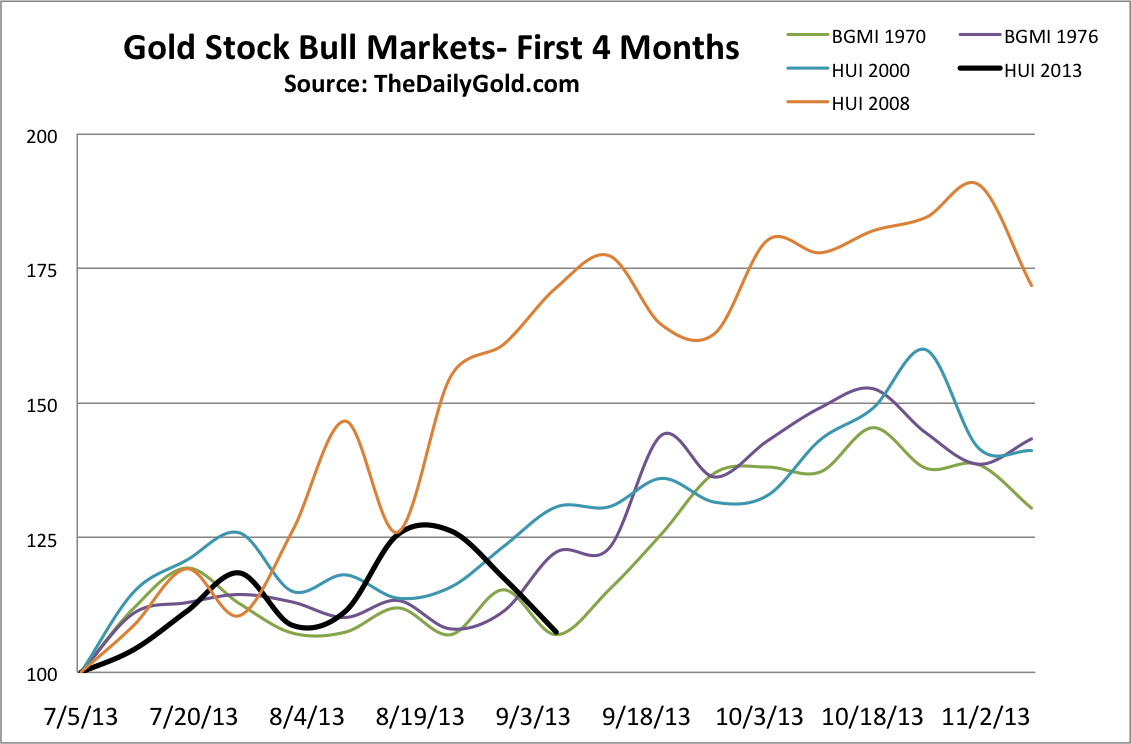
Second, the monthly chart has also veered off course. Until the end of August, the June to August pattern resembled that of the October to December pattern in 2008. However, gold stocks reversed course at the end of August and are down 9% this month. This is not the type of action you see following a major bottom.
The third point is that I made an error in my last editorial. In 1976 Gold made a V shaped bottom because it declined for 18 months without any multi-month interruption. Sure, precious metals have been extremely oversold as the current bear market is two years old. However, I neglected the obvious fact that there was a huge reprieve in 2012. Gold rallied back to $1800 and many stocks reached new all-time highs. From this vantage point, precious metals have been very oversold for less than a year and thus not enough to produce a bottom without a retest.
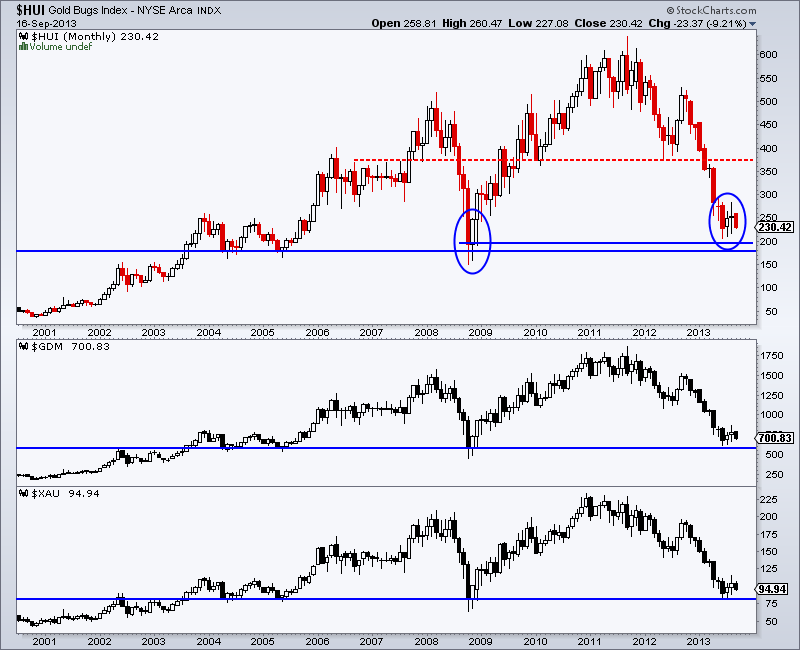
Hours before the late June bottom I penned an editorial discussing why I felt a major bottom was imminent. Bearish sentiment was rampant. The gold stocks were nearing 9-year support. Moreover, the large caps had lost about two-thirds of their value. My historical analysis showed that only one bear market exceeded 70% and that was the cyclical bear which followed the end of the 1980 bubble and a 20-year bull market in gold stocks.
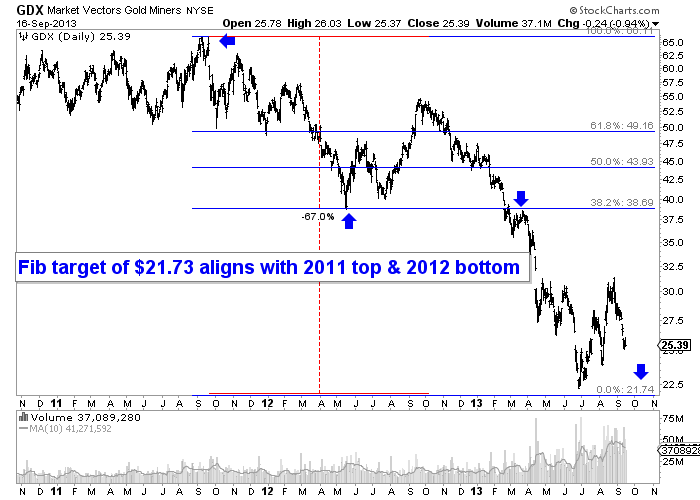
Furthermore, the gold stocks had a nearby Fibonacci target that aligned perfectly with the 2011 top, 2012 bottom and the start of the 2013 crash. That target is within 1% of the late June low. See the chart below.
The points mentioned above don’t get thrown out the window just because the market has failed to breakout. They are still as valid as they were a few months ago. The fact that a retest is coming doesn’t invalidate those points.
Below is a sketch of how things could potentially play out over the coming months. I say potentially because no one can predict the future. We can analyze history, tendencies and probabilities to come up with a reasonable guess. Given the evidence, I find it reasonable that the sector is not going to breakout anytime soon. At the same time, I find it unreasonable to expect the equities (especially GDXJ and SIL) to make new lows.
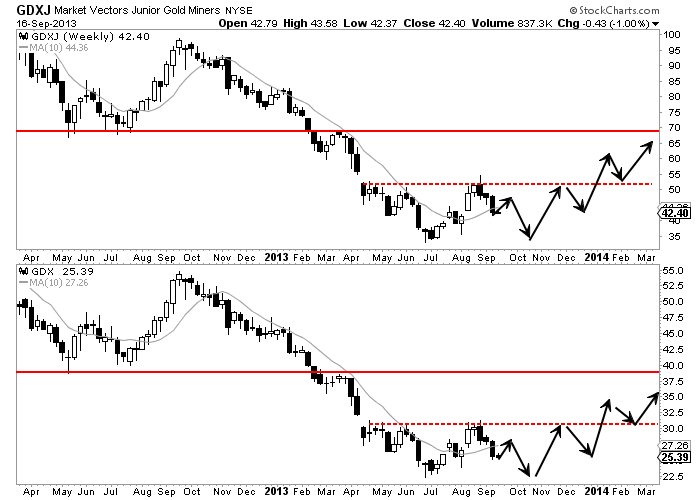
Near-term goals should be to make sure you are hedged if you are heavily long and to make sure you have some cash to take advantage of the final bottom which could occur in the next month or so. Note that the major bottom in 2000 occurred in November while the 2008 low came in late October. I guess the calendar is ripening for another major bottom. Of note is that GDXJ and SIL are in stronger shape than GDX. GDXJ declined 79% and recently rebounded 63%. SIL declined 65% and recently rebounded 55%. Those rebounds occurred in only two months! Just imagine the gains we could see after this retest. Readers are advised to watch closely and spot the companies which show the most strength during this retest. If you’d be interested in our analysis on the companies poised to lead this new bull market, we invite you to learn more about our service.
Good Luck!
Jordan Roy-Byrne, CMT

While the “bounce” exceeded previous expectation levels, due to a greater
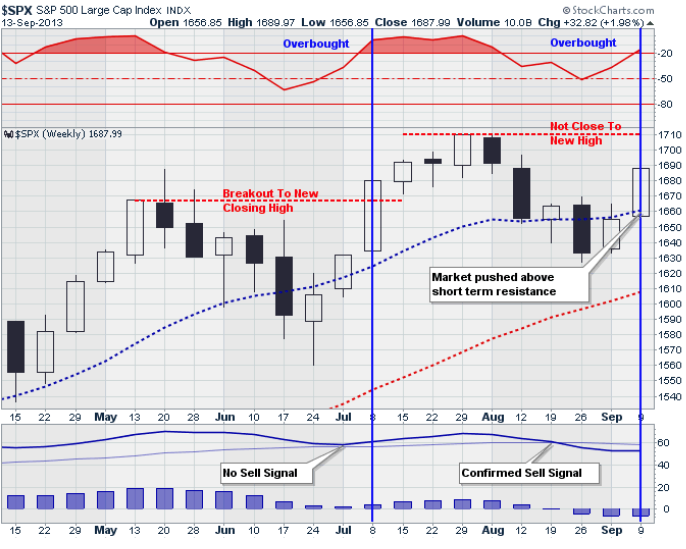
impact of short covering than anticipated, the rise did allow for portfolios to be realigned fully with our target allocation model. However, did this short term rally reverse the intermediate term “confirmed sell signal” issued two weeks ago? The chart on the next page shows the market versus the confirming
buy/sell signal.
What is important to notice is that following the previous selloff in the market – stocks reached a new closing high as they entered overbought territory. This followed a 110 point rally in the index. From that point to the next closing peak was only 40 points. However, NO SELL SIGNAL was ever issued.
…..read it all HERE
Foreign investors resumed their acquisition of Canadian securities by adding $6.1 billion to their holdings in July, following a $15.4 billion divestment in June. Meanwhile, Canadian investment in foreign securities slowed to $0.9 billion and focused on bonds.
Drew Zimmerman
Investment & Commodities/Futures Advisor
604-664-2842 – Direct
604 664 2900 – Main
604 664 2666 – Fax
800 810 7022 – Toll Free
Focus this week is on the FOMC meeting. The Fed is expected to announce the beginning of tapering include a reduction in monthly purchased from $85 billion to $70-$75 billion.
Ed Note: Michael Campbell interviewed Don Vialoux, one of the Premier Technical Analysts in the Country this weekend on Money Talks. Mike starts the interview asking Don about Seasonality, specifically if September is generally a tough month: {mp3}moneytalkssept14DonVailoux{/mp3}
Economic news other than the FOMC meeting announcement is expected to be mixed this week.
Earnings news this week will focus on FedEx and Oracle when they report on Wednesday.
Short term momentum indicators for broadly based equity indices around the world and most U.S. sectors are overbought, but have yet to show signs of peaking.
Medium term technical indicators are overbought. Dow Industrials, TSX Composite Index and the S&P 500 Index have reached a zone of resistance.
Seasonality in the second half of September is negative. Indeed, this period is the weakest period in the year for broadly based North American equity indices.
Other events that could influence equity markets this week include the debate on Syria, the budget debate, negotiations on the debt ceiling, higher energy costs and declining earnings estimates.
The Bottom Line
U.S. equity markets reached an intermediate peak on August 2nd. Strength last week has returned broadly based equity indices to near resistance levels. The current correction is expected to last until at least October. Preferred strategy is to maintain a healthy cash position for possible entry into the favourable seasonal trade in October.
Ed Note: Don analyses 42 Charts in the Equity, Interest Rate, Commodity & Currency Markets in this Comphrehensive Monday Report HERE
Quick view of the S&P, TSX, Gold, Bonds & US Dollar Below:
The S&P 500 Index gained 32.82 points (1.98%) last week. Trend remains neutral. Resistance is at 1,709.67 and support is at 1,627.47. The Index moved above its 20 and 50 day moving average. Short term momentum indicators are overbought, but have yet to show signs of peaking. Notice the overhead resistance between 1680 and 1710.
The TSX Composite Index fell 97.52 points (0.76%) last week. Trend remains up. The Index remains above its 20 day moving average. Strength relative to the S&P 500 Index changed from positive to negative. Technical score changed to 2.0 from 3.0 out of 3.0. Short term momentum indicators are rolling over from overbought levels.
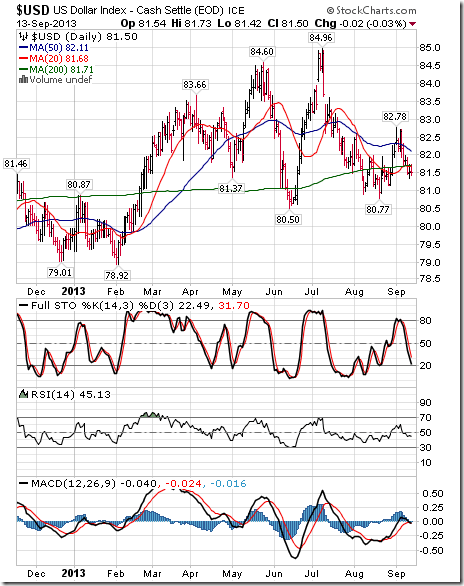
The U.S. Dollar fell 0.69 (0.84%) last week. The Index moved below its 20, 50 and 200 day moving averages. Short term momentum indicators are trending down.
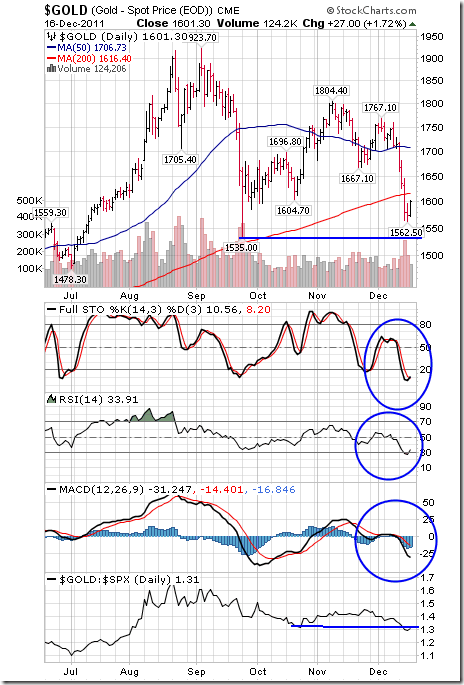
Gold plunged $77.90 per ounce (5.62%) last week. Trend remains up. Gold fell below its 20 and 50 day moving averages. Strength relative to the S&P 500 Index changed from neutral to negative. Technical score fell to 2.5 to 1.0 out of 3.0. Short term momentum indicators are oversold, but have yet to show signs of bottoming.
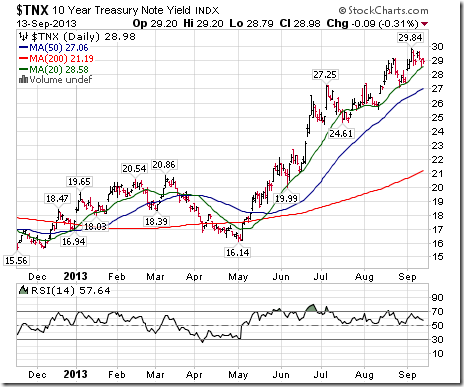
The yield on 10 year Treasuries slipped last week by 4 basis points (1.36%). Trend remains up. Yield remains above its 20 day moving average. Short term momentum indicators are overbought.
…..read more of Don’s analysis of 42 Charts in the Equity, Interest Rate, Commodity & Currency Markets in this Comphrehensive Monday Report HERE
 UP EIGHT DAYS IN A ROW TOUCHING 1689.97 ON THURSDAY. ARE WE STALLING OR ABOUT TO BREAKOUT TO NEW HIGHS? MUCH DEPENDS ON WEDNESDAY’S FOMC REPORT. OVERALL, WE’RE OVERBOUGHT, AT RESISTANCE MAY HAVE ONLY RUN UP TO TEST HIGHS. THE EXCEPTION IS STRENGTH IN THE NASDAQ WHICH IS SITTING AT NEW BULL MARKET HIGHS. WE KNOW THE FED HAS ENGINEERED AND CONTIUES TO ENGINEER A HIGH STOCK MARKET – THE INFAMOUS BERNANKE PUT SO WE’RE MORE THAN LIKELY TO SEE NEW HIGHS ANYWAY. I WOULD HAVE CERTAINLY PREFERRED TO SEE MORE OF A CORRECTION, PARTICULARY SINCE THE CALENDAR STILL SAYS WE’RE IN A TRACHEROUS TIME FRAME. FORGETTING THE MAJOR INDEXES, STOCK SELECTION HAS BEEN THE KEY WITH NOTABLE ‘NAME’ STOCKS PUSHING HIGHER AND HIGHER.
MEANWHILE, I HAVE MY TRIGGER FINGER ON A BUY SIGNAL. NEXT STOP COULD BE 1730, 1750 OR EVEN 1800 IN THE SPX ONCE WE CLEAR 1709.
COME NEXT YEAR, PROBABLY IN LATE SPRING, CYCLES INDICATE THE POTENTIAL OF THE BEGINNING OF A MULTI-MONTH IF NOT TWO-YEAR BEAR MARKET BUT THE SPX COULD BE 1800 BY THEN. MY ORIGINAL FORECAST CALLED FOR A STRONG 2013 FOLLOWED BY A NEGATIVE 2014-2015. WORST CASE COULD BE A 50% CORRECTION – THAT’S 500 POINTS OR 1200 IN THE SPX- MEASURING FROM THE 667 BEAR MARKET LOW IN 2009 TO THE 1710 PEAK.
——————————————–
On Friday, excluding a brief dip during the opening hour, the major averages were confined to narrow ranges. The early weakness took place after it was reported that the University of Michigan Consumer Sentiment Index dropped to its lowest reading since April (76.8) in the preliminary September reading. That was down from 82.1 in August and well below the consensus expectation of a drop to only 82.0. Typically, consumer sentiment follows trends in employment, equity prices, oil prices, and media reports.
Tuesday and Wednesday of next week will bring the FOMC policy meeting where many expect the Fed to announce a reduction in the size of its asset purchases. The taper talk began after Fed Chairman Ben Bernanke mentioned, during his June 19 press conference, that barring a downturn in the economy, the Fed could scale back the size of its purchases later in the year. Following the press conference, participants began looking to the September meeting as a possible start date for tapering.
In economic data, the retail sales and PPI reports conveyed a familiar message of modest growth and low inflation. August retail sales came in below expectations (0.2% v. 0.4% Briefing.com consensus), but the July reading was revised higher to reflect an increase of 0.4% (0.2% prior).
Separately, total PPI jumped 0.3% (Briefing.com consensus 0.2%) while core PPI, which excludes food and energy, was flat (Briefing.com consensus 0.1%).
Total business inventories rose 0.4% in July after increasing an upwardly revised 0.1% (from 0.0%) in June. The Briefing.com consensus expected business inventories to increase 0.3%. Manufacturer (0.2%) and merchant wholesaler (0.1%) inventories were known prior to the release. The only new information was that retailer inventories increased 0.8% in July after increasing 0.1% in June.
On Monday, the September Empire Manufacturing survey will be released at 8:30 ET while August industrial production and capacity utilization will be reported at 9:15 ET.
The Leibovit VR Gold Letter Subscriptions:
We offer multiple subscription plans to best suit your needs.
Click HERE and scroll down to view subscription plans, pricing and sign up.

-
I know Mike is a very solid investor and respect his opinions very much. So if he says pay attention to this or that - I will.
~ Dale G.
-
I've started managing my own investments so view Michael's site as a one-stop shop from which to get information and perspectives.
~ Dave E.
-
Michael offers easy reading, honest, common sense information that anyone can use in a practical manner.
~ der_al.
-
A sane voice in a scrambled investment world.
~ Ed R.
Inside Edge Pro Contributors

Greg Weldon

Josef Schachter

Tyler Bollhorn

Ryan Irvine

Paul Beattie

Martin Straith

Patrick Ceresna

Mark Leibovit

James Thorne

Victor Adair