

Focus this week is on the FOMC meeting. The Fed is expected to announce the beginning of tapering include a reduction in monthly purchased from $85 billion to $70-$75 billion.
Ed Note: Michael Campbell interviewed Don Vialoux, one of the Premier Technical Analysts in the Country this weekend on Money Talks. Mike starts the interview asking Don about Seasonality, specifically if September is generally a tough month: {mp3}moneytalkssept14DonVailoux{/mp3}
Economic news other than the FOMC meeting announcement is expected to be mixed this week.
Earnings news this week will focus on FedEx and Oracle when they report on Wednesday.
Short term momentum indicators for broadly based equity indices around the world and most U.S. sectors are overbought, but have yet to show signs of peaking.
Medium term technical indicators are overbought. Dow Industrials, TSX Composite Index and the S&P 500 Index have reached a zone of resistance.
Seasonality in the second half of September is negative. Indeed, this period is the weakest period in the year for broadly based North American equity indices.
Other events that could influence equity markets this week include the debate on Syria, the budget debate, negotiations on the debt ceiling, higher energy costs and declining earnings estimates.
The Bottom Line
U.S. equity markets reached an intermediate peak on August 2nd. Strength last week has returned broadly based equity indices to near resistance levels. The current correction is expected to last until at least October. Preferred strategy is to maintain a healthy cash position for possible entry into the favourable seasonal trade in October.
Ed Note: Don analyses 42 Charts in the Equity, Interest Rate, Commodity & Currency Markets in this Comphrehensive Monday Report HERE
Quick view of the S&P, TSX, Gold, Bonds & US Dollar Below:
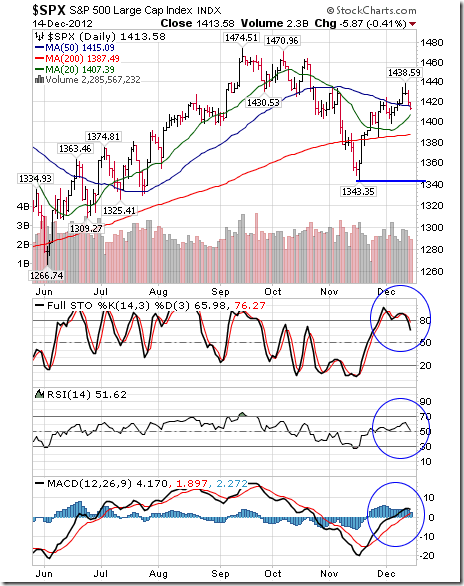
The S&P 500 Index gained 32.82 points (1.98%) last week. Trend remains neutral. Resistance is at 1,709.67 and support is at 1,627.47. The Index moved above its 20 and 50 day moving average. Short term momentum indicators are overbought, but have yet to show signs of peaking. Notice the overhead resistance between 1680 and 1710.
The TSX Composite Index fell 97.52 points (0.76%) last week. Trend remains up. The Index remains above its 20 day moving average. Strength relative to the S&P 500 Index changed from positive to negative. Technical score changed to 2.0 from 3.0 out of 3.0. Short term momentum indicators are rolling over from overbought levels.
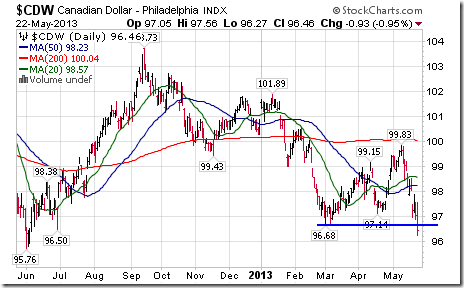
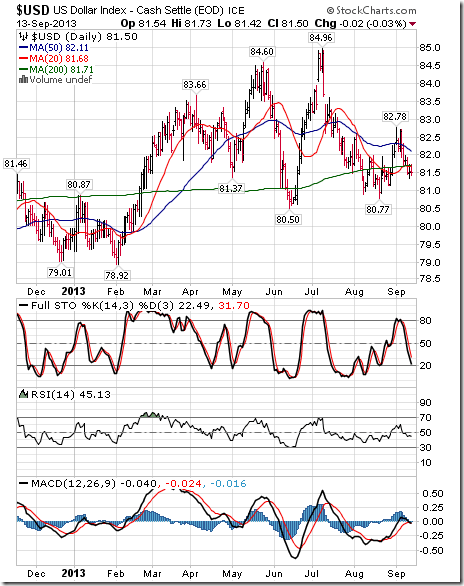
The U.S. Dollar fell 0.69 (0.84%) last week. The Index moved below its 20, 50 and 200 day moving averages. Short term momentum indicators are trending down.
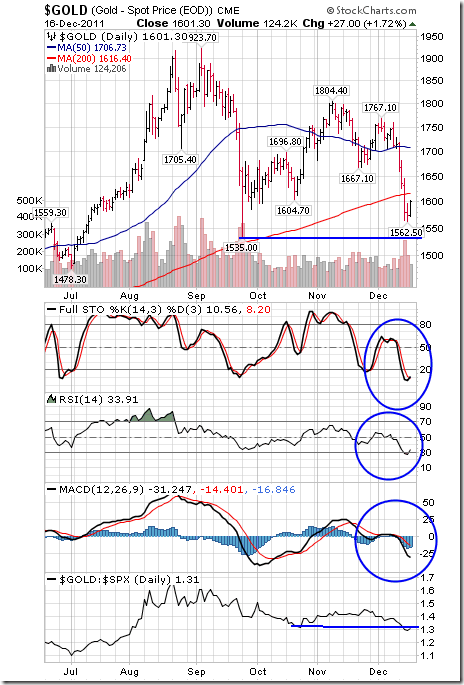
Gold plunged $77.90 per ounce (5.62%) last week. Trend remains up. Gold fell below its 20 and 50 day moving averages. Strength relative to the S&P 500 Index changed from neutral to negative. Technical score fell to 2.5 to 1.0 out of 3.0. Short term momentum indicators are oversold, but have yet to show signs of bottoming.
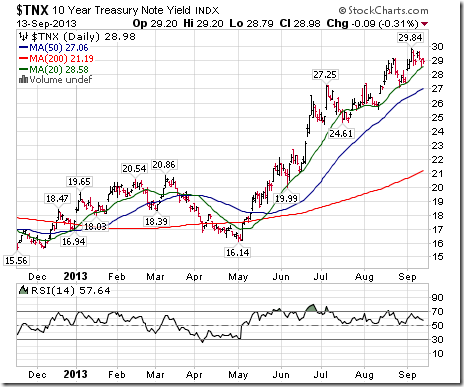
The yield on 10 year Treasuries slipped last week by 4 basis points (1.36%). Trend remains up. Yield remains above its 20 day moving average. Short term momentum indicators are overbought.
…..read more of Don’s analysis of 42 Charts in the Equity, Interest Rate, Commodity & Currency Markets in this Comphrehensive Monday Report HERE


