
Stocks & Equities
Genesis
A Stockscores user highlighted an article that I wrote back in 2009, saying it was one of his favorites and that I should send it out again. So, here it is, from February 21 2009:
In recent months I have devoted many of the weekly newsletters to discussion of trading psychology, risk management and trading strategies. But Stockscores was created in 1999 to simplify the market for investors. I created the Stockscores indicators to help investors quickly determine whether a stock is worth considering or not. This week, I would like to review how we use the Stockscores indicators and what they are based on.
I can remember the weekend that I built the Stockscores indicator model. The summer of 1999, I took my computer to a sunny beach town with a plan to relax and try to make an indicator out of the chart pattern recognition techniques that I had been trading with for about 10 years. Concepts like rising bottoms and falling tops, price consolidations, abnormal price and volume activity, price momentum, emotional buying and selling and market index correlation were important to my ability to pick winning stocks and avoid losers. While these concepts by themselves are easy to understand, using them in relation to one another requires some experience. I wanted to make an indicator that would simplify the art of chart reading.
And so, I decided to assign points to chart pattern criteria and make the point system conditional on different elements. For example, I had found that abnormal price gains with abnormal volume was (and still is) an important indication of future trend, but the abnormal action is most predictive when breaking from low volatility sideways trading patterns. So, the model gives more points to stocks trading abnormally if they are doing so from a period of sideways trading.
The Stockscores model is composed of over a dozen criteria, each with a set of rules that determine points. We start out giving every stock 50 points and add and take away points based on the many criteria that exist in the model. Statistically significant abnormal price and volume activity is the most important element in the model and is really the thing that differentiates what I do from conventional technical analysis.
How I came to focus on abnormal activity is an interesting story. It was probably 1995 that I found myself in a Finance class at the University of Calgary. That class was focused on Mergers and Acquisitions which was quite topical at the time because the market had just come out of “Merger Mania” where Investment Bankers were the king of the financial world based on the deals they did to combine big companies. Kohlberg Kravis and Roberts, Solomon Brothers and many other Wall Street firms were the big money makers of the 80’s and even inspired an Oscar winning movie, Wall Street.
One of the topics of this class was an investigation of whether news of an impending merger was leaked to the market and whether some people profited from trading on inside information. This was a theme of the movie Wall Street as the lead, Gordon Gecko, hired a young and enthusiastic broker named Bud Fox to uncover the next big deal before it was announced.
Now, when Gecko and Fox would uncover inside information on a stock, they would go in and buy that stock aggressively ahead of the news, reaping large profits which were then promptly spent on art, beach houses, nice cars and girlfriends – The American Dream.
Think about what happens when a real life Gordon Gecko begins to trade on information that is not already priced in. They create abnormal activity in the trading of the stock and it was this that we sought to prove in the Finance class on Mergers and Acquisitions.
And it was proven, for many of the major Wall Street deals that saw big price jumps in the stock of acquired companies had statistically significant abnormal price and volume activity in the weeks leading up to the deal. This phenomenon still exists today.
Right now, I am reading a book called Outliers, The Story of Success by Malcolm Gladwell. That book discusses how very simple things that happen in people’s lives can have dramatic effects on what they become later in life and that many of these things are neither purposeful or necessarily in the control of the people that benefit from them. Much of what determines your path in life is based on simple things like the month or year you were born and your cultural background.
Jumping ahead to sitting by the pool with a lap top in 1999 and building the Stockscores model, I harkened back to that one element of my Mergers and Acquisitions class that focused on measuring the statistical significance of abnormal price and volume action. It has become the core of all of my trading techniques and has been key to making my living from the stock market.
So, how do we use the Stockscores indicators? For the longer term trader, what I call a Position trader, the rules are as follows:
1. Sentiment Stockscore should be 60 or higher
This measure determines whether the buyers are in control of the stock. We don’t want to buy anything until the buyers are in control.
2. Signal Stockscore should be 80 or higher
The Signal Stockscore looks for abnormal market activity, breakouts, gaps etc and assigns a score to them. I like the Signal Stockscore to jump up above 80 because it Signals to us that something may be going on with the stock. This indicator does not need to stay above 80, it is just a trade trigger that tells us to check out the stock
3. A predictive chart pattern must exist
I don’t want to trust indicators to pick stocks so the final rule requires that we look at the chart and decide if the stock is breaking from a period of sideways trading and has enough reward potential to justify the risk.
Now, these are not the only ways to use the Stockscores indicators, over the years I have found other ways to combine rules to come up with different strategies. But this was the initial way that the Stockscores model was developed and it remains the core Position Trading Strategy of the Stockscores Approach, referred to in our course material as the Stockscores Simple strategy.
Does it always work? Absolutely not, no trading strategy does and it is important to understand that trading is about a lot more than just picking the right stock. But try applying just rule number 1 to all of the losing stocks in your portfolio that you wish you did not have. How many of them have a Sentiment Stockscore of 60 or more? How many of the stocks that have been falling over the past 6 or 8 months have passed rule number 1?
I expect that the answer will be very few or none. Rule number one will keep you out of bad stocks.
Now, go look at some stocks in the Precious Metals sector. This group of stocks has been the one area where we have seen consistent winners. In fact, the top performing stock on the TSX right now is Eldorado Gold (T.ELD). What is its Sentiment Stockscore and when did it cross above 60?
Those are the basics for using the Stockscores indicators and a little bit of background on how they came to be. I am often asked about why I teach people about the market and why I spend so much time traveling around talking about stocks. My answer has always been that I enjoy it and that it is a way for me to get out from behind my trading computer, but reading this book brought back a memory that I think has more to do with that choice than anything else.
I was in Grade 1 and we were getting ready to join the other classes in the school for an assembly. A tradition at our school was that each assembly would begin with a group participation of “Going on a Lion Hunt”. Those familiar with this game know that one person leads the others in a series of animated actions demonstrating the process of hunting lions.
For some reason, my Grade 1 teacher asked if I would like to lead the school through this event at the assembly and, not yet knowing a fear of public speaking, I willingly said yes. I can imagine that the teachers thought it was cute or funny to see a 6 year old telling a few hundred other students the actions they must do to hunt the lion and so it became tradition. I led Going on a Lion Hunt for every assembly and so my career as a public speaker was born.
What does this have to do with trading and making money in the market? Simply this; every trend starts with a well defined seed that drives fear or greed and understanding what that seed is will determine the path that the stock follows. The Stockscores Indicators are a way to identify future trends which can be combined with the many other skills necessary to succeed in the market.
STRATEGY OF THE WEEK
A pretty simple Market Scan this week, looking for stocks that are up more than 5% over the past 10 days with a Sentiment Stockscore of 50 or higher. The most important part is the inspection of the chart, looking for breaks from predictive chart patterns on the 3 year weekly time frame. Almost all of the good looking stocks that I see right now are from the Energy sector as money looks to be rotating out of the high flying stocks and in to the comeback sector. Here are three stocks that are good position trade candidates:
The three year weekly chart shows T.CTA breaking out from a very lengthy pennant pattern, making a good long term entry signal for a position trade. Support at $3.20.

Look at a daily chart of T.CR and it hard to want to buy it because the stock has been going up day after day for three months. But, in the context of the three year weekly charts, you can see that this stock still has a lot of lost ground to make up and is breaking through some long term resistance at $8. Support at $8.10.

CRK has recently broken through resistance at $20 and looks like it has good potential to go to $32 in the months ahead. Support at $19.

Stockscores Market Minutes Video
In this week’s Market Minutes video, I discuss Strategy Development. It is a time consuming process but one of my favorite parts of trading. Learn more about what it takes to create a new trading strategy. Watch the video by clicking here.
Upcoming Events
First 500 registered receive my book, The Mindless Investor, free (courtesy of Disnat). Register now at this page.
Can’t make the Calgary or Vancouver events? We are doing a live webinar as well (without the free book offer).
Calgary April 3 and 5
Vancouver April 12
Surrey April 15
Webinar April 17
For details and to register now, Click Here.
References
- Get the Stockscore on any of over 20,000 North American stocks.
- Background on the theories used by Stockscores.
- Strategies that can help you find new opportunities.
- Scan the market using extensive filter criteria.
- Build a portfolio of stocks and view a slide show of their charts.
- See which sectors are leading the market, and their components.
Disclaimer
This is not an investment advisory, and should not be used to make investment decisions. Information in Stockscores Perspectives is often opinionated and should be considered for information purposes only. No stock exchange anywhere has approved or disapproved of the information contained herein. There is no express or implied solicitation to buy or sell securities. The writers and editors of Perspectives may have positions in the stocks discussed above and may trade in the stocks mentioned. Don’t consider buying or selling any stock without conducting your own due diligence.

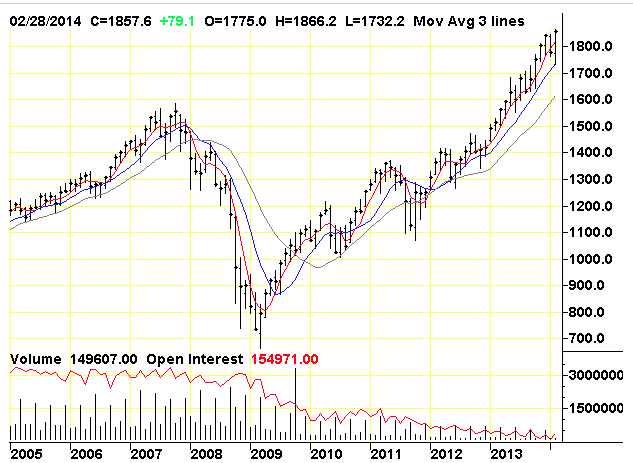
On the surface, the stock market was fairly subdued this week. The S&P 500 meandered lower, but the overall loss wasn’t so bad. On Thursday, the index closed a hair below 1,850, but let’s not forget that one week ago, we touched an all-time intra-day high.
Beneath the surface, however, there’s been a big shake-up in the market. Specifically, momentum names have faltered while value stocks have taken the lead. This is an important development, and investors need to understand what’s happening. High-profile sectors like biotech have gotten hammered, and former market darlings have been in a world of hurt lately.
Anyone remember a company called Netflix? That stock dropped 14 times in a 15-day span. Since March 4, NFLX is off by 20%. Stocks like Tesla and Priceline are getting dinged as well. Bespoke Investment Group recently noted that the best-performing stocks from last year are the worst performers this year.
In this week’s CWS Market Review, I’ll break down the market’s change of leadership and tell you what it means for our stocks. Speaking of our stocks, we had more good news for our Buy List stocks. DirecTV soared 8% on Wednesday after news of a possible merger with DISH. I’ll have more on that in a bit. Also on Wednesday, the stress testers at the Fed said they have no objections to Wells Fargo’s capital plan, which includes a hefty 16.7% dividend increase.
I’m pleased to see that our Buy List tech stocks are doing well. Oracle and Qualcomm are near new long-time highs, and even slumbering IBM has perked up. Big Blue just touched its highest point in six months, and I think we’ll get a dividend increase next month. But first, let’s look at the big internal shakeup on Wall Street.
 The Market’s Big Shift towards Value
An important lesson with investing is that the stock market swings in cycles, and not just the overall market, but also within the market. For example, economically cyclical stocks will lead for a few years, then lag for a few more. Financial stocks will blossom, and then another year it will be dividend stocks. There’s a loose relationship between these cycles, and it’s always dangerous to read too much into the market’s notoriously fickle mood.
In the last month, value stocks have started to lead the market, and growth stocks have been the big losers. What’s interesting is that this has happened during a mostly bullish time for stocks. Typically, we would expect value stocks to do well when the overall market is suffering. Then, as the bull market starts to age, we would expect growth stocks to come into their own. If you recall, that’s what happened during the late 1990s. What was so arresting about that market wasn’t that value stocks merely lagged — it’s that they got crushed even though growth stocks soared. Back then, the Growth/Value divergence was a yawning chasm.
Another interesting aspect about this recent shift to value has been how sharp it’s been. For my Growth proxy, I like to follow the Vanguard Growth ETF (VUG), and for Value, I look at theVanguard Value ETF (VTV). They’re like twin brothers always fighting over mom’s attention. VUG is flashier and has more popular names, while VTV is the quiet, dutiful student. The typical Value/Growth cycle has been distorted in the last few years because the value indexes have been filled with so many toxic financial stocks.
The last Value cycle topped out in mid-2006, and Growth has been in the driver’s seat ever since (with a few false starts for Value). This means that Value underperformed during both the bear market and the bull market. That’s quite a feat. A lot of people have anticipated a Value resurgence, but each attempt has failed. Or I should say each attempt so far.
Since February 27, VTV is up 1.08%, while VUG is down -2.73%. That may not sound like much, but within the ongoing battle between Value and Growth, that’s a major short-term move, and it may continue for some time. VTV has beaten VUG for the last seven days in a row, and 10 of the last 11.
So What Does This Value Shift Mean?
When the market moves towards Value, it typically means that investors are nervous and seeking safety in cheaper names. This time around, it’s not so much that investors want Value. No, it’s that they’re fleeing Growth. An orderly exit is turning into a mad dash. Probably the best example of this has been with biotech stocks. The main Biotech ETF (IBB) has dropped sharply over the past month. Since February 25, the IBB is off by 13.6%, and a lot of biotech names are down much more than that. Of course, we have to remember that biotech had been in an astounding rally over the past two years.
“So the last shall be first, and the first last” is a quote from the Bible, but it also could serve as a recent stock market report. Look a Tesla (TSLA), a high-flyer which could do no wrong. The stock went from $35 one year ago to as high as $265 last month. But the past few days have been a different story. Tesla is currently 22% off its high. On the flip side, look at boring Long-Term Treasuries (TLT). They’re supposed to be dead money, right? But the TLT is at its highest level in eight months. When the current shifts, it can be rough.
I also think the market’s shift towards Value is reflection of what I talked about last week — investors are getting prepared for the probability of higher short-term interest rates. Last week, the bond market woke up to this idea, and the shift to Value is the stock market’s turn.
Overall, the renewed emphasis on Value is benefit for our Buy List. In the short term, some of the prominent growth stocks like Cognizant Technology (CTSH) have suffered in the backlash. I don’t expect that to last. Now let’s take a look at some recent Buy List news.
Wells Fargo Raises Dividend 16.7%
Last week, the Federal Reserve said that Wells Fargo (WFC) aced its most recent stress test. I had no doubts they’d pass. It’s hardly a secret that WFC is one of the best-run big banks around.
The second part of the Fed’s test came this week to see if they’d approve their capital plans. Once again, Wells Fargo easily passed. The Federal Reserve said they had no objections to WFC’s capital plans. That includes a 16.7% increase in their dividend. The quarterly payout will rise from 30 to 35 cents per share. Last week, I said that I was expecting an increase, but only of two cents. Shows what I know!
The share jumped after the announcement. Using the new dividend and going by Thursday’s close, Wells now yields 2.85%. The board also approved a 350 million-share increase in their buyback plan.
By the way, this stress wasn’t a cakewalk. Zion’s failed, and Citigroup’s dividend request was shot down. Six years after Bear Stearns collapsed, Citi still pays a quarterly dividend of one penny per share even though Wall Street expects them to earn $5.78 per share next year. Citigroup is still a mess, and I’m glad we have a top-tier name like Wells Fargo. Look for another good earnings report in two weeks. WFC remains a very good buy up to $54 per share.
Will DirecTV Merge with Dish?
On Wednesday afternoon, news broke that the CEO of Dish Networks had spoken to the CEO of DirecTV (DTV) to talk about a possible merger. Honestly, this isn’t a big surprise. Folks have talked about a merger between the two for years. In fact, they tried to merger 12 years ago, but the Federales blocked it. Today, I think DTV is the stronger company, but I have to give credit to Dish for holding its own.
Clearly, the recent merger announcement between Time Warner Cable and Comcast has changed the game, and the two satellite guys have to start thinking seriously about their future. A merger makes sense, but at what price? That’s hard to say. I think DirecTV holds the upper hand here, and it’s interesting to note that Dish’s CEO made the call. Still, DirecTV would be wise to consider an offer. DirecTV has 20 million subscribers, while DISH has 14 million.
A lot of this will depend on how regulators rule on the Comcast/TWC deal. If the Feds say yes to that, it will be hard for them to say no to the Direct/Dish deal. DirecTV’s CEO, Mike White, has seemed hesitant about a deal, but he hasn’t ruled it out. I think that’s the right attitude. Frankly, I think these two will get together at some point. I just don’t know when.
The immediate benefit of the merger talk is that shares of DTV jumped as much as 8% on Wednesday, although the stock pulled back as the excitement wore off. DirecTV remains an excellent buy up to $84 per share.
New Buy Below Prices
I want to update a few of our Buy Below Prices. IBM (IBM) has been doing well lately. This week, the shares got above $195 for the first time since September. I’m expecting a dividend increase from Big Blue sometime next month. I’m raising my Buy Below to $197 per share.
On Thursday, Qualcomm (QCOM) closed at another multi-year high. The company raised their dividend by 20% just a few weeks ago. This week, I’m bumping up my Buy Below to $83 per share.
CR Bard (BCR) has been one of our top performers this year. I’ve already raised my Buy Below on BCR a few times, and I’ve purposely held off in the past few weeks. With the Q1 earnings season just around the bend, I feel more confident in BCR’s outlook. Bard has beaten earnings for the last six quarters, and I think they’ll do it again. I’m raising my Buy Below on BCR to $147 per share.
I’m keeping my Buy Below for Microsoft (MSFT) at $43 per share, but I wanted highlight the CEO’s plans for the company. For the first time in years, investors are optimistic for MSFT. Keep watching this story, it’s going to get better
Two of our tech stocks have had a rough month: CA Technologies (CA) and Cognizant Technology Solutions (CTSH). I still like both stocks, but I want my Buy Below to better reflect the market’s current judgment. I’m lowering my Buy Below on CA to $34 per share, and I’m lowering Cognizant to $52 per share. Going by Thursday’s close, CA’s dividend works out to 3.28%. Both stocks are very good buys.
That’s all for now. The first quarter ends on Monday; after that, we’ll get our regular beginning-of-the-month reports. ISM comes out on Tuesday. The ADP jobs report comes out on Wednesday. Then on Friday, the government releases the big jobs report for March. With the Fed committed to tapering, I actually think the monthly jobs reports aren’t quite as important as they were last year. Be sure to keep checking the blog for daily updates. I’ll have more market analysis for you in the next issue of CWS Market Review!
– Eddy
About Crossing Wall Street
Named by CNN/Money as the best buy-and-hold blogger, Eddy Elfenbein is the editor of Crossing Wall Street. His free Buy List has beaten the S&P 500 for the last seven years in a row. This email was sent by Eddy Elfenbein through Crossing Wall Street.

In a recent “Squawk Box” interview to CNBC, the publisher of “The Gloom, Boom & Doom Report” had cautioned investors that the long-running bull market in US stocks runs the risk of ending badly. “Usually these long bull markets, they end badly,” he said, pointing to the 1987 crash and the significant declines in 2000 and 2007. Speaking about EMs, he had then said that while it might be too early to buy some of the beaten-down emerging markets at these levels, investors can make money in the longer-term. “I think I can make the case that over the next five to 10 years, I will make more money by buying now in the emerging economies than in the US.”
“I think the market is way overdue for a 20 to 30 percent correction,” “nothing worries me… In fact, I’m hoping for the market to drop 40 percent so stocks will again become—from a value point of view—attractive.”
“But that is not the view of someone who is fully invested—obviously not.”
“Stocks are by-and-large fully priced”
“I think the experience with quantitative easing is a complete failure. It has lifted asset prices and created asset inflation, but it hasn’t lifted the standard of living of most people in the U.S. nor worldwide.”
On the chance of a bounce (and what next?)
“If the rebound fails around 1,820 [on the S&P 500] and then the market starts to drift again on the downside, and we see important shares for the market such as General Motors, GE, MMM, Coke … failing to make new highs, then I think we can assume that something more serious is in the offing.”
Marc Faber is an international investor known for his uncanny predictions of the stock market and futures markets around the world.Dr. Doom also trades currencies and commodity futures like Gold and Oil.
Ben Bernanke, Janet Yellen, and Alan Greenspan have explicitly stated within the last few months that stock markets are not in a bubble.
History shows their track record on such predictions is embarrassing, which has left both Greenspan and Bernanke grasping for excuses after previous bubbles burst on their watch.
Soon it will be Janet Yellen’s turn to backpedal, as there is simple-yet-compelling evidence that stock markets are indeed right now in an unsustainable growth pattern.
Yup, it’s a bubble.
In what may come as a surprise to Fed Chairs and Nobel Laureates everywhere, it turns out the most valuable skill needed to identify a bubble in financial markets is the ability to count to 64.
All the “name-brand” market bubbles in history have lasted 64 months from initial growth to blow-off top. This includes the 3 biggest bubbles in modern market history:
– the Dow into the 1929 peak
– the Nikkei into the 1989 peak
– the Nasdaq 100 into the 2000 peak
This also includes more recent bubbles, such as home-builders into 2005, and crude oil into 2007.
If it’s an unsustainable growth pattern heading for a crash, it carries this 64-month time signature.
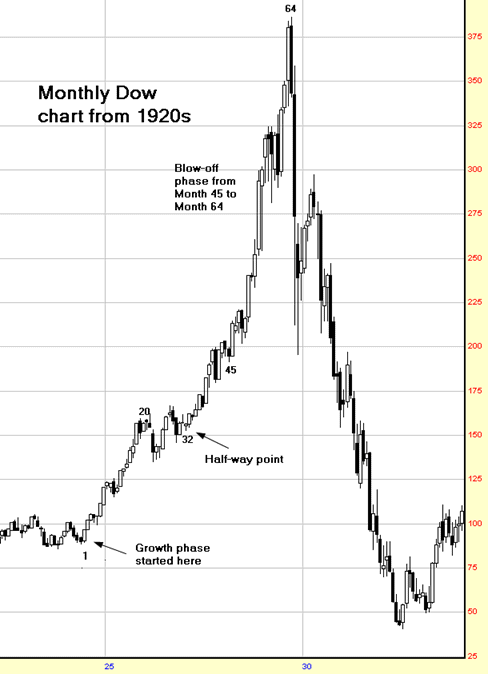

As an interesting aside, the famous stock market crash in October 1987 had a slightly different — but equally interesting — time signature. The top in 1987 came at Month 61, with Month 64 turning out to be the post-crash low.
This pattern was different in that it turned out to be a sustainable pattern, with prices recovering fairly quickly to keep pushing relentlessly higher. It was just a hiccup — or maybe a dry heave — on the way to the epic bull market in the 1990s.
So why 64 months? Why that specific number?
That answer is beyond the scope of a short web post but the sound-bite explanation is because this is aligned with the fractal scaling constant that can be observed in all facets of human life on planet earth. It is not a coincidence that the retirement age is 65 years, or that there are 64 – 65 trading days in 3 calendar months (one season). These patterns work across all timeframes. A 64-day growth pattern is seen frequently during strong market uptrends, and it can also be readily observed on hourly charts, and even 5 minute charts.
It’s fractal scaling. It’s there to be observed by simply counting.
There is good news and bad news for the bulls on this current 64-month pattern.

The bad news is time is almost up on this pattern. The energy is set to flip to the downside in June, or possibly July of this year if the timing extends out to Month 65, which sometimes happens.
The good news for the bulls is often the end-stage of a bubble pattern brings on a huge upside explosion. So even though Month 64 arrives in just a few months there is still plenty of time for more gains — even amazing gains.
There are some nuances to how these patterns play out during the end stages. Frequently there is a broad double top, and the configuration of timing of this particular 64-month growth pattern does suggest a double top is in store.
That could create a highly unstable and volatile environment for stock prices between now and July. I have been discussing the various scenarios for the end-stage of this pattern in my daily reports as there are straightforward ways to analyze this in real-time.
Interestingly, one of the individual stocks that is sure to become a cautionary tale about this particular bubble has already hit its 64 month high.

One final note: I have been tracking the growth in bitcoin for quite some time, well before the bubbly price behavior that has emerged over the past year in this emerging decentralized medium of exchange. I am purposely not calling it a currency as that carries connotations that seem to distract people from really examining the magnitude of this breakthrough in network design.
The really intriguing thing about Bitcoin is you can “buy stock” in the entire emerging ecosystem simply by owning some bitcoin. There was never a way to “buy SMTP” or “buy HTTP” or “buy WiFi” like there is now with Bitcoin.
There are classic timing signatures of a 64-month bubble pattern in the bitcoin chart, with the surges and corrections happening on schedule. The main difference is the scale of the price moves, which are unlike any previous growth pattern. The potential of this pattern is really quite staggering. I have just added a new section to my daily reportsto discuss bitcoin, to keep subscribers up to date on this unprecedented bubble pattern.
For some further perspective on the current state of the stock market, today’s chart presents the long-term trend of the S&P 400 (mid-cap stocks). As the chart illustrates, the S&P 400 rallied from late 2002 into the mid-2007 and then gave most of that back during the financial crisis. However, the S&P 400 rebounded well by recouping all losses incurred during the financial crisis and making new record highs in a mere two years. Over the past couple of years, the S&P 400 has continued to trend strongly to the upside. In fact, the S&P 400 has gained over 230% since its financial crisis lows and remains well within the confines of a steep upward sloping trend channel.

Quote of the Day
“Happiness is a direction, not a place.” – Sydney J. Harris
Events of the Day
April 01, 2014 – April Fool’s Day
April 07, 2014 – NCAA men’s basketball championship
April 08, 2014 – NCAA women’s basketball championship
Stocks of the Day
— Find out which stocks investors are focused on with the most active stocks today.
— Which stocks are making big money? Find out with the biggest stock gainers today.
— What are the largest companies? Find out with the largest companies by market cap.
— Which stocks are the biggest dividend payers? Find out with the highest dividend paying stocks.
— You can also quickly review the performance, dividend yield and market capitalization for each of the Dow Jones Industrial Average Companies as well as for each of the S&P 500 Companies.
Notes:
Where should you invest? The answer may surprise you. Find out right now with the exclusive & Barron’s recommended charts of Chart of the Day Plus.

-
I know Mike is a very solid investor and respect his opinions very much. So if he says pay attention to this or that - I will.
~ Dale G.
-
I've started managing my own investments so view Michael's site as a one-stop shop from which to get information and perspectives.
~ Dave E.
-
Michael offers easy reading, honest, common sense information that anyone can use in a practical manner.
~ der_al.
-
A sane voice in a scrambled investment world.
~ Ed R.
Inside Edge Pro Contributors

Greg Weldon

Josef Schachter

Tyler Bollhorn

Ryan Irvine

Paul Beattie

Martin Straith

Patrick Ceresna

Mark Leibovit

James Thorne

Victor Adair