
Stocks & Equities
 “Credit Bubble Deflating & Real Estate Market Crashing”
Question: Have they discounted China enough in your view?
China : Credit Bubble Deflating & Real Estate Market Crashing
FABER: Well I think that we had a colossal credit bubble in China and that this credit bubble is now being gradually deflated and will bring about problems in the real estate market and among some major players in the commodity markets as well. So overall, if I look at export figures from China, and they are very closely correlated to overall economic growth, then there is a huge discrepancy between what China reports and what China’s trading partners are reporting.
So if you look at the figures of China, exports are still growing. If you look at the trade figures China exports to Taiwan, so China records exports of so and so much. The Taiwan report imports from China at a much lower level. So which figures are more reliable? I think the figures of the trading partners of China are more reliable. And they would suggest that growth has slown down considerably.
Governments will always publish the statistics that they wish to show irrespective whether that is in China or in other countries. Governments control basically the statistical offices, so they can show whatever they want. As Stalin said, it’s not important who votes but who counts the votes. And the government counts the statistics.
Marc Faber is an international investor known for his uncanny predictions of the stock market and futures markets around the world.Dr. Doom also trades currencies and commodity futures like Gold and Oil.

![]()
Bonterra Energy is a dividend paying oil and gas company. Co.’s primary focus is to maintain and enhance cash dividends to its shareholders through the optimum utilization and development of existing crude oil and natural gas properties and acquisition or development of new producing properties. Development efforts are concentrated in the Pembina field mainly in the Cardium, Belly River and Edmonton zones. Ticker symbol TSE: BNA.CA


![]()
The PE ratio from 1900 to present is shown here in today’s chart. Generally speaking, when the PE ratio is high, stocks are considered to be expensive. When the PE ratio is low, stocks are considered to be inexpensive. From 1900 into the mid-1990s, the PE ratio tended to peak in the low to mid-20s (red line) and trough somewhere around seven (green line). The price investors were willing to pay for a dollar of earnings increased during the dot-com boom (late 1990s), surged even higher during the dot-com bust (early 2000s), and spiked to extraordinary levels during the financial crisis (late 2000s). Since the early 2000s, the PE ratio has been trending lower with the very significant but relatively brief exception that was the financial crisis. More recently, the PE ratio has trended higher (to just shy of the 20 level). However, over the past four months, corporate earnings have increased enough to maintain a relatively flat PE ratio — an overall positive for the stock market.
Notes:
Where should you invest? The answer may surprise you. Find out right now with the exclusive & Barron’s recommended charts of Chart of the Day Plus.

Quote of the Day
“Nowadays, people know the price of everything and the value of nothing.” – Oscar Wilde
Events of the Day
March 20, 2014 – First day of Spring (Northern Hemisphere)
April 01, 2014 – April Fool’s Day
Stocks of the Day
— Find out which stocks investors are focused on with the most active stocks today.
— Which stocks are making big money? Find out with the biggest stock gainers today.
— What are the largest companies? Find out with the largest companies by market cap.
— Which stocks are the biggest dividend payers? Find out with the highest dividend paying stocks.
— You can also quickly review the performance, dividend yield and market capitalization for each of the Dow Jones Industrial Average Companies as well as for each of the S&P 500 Companies.
get Free Chart of the Day HERE
 Concern about the vulnerability of US stocks right now.
Value investor and founder of the Baupost Group, Seth Klarman, has expressed similar concerns in his recent letter to shareholders. (If you’ve never heard of Klarman, that’s because he tends to shun the limelight. But the performance of the Baupost Group is legendary. It is one of the largest hedge funds in the world. And according to Bloomberg, it is ranked 4th in net gains since inception.)
Klarman has focused his attention on the big gap between recent US stock market gains and sluggish underlying corporate earnings:
No one can know what the future holds, but any year in which the S&P 500 jumps 32% and the NASDAQ Composite 40% while corporate earnings barely increase should be cause for concern, not further exuberance. It might not look like it now, but markets don‘t exist simply to enrich people.
And he’s warned that someday the current rally will mutate into big declines:
Someday, financial markets will again decline. Someday, rising stock and bond markets will no longer be government policy. Someday, QE will end and money won‘t be free. Someday, corporate failure will be permitted. Someday, the economy will turn down again, and someday, somewhere, somehow, investors will lose money and once again come to favor capital preservation over speculation. Someday, interest rates will be higher, bond prices lower, and the prospective return from owning fixed-income instruments will again be roughly commensurate with the risk.
The best protection against these inevitable declines is portfolio diversification.
Diversification is simple enough. The less that any single bad event of any kind can affect your portfolio, the more diversified you are.
That means investing in a range of asset classes – commodities, real estate, cash, tangible assets, etc. – outside of stocks. And also diversifying your stock market investments outside of the US.
This won’t make for exciting dinner-party conversation. But it will be your best defense in another market downdraft. Prepare now before it’s too late.

Yes, I am bullish on the U.S. equity markets long-term. But right here and now is a very different story.
Look, the S&P 500 Index soared 32.4 percent higher last year without much more than a five percent correction along the way. The phrase over-bought doesn’t even begin to explain how extended this stock market is right now.
European stocks are even more over-bought in my view and both markets are well overdue for a correction — and I anticipate a substantial selloff — worse than many investors are expecting!
The Dow is eventually going to well over 31,000; that’s my big-picture view. But it’s not going to happen until all the current complacency and bullishness is shaken out of the markets.
From every measure I look at, stocks are overbought and ripe for a major selloff. Europe’s equity markets are headed for a far deeper and longer selloff.

Click for larger version (Ed Note: I have contacted the publisher to repair this link. Hopefully the larger version will be up in a moment)
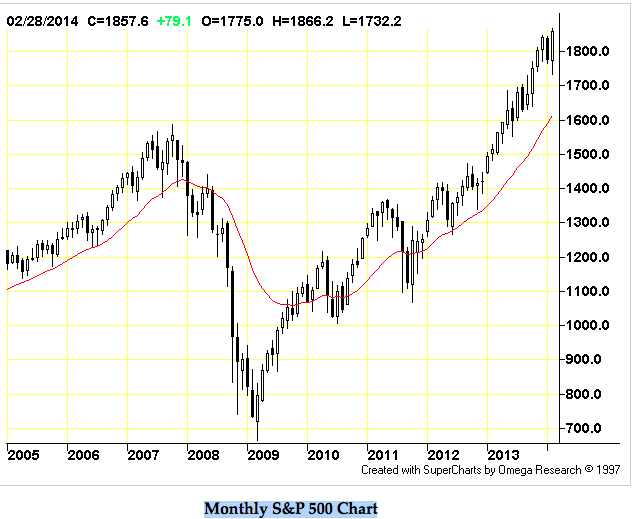
Let’s take a closer look now. Here is a monthly timing chart for the S&P 500.
It actually gave a sell signal at the end of last October. Being a monthly timing chart, it can be off target by as much as a few months, as it has been.
Yet, the S&P 500 is only up about 5.7% since that sell signal was issued. Not all that much. Especially when you consider that there are very few stocks that have pushed the index higher since then, with the majority of stocks either down or sideways since.
Far more important is the slope of the impending decline. As you can see, it is nearly straight down heading into the end of May. In other words, we are on the cusp of a MAJOR pullback, one that may have already started.
Yes, the S&P 500 has wandered to new highs since October, but the Dow Jones Industrials has not, and it actually peaked on the last day of December. This non-confirmation between the two indices is very bearish.
Moreover, as I have said all along, the Dow Industrials will not break out and start its new leg to 31,000+ until it closes decisively above 16,650. The high thus far, intraday, was 16,588.25.
I don’t own one single stock and I won’t own any until the correction plays itself out, or the Dow closes solidly above 16,650.
Now let’s look at Europe. It is about to CRASH. Here’s a monthly timing chart of the DAX, the most important European equity market.

Click for larger version (Ed Note: I have contacted the publisher to repair this link. Hopefully the larger version will be up in a moment)
On the Weiss Wealth Summit cruise in December, I told everyone in the audience to get the heck out of European stocks no later than the end January.
The reason was simple: As you can see from this chart, the monthly models for the DAX showed a sell single coming at the end of January.
The DAX went virtually nowhere for the last few months and now it’s starting its first leg down. As you can see from the above chart, the DAX is heading into a three-to-four year BEAR MARKET, one that will last into 2017 to late 2018. The same applies to virtually every market in Europe.
What should you do to potentially profit from a market decline? Buy leveraged inverse ETFs. Best choices for the U.S. equity markets: ProShares UltraPro Short S&P 500 (SPXU) … ProShares UltraShort Dow 30 (DXD) … and ProShares Short QQQ (PSQ) for the Nasdaq. For Europe, I like ProShares Short MSCI EAFE (EFZ).
What about gold and silver and their continued rallies? Look, if you want to load up on gold and silver, be my guest.
Personally, I am NOT going to get aggressively or even conservatively long the precious metals or mining shares UNTIL I SEE POSITIVE PROOF they have bottomed.
No such proof exists right now. And in fact, the opposite is occurring: The higher gold and silver go now, the deeper and more drawn out the bear market is going to become.
Yes, there was money to be made on the long side recently, in gold, silver and mining stocks, but let’s keep things in perspective: the SPDR Gold Trust ETF (GLD) has been in a rally for only two and one-half months, with a gain of 15 percent.
A very similar rally in gold and mining stocks took place in July and August 2013, and guess what? GLD gave up all those gains by year-end, and most mining shares fell to NEW lows.
I don’t care about short-term rallies until I’m convinced gold has bottomed. I’ll pass that money by. I want the big money, for myself and my subscribers. So I am going to wait to either short the current rally in the metals … or buy at the right time when there is the least amount of risk.
That means that if I have to miss a few moves, so be it. I don’t know anyone in the world who has a better track record at calling the major turning point in gold or silver than me and that is not going to change.
How much of what we are seeing now in the markets is related to the situation in Ukraine? A lot.
But it’s just the beginning. The war cycles ramp higher for SIX more years. You ain’t seen nothing yet.
They are going to have vast implications for the markets, beyond anything you can possibly imagine right now. So stay flexible and stay tuned …
Best wishes,
Larry
About Larry Edelson
This investment news is brought to you by Money and Markets. Money and Markets is a free daily investment newsletter from Martin D. Weiss and Weiss Research analysts offering the latest investing news and financial insights for the stock market, including tips and advice on investing in gold, energy and oil. Dr. Weiss is a leader in the fields of investing, interest rates, financial safety and economic forecasting. To view archives or subscribe, visit http://www.moneyandmarkets.com/.
– See more at: http://www.swingtradingdaily.com/2014/03/17/get-the-heck-out-of-the-stock-market-before-its-too-late/#sthash.ACmrrTOG.dpuf

-
I know Mike is a very solid investor and respect his opinions very much. So if he says pay attention to this or that - I will.
~ Dale G.
-
I've started managing my own investments so view Michael's site as a one-stop shop from which to get information and perspectives.
~ Dave E.
-
Michael offers easy reading, honest, common sense information that anyone can use in a practical manner.
~ der_al.
-
A sane voice in a scrambled investment world.
~ Ed R.
Inside Edge Pro Contributors

Greg Weldon

Josef Schachter

Tyler Bollhorn

Ryan Irvine

Paul Beattie

Martin Straith

Patrick Ceresna

Mark Leibovit

James Thorne

Victor Adair