
Stocks & Equities
“Like sands through the hourglass, so are the days of our lives.”
McDonald Carey who played Dr. Tom Horton
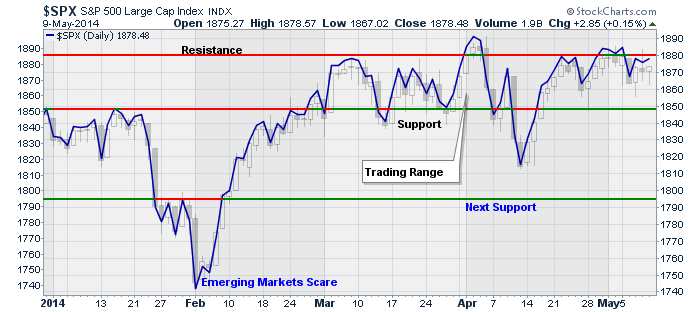
The idea of “time slipping by” relates directly to the stock market over the past several months as we rapidly approach the halfway point for 2014. “Better than expected” economic data and earnings news has buoyed the market against the drain of liquidity from the Fed. Despite commentary from the mainstream media that the markets are doing great, the updated chart below shows the market continues its tug-o-war.
There are two ways to look at stagnation in the markets. It is either a consolidation process that works off an overbought condition which leads to further advances, OR it is a topping process that leads to a market decline.
The chart below is what a consolidation process looks like. I have shown the Dow, S&P 500, Nasdaq and Russell 2000 indexes from July of 2013 through the end of last year.

Notice that the all the markets get oversold but remained in consolidation together. As the market gained strength the more “aggressive” stocks, as represented by the Nasdaq and Russell 2000, broke out first followed by the more defensive S&P 500. In other words, the degree of correlation between stocks remained high which is bullish.
The next chart shows what a topping process looks like. In 2011, the markets began a topping pattern which led to a rather aggressive selloff during that summer. As you can see in the next chart, the consolidation pattern looks very similar to the current period as shown above. All stocks remain highly correlated and the markets get oversold prior to the next move.
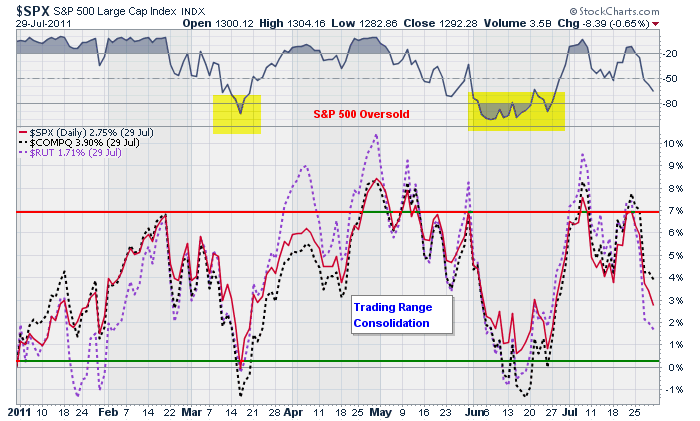
Of course, the difference is that in 2011, this pattern ended in a rather severe correction of almost 20%.
The obvious question is what was the difference? Were there any signs that suggested that the consolidation in 2011 was going to breakdown as opposed to the ramp up in 2013?
For that answer let’s take a look at some internal measures of the market for any tell-tale clues.
The first charts shows the number of stocks on bullish “buy” signals for the S&P 500 in 2011, 2013 and currently.
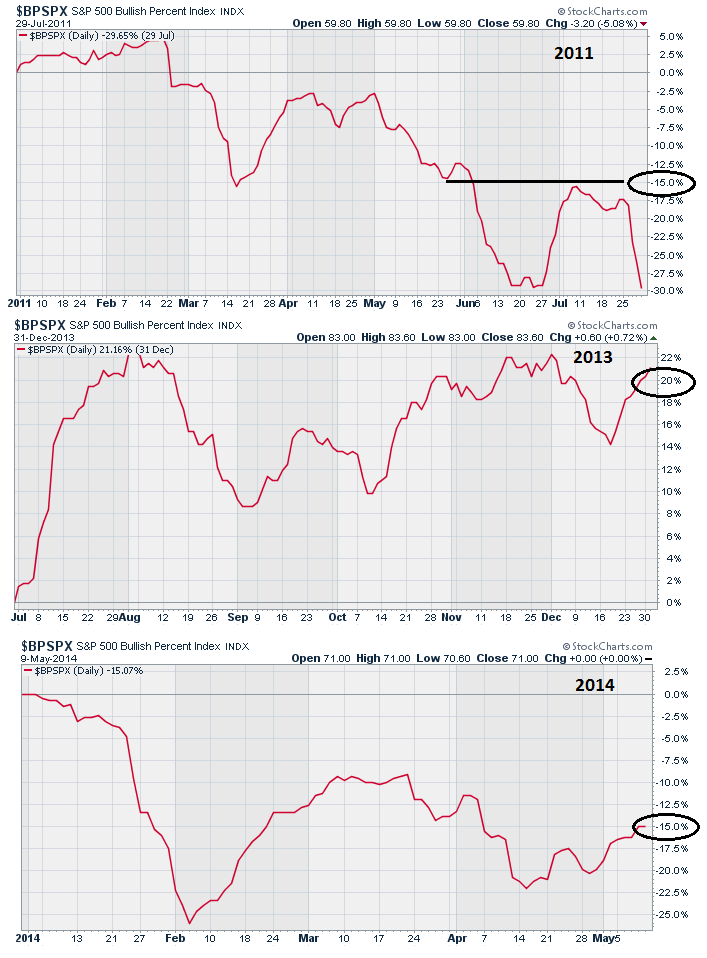
In 2011, this indicator was deteriorating sharply and by the middle of May was down 15%. This was as opposed to the consolidation process in 2013 as the index was up 20%. Notice, that during the current correction process the index is down 15% at the same point as we were in 2011.
The next chart is the CBOE Total Put/Call Ratio, which measures “fear” in the markets. When investors are complacent, or have no fear of a correction, markets tend to rise. However, when this index is on the rise it is generally a sign that underpinnings of the market are more fragile.
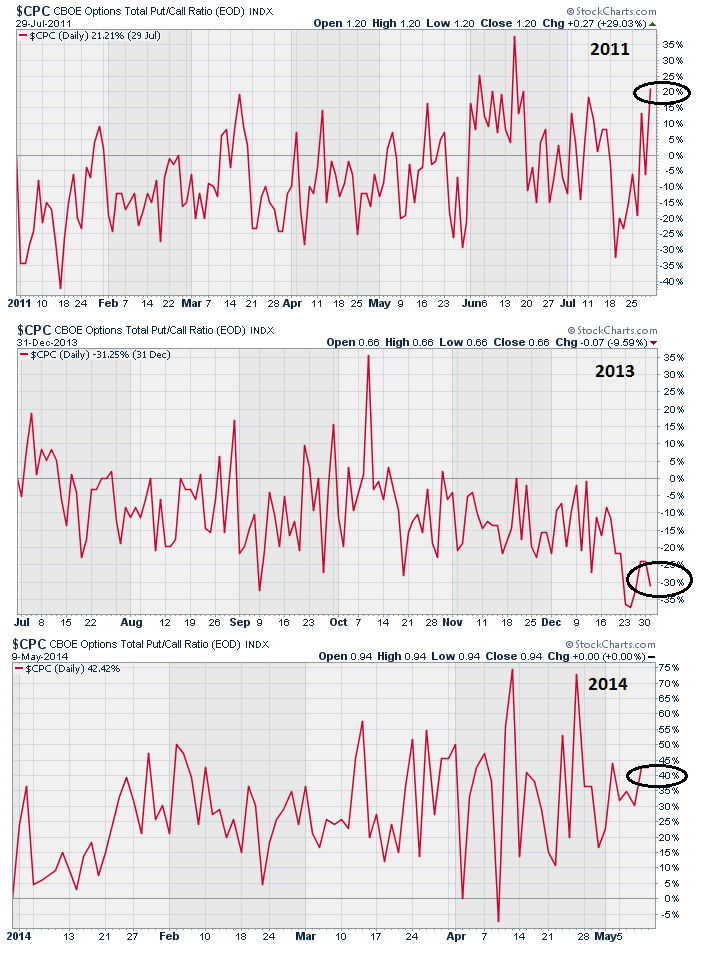
As shown in 2013, as the markets consolidated, there was no “fear” of a correction. In fact, the longer the consolidation ran the less fearful investors got. This was not the case prior to the onset of the correction in 2011, nor is it today.
Lastly, the NYSE High-Low Index, which measures the number of stocks hitting new highs versus new lows, is an indicator of the participation of stocks in the market.
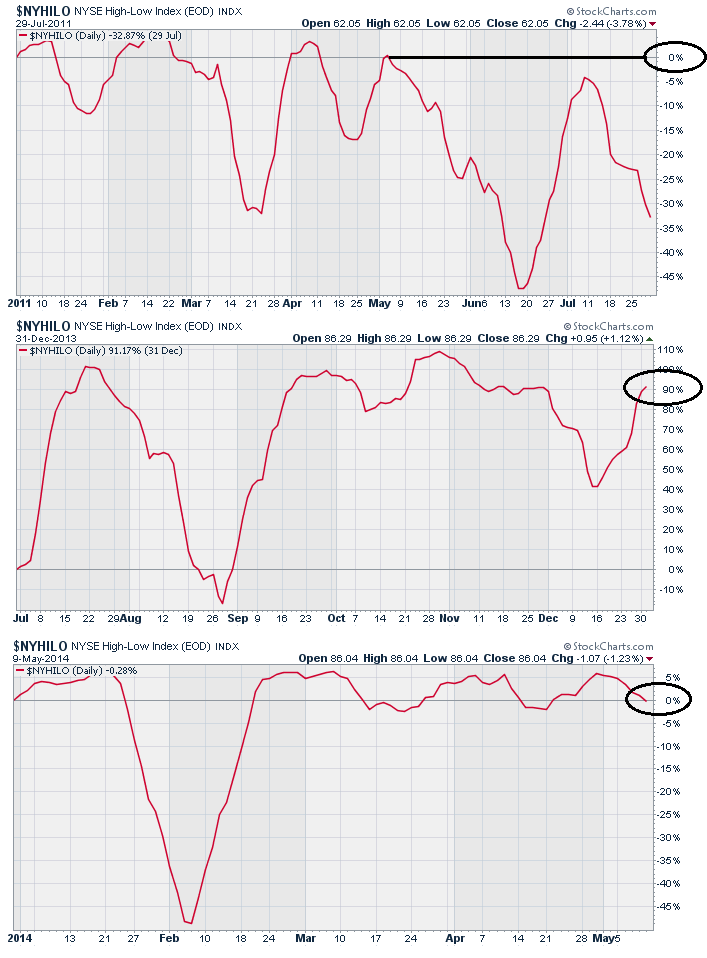
As you can see in both 2011, and currently, the performance of the index in May was near zero as opposed to the consolidation prior to the advance in 2013 where the performance was close to 90%.
The point here is that the current consolidation process looks more similar to 2011 than 2013.
There is also another important similarity.
In 2011, the Federal Reserve was in the process of winding down their second liquidity program (QE2) as opposed to 2013 as the Fed aggressively bought $85 billion monthly in bonds which directly supported asset prices. Today, the Fed is in the process of shutting down their current liquidity program hoping that “forward guidance” will be enough to support asset prices.
Let me be clear. I am not stating that the current consolidation process will absolutely collapse into a sharp correction in the months ahead. However, I am stating that the current environment is more similar to past markets that did correct, than not.
While we are maintaining current portfolio allocations currently, our “alert” signals are high. The chart below shows the paths of the market and where actions will be triggered.
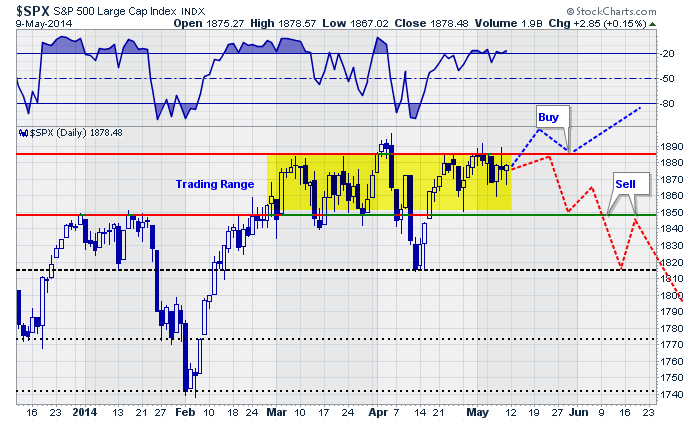
I have denoted where actions will likely be suggested, as well. A breakout to the upside will need to retest previous resistance (top red line) and move higher. This will confirm the breakout, which failed back in April, and suggest that the markets are moving higher and portfolio allocations to equities should be increased.
However, a breakdown in the market below 1850 will be an indication that equity related exposure in portfolios should be reduced. A break of that previous support would suggest a further decline to 1820. At this point, the markets are likely to be fairly oversold on a weekly basis and a bounce that fails at 1850, turning previous support into resistance, will likely be the second and last chance to reduce equity exposure prior to a sharper correction ensuing.
The timing of such events is somewhat nebulous. It could happen next week, next month or next quarter. The point here is that it is important to pay attention to the markets and your portfolio.
As my good friend Richard Rosso, CFP, pointed out to me on Friday:
“The markets spend 5% of their time making new highs. The other 95% of the time is spent making up prior losses.”
This is an important point to remember. Getting back to even is NOT an investment strategy. Therefore, employing some discipline to avoid large losses is FAR more important to your long term investment success than chasing market returns.
“The house doesn’t beat the player. It just gives him the opportunity to beat himself. “
Nick Dandalos
Chasing Yield
As I have discussed previously, there is little doubt that the Federal Reserve’s ongoing liquidity programs have lofted asset prices far in excess of economic value. Furthermore, the move by the Fed to artificially suppress interest rates to abnormally low levels, in hopes of stimulating an economic recovery, has led to the “great yield chase” as investors seek to garner a return on cash.
This chase for yield, combined with the Federal Reserve’s “support” of the financial markets, has led to an excessive level of “greed” within the financial markets. This is clearly shown in the next chart which shows near record levels of asset prices, margin debt or “leverage” and near record low yields on “junk bonds.”
As shown, such a mix of “greed” and “complacency” by investors never ends well. The cause of the reversion is never known beforehand. Economists and analysts routinely come with a variety of metrics as to why current levels of market valuation are reasonable. It is only in hindsight that the culprit is revealed and is usually something the markets were completely unaware of.
The current decline in interest rates suggests that the economy is indeed weaker than current economic reports suggest. The majority of the recent upticks in economic data is due to an inventory restocking cycle after the drawdown in the first quarter. More importantly, for investors, the decline in rates is not supportive of higher asset prices currently. The chart below shows the divergence between stocks and bonds.
Both cannot be correct and the gap will eventually be filled as it has in the past. The important question for investors is whether it will be a sharp rise in interest rates or a decline in stocks? We are likely to have a resolution sooner rather than later as slip into the dog days of summer. (Read “Sell In May?”)
With the markets near their highs for the year, and no technical violations of key support, complacency remains high. That complacency has been emboldened, as I discussed recently, each decline has been met by Federal Reserve intervention to inject liquidity and stem selling.
“Is it “actually” the Federal Reserve’s actions that are supporting the financial markets? To answer this question I examined the weekly changes to the Fed’s balance sheet as compared to the S&P 500.”
“As you can see, through the majority of 2012 the market struggled to advance as the changes to the Fed’s balance sheet limited overall balance sheet increases. However, beginning in December of 2012, as the Federal Reserve fully implemented the current QE program, asset prices begin to surge. Furthermore, as I have highlighted with vertical lines, market declines were halted as large rounds of asset purchases pushed liquidity into the financial system.”
There is currently no reason to reduce portfolio allocations at the current time. However, the rising risks do have my undivided attention. With the Federal Reserve continuing to reduce their support, and eventually end it altogether, there is a rising degree of uncertainty whether the markets can continue to interpret “bad news” as“good news.” With both the S&P 500 and Wilshire 500 indices extremely deviated from their long-term (36 month) moving averages, the risk of a significant “reversion” has increased.
At some point, a negative catalyst will overwhelm the bullish consensus creating a stampede for the exits. I do not know when that will happen or what will cause it, but I do know that it will occur. As I stated above, the markets have not technically done anything wrong as yet, however, there are plenty of reasons to be scared. History is replete with the “blood baths” that have occurred from a combination of excess complacency and overconfidence. This time is unlikely to be any different.
Have a great week.

Lance Roberts

 Following last week’s show we received a ton of requests for more information on income producing investments from Desjardin portfolio strategist Steve Deschesnes.
So Mike has asked Steve to put on a short, live webinar immediately following this week’s show with more recommendations from his Canadian High Income portfolio. Anyone can join but we are restricted to a maximum of 1000 registrants.
CLICK HERE to join or paste the url below into you browser. You can register anytime after 9am Sat May 10th.
https://disnatevents.webex.com/disnatevents/onstage/g.php?d=665109379&t=a
- Topic: High Income Canadian Securities
- Date and Time: Saturday, May 10, 2014 10:05 am Pacific

Each week at Canada Stock Channel, we screen through our coverage universe of dividend paying Canadian stocks, and we look at a variety of data — dividend yield, book value, quarterly earnings — and compare it to the stock’s trading data to come up with certain calculations about profitability and about the stock’s valuation (whether we think it looks ”cheap” or ”expensive”).
History has shown that the bulk of the stock market’s returns are delivered by dividends, and so we pay special attention to dividend history. And of course, only consistently profitable companies can afford to keep paying dividends, so profitability is of critical importance. Dividend investors should be most interested in researching the strongest most profitable companies, that also happen to be trading at an attractive valuation — maybe there is a company-specific reason causing the stock to be ”cheap” or maybe the entire sector is taking a hit, but whatever the reason, we think there is great value in ranking our coverage universe weekly using our proprietary DividendRank formula, and sharing the top stocks with our subscribers, neatly divided into 17 sectors/categories.
These are the three stocks in each category that our DividendRank system has identified as the top most ”interesting” … this is meant purely as a research tool to generate ideas that merit further research.
**….click HERE to see the top 3 Dividend Paying Companies in each of 15 Business Sectors. The screenshot below shows how each sector is presented. On this screenshot below the individual links are not active, so click HERE or on the image below to see all 15 sectors presented as below, but with active individual links – Editor Money Talks.

Sell in May and go away?
We Fools know to ignore such nonsense. For those of us looking to accumulate wealth by investing in equities for the long term, May is just as good as any other month to put our hard-earned savings to work.
In our members-only Stock Advisor Canada service, we’re not taking the summer off. In fact, in less than one week (next Wednesday, May 14), we will release our next two official stock recommendations.
The two fully vetted companies that are on tap, one Canadian- and one U.S.-listed, represent the best ideas for new money that our team of four Stock Advisor Canada analysts have right now.
If you want access to these two brand-new ideas, and the 14 recommendations we’ve brought our subscribers thus far, as well as a plethora of other tools that make this much more than just a “stock-picking service,” click here now to be taken to our sign-up page.
To help tide you over until next week’s release, this week’s Take Stock is dedicated to ensuring that you saw the recent collection of stock ideas put forward by our team of Fool.ca contributors. We asked the team to pick their favourite Canadian stock ideas right now. Here’s what they came up with:
Robert Baillieul: Inter Pipelines (TSX: IPL)
I doubt you’ve heard of this company. Though it’s not a consumer-facing name, this stock might become one of your favourite names on this list.
Inter Pipeline operates 6,400 kilometres of oil and gas pipelines as well as several massive storage facilities in Western Canada and Europe. We love these types of assets here at The Motley Fool because they tend to have long lives and face limited competition. Once built, they can be like a toll road, generating steady profits year after year, which, generally speaking, can allow a company to return ample cash to shareholders in the form of dividends.
Today the stock yields 4.3% and has increased its payout 10 times over the past decade. And in my view, thanks to Alberta’s booming oil production, investors should be able to count on more dividend hikes for decades to come.
Fool contributor Robert Baillieul has no positions in any of the stocks mentioned in this article.

Benjamin Sinclair: MEG Energy (TSX: MEG)
MEG Energy is a pure-play heavy oil producer in Alberta. The company’s production, and most immediate growth prospects, come from Christina Lake, which I believe to be a very high-quality asset. As a result, MEG is one of the industry’s lowest-cost producers, with net operating costs of only $10 per barrel.
MEG is growing aggressively, with plans to more than double 2013’s daily production by 2015. With what I believe to be such a quality asset, MEG’s high growth should create tremendous value for shareholders, especially if transportation bottlenecks continue to weaken. As a bonus, MEG trades at only 1.05 times the present value of its proved reserves.
Fool contributor Benjamin Sinclair owns shares of MEG Energy.

Neha Chamaria: PotashCorp (TSX: POT)(NYSE: POT)
PotashCorp’s recently released first-quarter numbers and outlook should be enough to pique any investor’s interest now.
The company’s Q1 numbers not only beat Street estimates, but the company also improved its guidance for 2014, encouraged by improving fertilizer market fundamentals. PotashCorp’s order flow into the second quarter remains strong, with the U.S. spring planting in progress and the Brazilian season nearing. Meanwhile, PotashCorp is also on track to cut potash costs by $15-$20 a tonne this year, which should further boost margins.
PotashCorp increased its quarterly dividend by 25% in 2013, and its stock currently sports a juicy dividend yield of 3.6%. Given that the company generated greater free cash flow year over year in the first quarter, I’m not ruling out another dividend hike.
These factors, coupled with rumours of BHP Billiton eyeing PotashCorp yet again, should encourage investors to watch the fertilizer stock closely.
Fool contributor Neha Chamaria does not own shares in any of the companies mentioned at this time. The Motley Fool owns shares of PotashCorp.

Matt Smith: Parex Resources (TSX: PXT)
My top stock idea this month is small-cap oil explorer and producer Parex Resources, which operates predominantly in Colombia. Over the last year the company’s share price has spiked a massive 158%, but despite this significant gain I believe there are a range of catalysts that could drive its share price higher.
The company is targeting significant growth in oil reserves and production through an aggressive acquisition program. Coupled with solid organic oil production, I believe these moves should significantly boost Parex’s financial performance.
First-quarter 2014 oil production was a record 18,245 barrels daily, a healthy 7% increase quarter-over-quarter and a massive 28% year-over-year. Second-quarter 2014 production is expected to grow 3% to 6% compared to the first quarter, which is 19,000 to 19,500 barrels of crude daily.
With Parex’s oil pricing benchmarked to Brent, any significant growth in crude production should continue to boost its financial performance and ultimately, in my view, its share price.
Fool contributor Matt Smith does not own shares in any of the companies mentioned.
Karen Thomas: Nuvista (TSX: NVA)
In my view, Nuvista is in a very attractive spot right now, experiencing accelerating netbacks along with low-risk, repeatable increases in production. Nuvista’s focus on natural gas is working for the company at this time, as natural gas prices have been strengthening. With natural gas inventory levels 50% lower than the five-year average, this trend should continue to strengthen.
Nuvista is focusing on the Montney in Alberta for its superior economics and in response to the strength in natural gas liquids pricing. The economics of this area look quite attractive. Nuvista has seen average internal rates of return of over 50% in this area.
Looking ahead, the company is confident that it will achieve overall annual production growth of 25% through 2015, and is spending in order to expand its infrastructure to ensure that production can access the market.
The company’s balance sheet is healthy, production and cash flow are growing at very strong rates, and with natural gas and natural gas liquids pricing on the rise, I believe the future looks bright.
Fool contributor Karen Thomas owns shares of Nuvista.
Nelson Smith: Empire Company (TSX: EMP.A)
Shares in Empire Company hit a fresh 52-week low in April, selling off in part because of disappointment from Sobey’s quarterly results. The company is experiencing some growing pains from its $5.8 billion acquisition of Safeway’sCanadian operations, which seem to be temporarily keeping the stock down.
Once the company irons out the kinks, I believe it’s positioned to be a true Canadian retail powerhouse. It has already flexed its might with suppliers, stating any prices increases for 2014 wouldn’t be accepted. Even though Sobeys is a true national competitor to Loblaw, it currently trades at a significant discount to its peer. In my view, shares should perform well once results get a little better and investors start warming up to the name.
Fool contributor Nelson Smith does not own shares in Empire Company.

Justin K. Lacey: DIRTT Environmental Solutions (TSX: DRT)
My top stock idea for May is DIRTT Environmental Solutions, a manufacturer of fully customizable interiors for various industries, including corporate, government, education and healthcare.
The key to DIRTT is its proprietary 3D technology software, “ICE,” which it developed to eliminate human error, reduce waste, and provide a more efficient method for designing, constructing and installing building interiors. After a lackluster start to life in the public markets, DIRTT has found its footing, and is up nearly 20% since its IPO in November 2013.
The market opportunity is significant – the U.S. non-residential construction market is estimated at approximately U.S. $570 billion. But with this small-cap stock, investors should expect a high degree of volatility as well.
Fool contributor Justin K. Lacey owns shares in DIRTT.

Matt DiLallo: Brookfield Property Partners (TSX: BPY.UN)(NYSE: BPY)
I believe Brookfield Property Partners offers investors a compelling combination of income and value. The global real estate owner pays a very generous distribution of more than 5%. On top of that the units are selling for a discount of about 20% below the net value of the company’s real estate assets.
That combination of income and value, when combined with the company’s organic growth opportunities just within its current portfolio, should yield above-average long-term returns. In fact, Brookfield Property Partners is confident that it can organically grow its value by 20% annually through 2018.
Add the company’s long history of accretive acquisitions and, in my view, Brookfield Property Partners is the one Canadian real estate company to buy.
Fool contributor Matt DiLallo owns shares of Brookfield Property Partners.
Michael Ugulini: Peyto Exploration & Development (TSX: PEY)
Peyto Exploration & Development engages in the exploration and development of high-quality gas properties. It is a producer of unconventional natural gas in the Deep Basin of Alberta.
I’ve held shares in Peyto for almost 10 years now. As an income investor I like the regular monthly dividends. In mid-April, Peyto confirmed dividends for the second quarter of 8 cents per common share for the record dates of April 30, May 31, and June 30, 2014.
Regarding its assets in its geographically focused core areas, 97% are processed by the company and 99% are operated by Peyto. The company has a 97% interest in nine processing facilities. It has 425,000 net acres and 900-plus producing zones in these core areas.
Fool contributor Michael Ugulini owns shares of Peyto Exploration & Development.
The Foolish Bottom Line
Many thanks to our contributors for putting forward this diverse collection of ideas!
If you’re thirsty for more ideas, this is just the tip of the iceberg. When you become a Stock Advisor Canada member, you’ll get two, fully researched stock ideas per month (one from the Canadian market and one from the U.S.), delivered to your inbox every month.
And as I mentioned, this is more than just a “stock-picking” service. In addition to these stock recommendations, our members also receive Weekly Updates that keeps them up to speed on all our scorecard companies, access to our members-only Discussion Boards, the ability to participate in our online analyst Town Hall live chats, and more. For more information on how to sign up, see the ad below. Can’t wait to have you on board!
Sincerely,
Iain Butler
Chief Investment Adviser
Motley Fool Canada
P.S. Don’t miss out — next Wednesday, our premium Stock Advisor Canada service is publishing our #1 TSX and #1 U.S.-listed stock for new money! Right now, you can sign up to join Stock Advisor Canada and pay just $99 — a rate 67% OFF the usual retail price ($299). To get started, click here now.
We had a bit of a scare in the markets last month. At one point, the S&P 500 fell more than 4%, causing some permabears to proudly proclaim that the “bubble” had burst.
Of course, they’re not quite so vocal now that the market has rebounded and is back within 1% of its all-time high.
As you know, we’re not market timers at Investment U and The Oxford Club. But I believe this market has a long way to run before the bulls stop making money.
Market History
Although this bull market is getting mature, it is not ready for the rocking chair. The bull has now been around for 63 months. That’s longer than nine of the 15 bull markets since 1871.
Surprisingly, though, it still has five more months to go until it is average in terms of length – and 41 months before it reaches the post-World War II average.
Bull markets have been getting longer since the end of the War – a lot longer. Starting with the bull that began in 1949, bull markets have lasted an average of 104 months – or nearly nine years. That five-year old bull doesn’t sound quite so old now, does it? Of the seven bull markets (including the current one) since then, this one ranks only fifth in terms of length.
From the low in 2009 at 666.79, to the all-time high of 1,897.28, the S&P 500 has risen 185% – a heck of a move. That’s above the 163% average since 1871. However, the modern bull market (since the end of WWII) has averaged 259% gains.
Interestingly, three bull markets gained less than 100% while the other three were up 391%, 414% and 516%, respectively. Could the fact that the current one broke through the 100% barrier mean that it’s headed significantly higher?

If the market simply performed according to the average modern day bull market, it would last another 3 1/2 years and rise 74%.
Not Cheap, but Not Expensive
Many pundits call the market expensive at 17.2 times earnings. By historical bull market standards, it’s not.
The historical average of the S&P 500 is 16.4. While the current market is not dirt-cheap, it’s hardly in bubble territory.
The modern-day bull market on average doesn’t top out until the price-to-earnings ratio (P/E) of the S&P 500 hits 21.3.
Applying the 21.3 P/E to trailing 12 months earnings gives us a price target of 2,322, or 22% higher than the all-time high reached last month.
Let’s assume that I’m right and the bull market lasts another few years. We’ll also assume that Wall Street’s consensus estimates for the S&P are right on target. If we apply the 21.3 P/E to 2014 estimates we get a target of 2,510, a 32% gain.
In 2015, we’d be looking at an S&P 500 at 2,791, or 47% higher.
And using 2016’s estimates, the S&P would stand at 3,101. A 63% climb from the all-time high.
And if the economy gets better, those earnings could wind up better than the consensus.
Don’t Fight the Fed
Lastly, it’s never a good idea to bet against monetary policy. And I expect the Fed to keep rates low for the foreseeable future.
Consider the economic statistics that were released last week.
First quarter GDP growth was a pathetic 0.1%. Granted, it was impacted by the severe weather that affected much of the country this winter. But still, it’s a bad number.
The jobs data were a mixed bag. There were 288,000 new jobs created, which was positive. But wages did not increase and the unemployment rate fell to 6.3%, mostly due to the fact that more people gave up looking for jobs, so they were no longer counted.
Though the Fed has been tapering (buying back fewer bonds) by about $10 billion per month, it will likely keep interest rates low for a while.
The bond market certainly thinks so. Despite strong nonfarm payroll numbers, the lower unemployment rate and the near record highs in the market, the yield on the 10-year Treasury bond hit its lowest level in six months last Friday.
If you believe as I do, that markets are better predictors of economic events than economists, the bond market is telling you rates aren’t going higher for a while.
So let the Chicken Littles, the permabears and the nattering nabobs of negativity tell you why the bull market is over. If history is our guide, the bull still has a lot more gains to give us.
Good investing,
Marc

-
I know Mike is a very solid investor and respect his opinions very much. So if he says pay attention to this or that - I will.
~ Dale G.
-
I've started managing my own investments so view Michael's site as a one-stop shop from which to get information and perspectives.
~ Dave E.
-
Michael offers easy reading, honest, common sense information that anyone can use in a practical manner.
~ der_al.
-
A sane voice in a scrambled investment world.
~ Ed R.
Inside Edge Pro Contributors

Greg Weldon

Josef Schachter

Tyler Bollhorn

Ryan Irvine

Paul Beattie

Martin Straith

Patrick Ceresna

Mark Leibovit

James Thorne

Victor Adair