
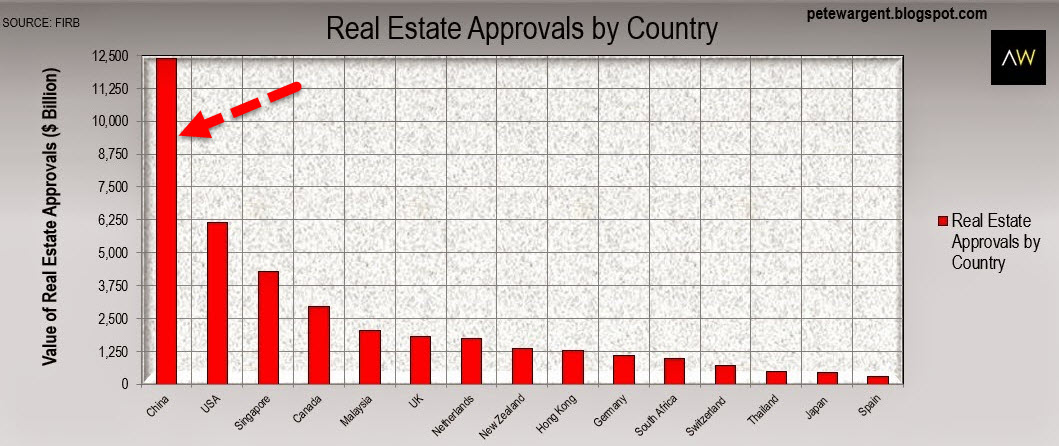
Real Estate
Given the recent admission by the Australian Central Bank that property prices “have gone crazy,” it appears new Chinese ‘regulations’ may just kill Australia’s golden goose of ‘weath creation’ as Aussie’s largest trade partner sees its economy collapse. While the Aussies themselves proclaimed a “war on cash,” it appears, as AFR reports, that Chinese purchases of Australian property have dropped significantly in the past month, according to agents, as buyers struggle to shift money out of the country following Beijing’s move to tighten capital controls. With Chinese banks now limiting any overseas transfer to USD50,000 – in an effort to control capital outflows – and with China dominating the Aussie housing market, one agent exclaimed, “it has affected 70 to 80 per cent of current transactions and some have already been suspended.”

At the epicenter of Canada’s housing bubble, which is now rated as the most overvalued in the world, is the west coast city of Vancouver. It’s there that low interest rates and foreign buying have fueled the average detached home price to a record of C$1.47 million, a 20% increase from the previous year.
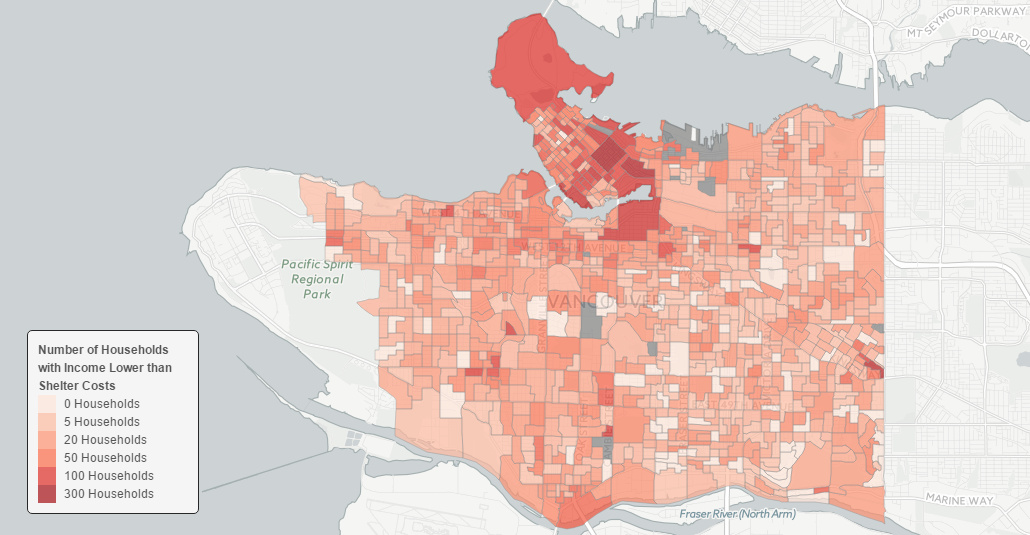
While there are many measures of unaffordability, the government and federal agencies use one such measure frequently called the Shelter-cost to Income Ratio. It essentially compares the annual cost of an individual’s housing with the amount of income they have coming in each year. Federal agencies in Canada consider households that spend 30% or more of total before-tax household income on shelter expenses to have a “housing affordability” problem.
In Vancouver, however, the city has become so unaffordable that 25,000 households pay more for their shelter costs than their entire declared income. This works out to 9.5% of the households in the city – far higher than Greater Toronto (5.9%) or Montreal (5%).
We recently stumbled across a data mapping project by Jens von Bergmann, via the Hongcouver blog. Von Bergmann, who runs a data firm in Vancouver, has compiled a series of interactive maps that overlay census data onto the city. In Canada, the mandatory census happens every five years and creates a wealth of granular information.
Here’s the percent of people in each city block that pay more for housing than they take home in income:

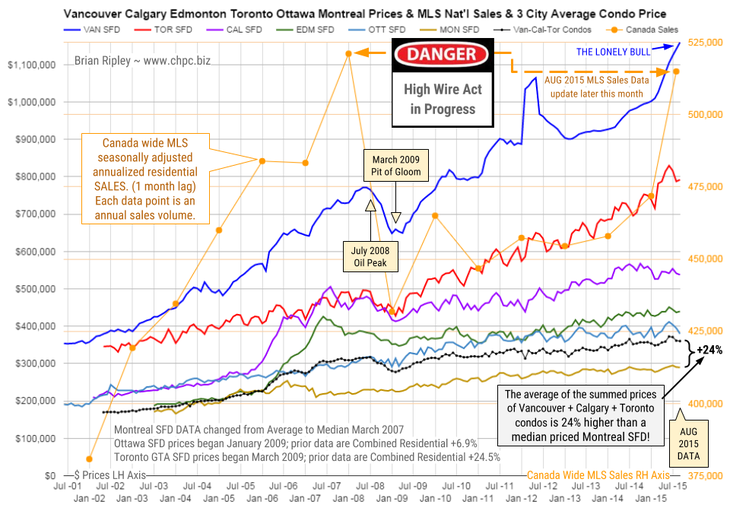
The chart above shows the average detached housing prices for Vancouver, Calgary, Edmonton, Toronto*, Ottawa* and Montréal* (the six Canadian cities with over a million people) as well as the average of the sum of Vancouver, Calgary and Toronto condo (apartment) prices on the left axis. On the right axis is the seasonally adjusted annualized rate (SAAR) of MLS® Residential Sales across Canada. The last data point is for July 2015, and will be updated probably in the second week of September.
In August 2015 Canada’s big city metro SFD prices folded under the weight of seasonality… except of course for the Vancouver bull that pushed buyers into hyperion skies.
Apparently it’s the dirt that inflames big money’s desire to pay a premium for sitting on it, not the least of which is refugee money (The Province August 3, 2015).
It’s too late for the the Canadian national MLS residential annualized housing sales data to break out above the 2007 peak; the season has shifted into the third quarter and sales are heading for their annual nadir.
High net worth trophy hunters have spent the last few years picking off well located SFD properties in hot markets while the hoi polloi settled for anything before being priced out.
Are they going to enjoy being priced in?
According to CMHC, August 13, 2015: “Low overall housing market risk is observed for Vancouver, as none of the individual risk factors are currently detected.”
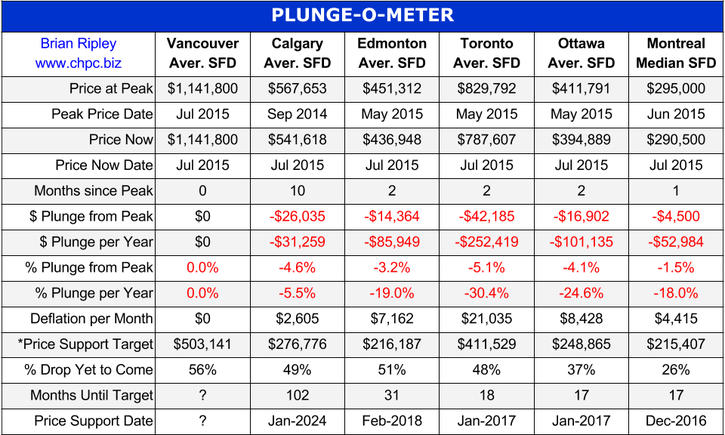
…view the Plunge-O-Meter HERE (The Plunge-O-Meter tracks the dollar and percentage losses from the housing peaks)
At one point last week stocks were down 10% since May. Like many, I own some stocks and/or REITs, so scary days! Oil is down to $40 and likely to stay there for some time. So what are the implications for our main investment market – rental housing?
I phoned a few of our on-site building managers this week and asked them:
- Is the rent down 10% ? Answer: “No, it is flat and renovated suites are up”
- Did 10% of tenants leave? Answer: “No, why?”
- Are you sure the building vacancy hasn’t moved to 10% over the last 2-3 months? Answer: “No, of course not”
- Do competing landlords in the area offer incentives or are their rents down 10% or have they seen 10% vacancies? Answer: “No, they are like ours, all full and same rent, more or less”
I then phoned a few multi-family realtors in Texas, BC and Alberta (three of the markets we’d typically buy in today) and asked:
What is for sale with all this doom-and-gloom, $40 oil and the new orange NDP government in town now in Alberta ?
- Are building values coming down?
- Are there any deals ?
- We have money to invest and want to buy buildings 10% cheaper than a few months ago…
Answer, as you can imagine: “No! prices are still very strong and in MANY case actually have gone up as fearful investors leave the far more volatile industrial or office real estate space and look for safer heavens, let alone the spooked stock investors that lost 100’s of billions the last few weeks in various stock markets around the world.
Sorry, no deals. Many folks even de-listed as they don’t know where to put their cash after they sell their buildings”.
Some doom-and-gloom in the apartment building space!
You see, residential rental real estate behaves fairly predictably in good times AND very predictably in bad times!
That is THE key reason we have made so much money in that space over the last decade and a half, and continue to like them it.
- Even in a $40/barrel oil environment.
- Even in an anti-business, tax-hiking, spend, spend, spend, debt-creation NDP environment (that may soon spread to the whole of Canada).
- Even in a recession or a Dow Jones 1000 point in 2 day retraction environment.
The chart below shows that even in a completely flat market you can make 6-12% by just holding and paying down your mortgage. As in PLUS 6-12%. Not minus.
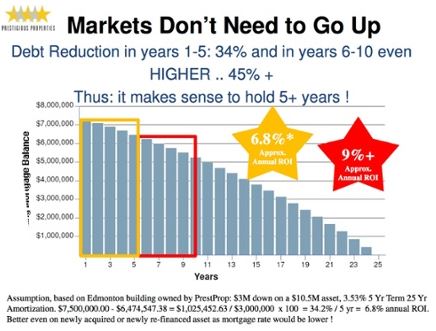
The numbers listed above are even better now as mortgage rates are ridiculously. For example consider this scenario:
$1M asset, $250,000 (or 25% down) invested, with a yield or CAP rate of 5% and a mortgage rate at 2.5% you make $25,000 every year or 10% on the actual cash invested, without any equity upside. Usually we re-invest the cash-flow and force rents up in upgraded units for higher value down the road.
Thomas Beyer is the President and Founder of Prestigious Properties – www.prestprop.com
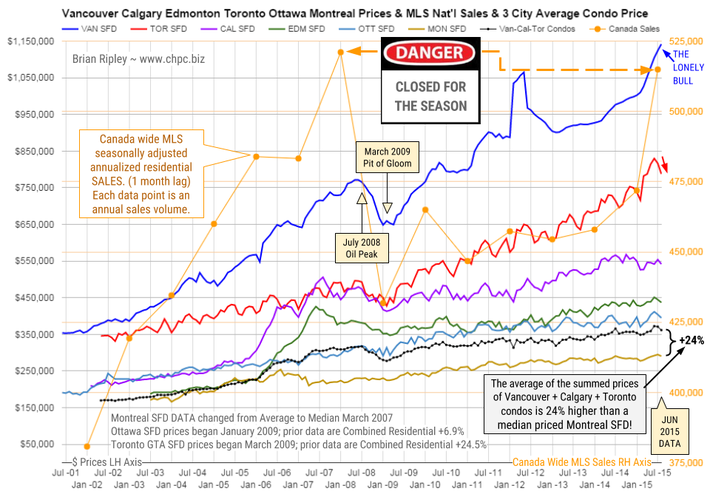
One chart shows the average detached housing prices for Vancouver, Calgary, Edmonton, Toronto*, Ottawa* and Montréal* (the six Canadian cities with over a million people) as well as the average of the sum of Vancouver, Calgary and Toronto condo (apartment) prices on the left axis. On the right axis is the seasonally adjusted annualized rate (SAAR) of MLS® Residential Sales across Canada.
The other chart tracks the dollar and percentage losses from the peak and projects when prices might find support.
….go HERE for Larger Charts more commentary and more articles

-
I know Mike is a very solid investor and respect his opinions very much. So if he says pay attention to this or that - I will.
~ Dale G.
-
I've started managing my own investments so view Michael's site as a one-stop shop from which to get information and perspectives.
~ Dave E.
-
Michael offers easy reading, honest, common sense information that anyone can use in a practical manner.
~ der_al.
-
A sane voice in a scrambled investment world.
~ Ed R.
Inside Edge Pro Contributors

Greg Weldon

Josef Schachter

Tyler Bollhorn

Ryan Irvine

Paul Beattie

Martin Straith

Patrick Ceresna

Mark Leibovit

James Thorne

Victor Adair