
Real Estate
A house on 73 Mount Kellett Road on the Peak was leased for HK$1.6 million (US$206,000) a month, Hong Kong Economic Times reported, citing unidentified sources. That translates into about US$2.5 million a year for the tenant.
The amount surpassed the previous record that was just set two months ago, signaling robust demand among the richest tenants in the world’s most expensive property market.
The five-bedroom house comes with a private elevator and a garden of 650 square meters.
Despite the falling rents across the city, Hong Kong’s most upscale market is defying the trend. The former rental record was held by Wharf Holdings Ltd., which leased a luxury house in its 11 Plantation Road project for HK$1.35 million a month in March.

The perfect storm of historically low inventory coupled with immediate demand for larger accommodations and ultra low interest rates is beginning to fade from the current market behaviour. Consecutive months of record setting new listings data has the inventory levels on the rise. Resulting in home values which had been exponentially increasing is beginning to slow.
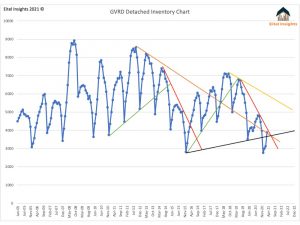
Active listings have risen over 46% in the past two months. From the total inventory of 3,126 in February 2021 to 4,588 during April 2021. The sudden rise of inventory has led to a break of the initial downtrend (red trendline). As the available properties continues to rise throughout the spring and into summer months prices will likely begin to move sideways. Eitel Insights looks for the inventory to challenge the next downtrend (yellow trendline) which implies inventory rising to 5,700 during the peak months of 2021.

Home values did increase once more but the average price was only able to increase by $14,000, the lowest price increase since May of 2020. Home prices during May 2020 were averaging $1.586M, by March 2021 the average price had increased to $1.958M. That increase implies an average growth of $37,200 each month over the previous 10 months. The nominal price increase of $14,000 from March 2021 to April 2021 rose the average price for a home inside of Greater Vancouver to $1.972M, just shy of the illustrious $2 million price bracket.

Evidence of the average sales potentially reaching the near term highs is the data that comes from the advancing declining stats. When comparing the individual 20 areas which make up Greater Vancouver. Using a month over month comparison the past month of April realized 9 areas inside of Greater Vancouver where the average price increased, but had 11 areas declined. That marks the first instance, over the past year, where the declining areas outnumbered the advancing.
As home values begin to reach their apex of the growth phase, the inevitable ebb to the recent markets flow, will result from the rising inventory environment coupled with stricter lending policies and an interest rate that is no longer at historically low levels. The natural barrier of $2M for the average home in Greater Vancouver will likely hold as a new artificial ceiling.
The possibility of a 8-10% correction after the peak occurs is realistic. That would imply a retests the previous market cycle high of $1.830M. To expect prices to correct below the previous channel is an unlikely outcome. More likely is an evolution out of the growth trend which increased home values over $386,000 to a period of sideways action, as price discovery confirms the previous technical break out.
Clients and followers of Eitel Insights analytics will remember our initial published article in 2017 using technical indicators to call the top of the Greater Vancouver housing market. Subsequently the home sale prices corrected 20% during 2019. The upcoming sideways action will not likely result in a major correction as the last cycle offered. Reason being the Bank of Canada created the artificial floor to home values when they instigated the the Canadian Mortgage Bond Purchasing Program in 2020. (See past article for details regarding the CMBP)

Sales continued at a high pace during April with 1,667 completed transactions occurring. Over the past two months the sales achieved over 3,600 deals. That many transactions in a two month period has only occurred during 2015 and 2016 frenzied market conditions. Key thing to remember all good things come to an end. Homeowners looking to capitalize on the high priced environment may want to list sharply. As the inventory continues to build some of the exploitative tactics that are working for sellers may be coming to an end.
As individual markets vary across Greater Vancouver, get in touch with Eitel Insights to find out how much your property holdings have increased over the recent run up. Become a client to receive actionable intelligence based on analytical interpretation.
Dane Eitel, Founder and Lead Analyst,
Eitel Insights

The retreat from major cities has been the pandemic’s big real-estate story — but that doesn’t mean metropolitan house prices have suddenly got cheap.
From New York to London to Sydney, ultra-low interest rates and vast government fiscal support have limited distressed sales. Still, apartment rents have plummeted and suburban bidding wars have erupted as millions of workers have learned they can work from anywhere.
“There’s been a spatial shock, whereby you don’t have to go to the city to earn money necessarily,” said Andrew Burrell, chief property economist at Capital Economics. “We think cities will change a lot.”
As vaccine rollouts allow more cities to tentatively reopen offices, bars, restaurants and museums, here’s a look at what’s changing — and what’s stayed the same.
Rents are where the Covid-19 effect is most obvious. Widespread job losses in fields like hospitality mean big groups of renters simply can’t afford to pay what they did previously. International students are gone. Young people have moved back in with parents.
And at the upper end of the market — where the biggest price falls have been — wealthier renters have opted not to stay in virtually closed cities.
While the price drops have stabilized, landlords are still having to offer steep discounts and perks to encourage people back. Which is an opportunity for some.
Record Breaking Month in Greater Vancouver for Home Sale Prices & New Monthly Listings
Yet another record month for the Greater Vancouver housing market. The average cost to purchase a detached property inside of REBGV increased by $89,000. Bringing the average to $1.958M. This was aided by the continued high sales totalling 1,973. Accumulating the second largest sale total in the history of Greater Vancouver real estate. In attempts to capture the newly minted growth phase in home prices, sellers came to the market in droves. Setting the new record with 3,368 newly listed detached properties in March. The record amount of activity to kick off the spring market is likely to continue as March through May are typically the busiest months of the year.

Home sale prices continued their escalation beyond the previous market cycle. Amazingly, another $89,000 was added to the average sales price from the previous month. The new record price of $1.958M represents a 7% gain over a two month span. The 7% growth is the first increase above the previous market cycle which had held home values range bound for 5 years.
The biggest gainers this past month were Pitt Meadows up an incredible $233,000 month over month, representing an astonishing 20% increase. The average property in Pitt Meadows is selling for $1.44M. Vancouver West rose $500,000 up 14%, bringing the average price to $4.025M. The standout of the gainers over the past two months is Whistler. This past month over $600,000 was added to the average price. Couple that with the $900,000 increase from the month previous, and Whistler has increased over $1.5M in just the past two months. The recent spike in value has increased the averages price to over $4.325M for a detached property in Whistler. The massive increases to these areas have aided the REBGV average price to gain distance between the price point and the aggressive uptrend instigated during July 2020.

Breaking beyond the 5 year price boundary has been clearly aided by the supply demand imbalance. March 2021 just recorded the second largest imbalance between the two market metrics on record. The total gap between the supply versus demand during March was 3.6. Falling just 2 basis points below the all time high which occurred during March 2016 with a 3.8 gap. Interestingly, previous to the past month the second largest discrepancy occurred during April 2016. This implies buyers are unlikely to receive any reprieve in the short term.

As forecasted over the previous months, sellers are entering the market with full force. A record setting total of over 3,300 properties were listed in last month. March 2021 represents only the 4th instance where new listings accumulated over 3,000 in a single month. Should the high new listings count continue to rise through spring and into the summer months, home values will likely realize a near term price peak during the summer.
Even with a record amount of new listings, the total inventory continues to remain in the doldrums of the chart. A glimmer of hope would be the total inventory of 3,886 is attempting to break out of the 3 year immediate downtrend (Red trend line). Established during June 2019 when there was over 6,700 active listings. The enormity of new listings only resulted in a net of 880 total active listings compared to the previous month. However should inventory continue to grow a the 29% as was the case in March. The key figure of 5,700 active listings is well within reach by the late summer, or early fall.

Sales fell just short in completing a trifecta of records during March. The 1,973 sales were only 177 shy from the all time high achieved during March 2016 of 2,150 sales. With the abundance of new listings coming to market, the buyers snatched up the choice properties, and continued in the bidding war mentality which pushed the average sales price to over 101% of the asking price. This is only the 9th instance in which sales price was over 100% of the asking. Of those previous 8 instances they all occurred between December 2015 – July 2016. Implying the next several months of data could result in a continuation of the sales prices being higher than the asking prices.
Importantly, all subsections of the market are now selling. Over the past year the entry level homes have been selling at a frenzied pace, that has worked all the way up to the luxury market. March realized 49 properties that sold over $5M. The 49 sales is an increase of 250% compared to the preceding 3 year average of 14 sales per month. The prices of the luxury market is still not quite back to the peak conditions of 2017. As the averages sales price was $8.6M. However the average sales price in March of $7.6M, is up over $1.6M from the low recorded in May 2020 of $6M.
Dane Eitel
Founder & Lead Analyst
EitelInsights.com
There have been clear success and failures in the real estate market during the pandemic but the general backdrop is good according to Vision Capital CEO Jeff Olin.
“Not withstanding the increase in interest rates, the spread between the capital yields in REITs and in investment grade bonds has been almost double the long-term trends,” Olin said. “And when you can make little or no money on bonds, the thirst in the private market for property is extraordinary.
“According to Citi, there is $345 billion of dry powder funded in Blackstone, in Brookfield, and in pension funds that are increasing their weights to real estate from five to 10% to 15% to 20%. Private equity funds that have been fully funded are looking to invest in property, and so that’s a very good backdrop for the public markets.”
To illustrate his point, Olin highlighted Vision’s participation with Blackstone on an investment in Tricon – focused predominantly on… CLICK for the complete article
You can also watch Jeff Olin’s 2021 World Outlook Financial Conference presentation HERE

-
I know Mike is a very solid investor and respect his opinions very much. So if he says pay attention to this or that - I will.
~ Dale G.
-
I've started managing my own investments so view Michael's site as a one-stop shop from which to get information and perspectives.
~ Dave E.
-
Michael offers easy reading, honest, common sense information that anyone can use in a practical manner.
~ der_al.
-
A sane voice in a scrambled investment world.
~ Ed R.
Inside Edge Pro Contributors

Greg Weldon

Josef Schachter

Tyler Bollhorn

Ryan Irvine

Paul Beattie

Martin Straith

Patrick Ceresna

Mark Leibovit

James Thorne

Victor Adair