

Record Breaking Month in Greater Vancouver for Home Sale Prices & New Monthly Listings
Yet another record month for the Greater Vancouver housing market. The average cost to purchase a detached property inside of REBGV increased by $89,000. Bringing the average to $1.958M. This was aided by the continued high sales totalling 1,973. Accumulating the second largest sale total in the history of Greater Vancouver real estate. In attempts to capture the newly minted growth phase in home prices, sellers came to the market in droves. Setting the new record with 3,368 newly listed detached properties in March. The record amount of activity to kick off the spring market is likely to continue as March through May are typically the busiest months of the year.

Home sale prices continued their escalation beyond the previous market cycle. Amazingly, another $89,000 was added to the average sales price from the previous month. The new record price of $1.958M represents a 7% gain over a two month span. The 7% growth is the first increase above the previous market cycle which had held home values range bound for 5 years.
The biggest gainers this past month were Pitt Meadows up an incredible $233,000 month over month, representing an astonishing 20% increase. The average property in Pitt Meadows is selling for $1.44M. Vancouver West rose $500,000 up 14%, bringing the average price to $4.025M. The standout of the gainers over the past two months is Whistler. This past month over $600,000 was added to the average price. Couple that with the $900,000 increase from the month previous, and Whistler has increased over $1.5M in just the past two months. The recent spike in value has increased the averages price to over $4.325M for a detached property in Whistler. The massive increases to these areas have aided the REBGV average price to gain distance between the price point and the aggressive uptrend instigated during July 2020.

Breaking beyond the 5 year price boundary has been clearly aided by the supply demand imbalance. March 2021 just recorded the second largest imbalance between the two market metrics on record. The total gap between the supply versus demand during March was 3.6. Falling just 2 basis points below the all time high which occurred during March 2016 with a 3.8 gap. Interestingly, previous to the past month the second largest discrepancy occurred during April 2016. This implies buyers are unlikely to receive any reprieve in the short term.

As forecasted over the previous months, sellers are entering the market with full force. A record setting total of over 3,300 properties were listed in last month. March 2021 represents only the 4th instance where new listings accumulated over 3,000 in a single month. Should the high new listings count continue to rise through spring and into the summer months, home values will likely realize a near term price peak during the summer.
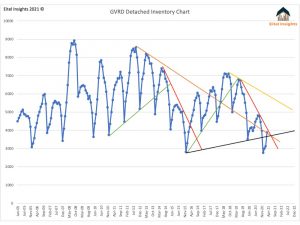
Even with a record amount of new listings, the total inventory continues to remain in the doldrums of the chart. A glimmer of hope would be the total inventory of 3,886 is attempting to break out of the 3 year immediate downtrend (Red trend line). Established during June 2019 when there was over 6,700 active listings. The enormity of new listings only resulted in a net of 880 total active listings compared to the previous month. However should inventory continue to grow a the 29% as was the case in March. The key figure of 5,700 active listings is well within reach by the late summer, or early fall.

Sales fell just short in completing a trifecta of records during March. The 1,973 sales were only 177 shy from the all time high achieved during March 2016 of 2,150 sales. With the abundance of new listings coming to market, the buyers snatched up the choice properties, and continued in the bidding war mentality which pushed the average sales price to over 101% of the asking price. This is only the 9th instance in which sales price was over 100% of the asking. Of those previous 8 instances they all occurred between December 2015 – July 2016. Implying the next several months of data could result in a continuation of the sales prices being higher than the asking prices.
Importantly, all subsections of the market are now selling. Over the past year the entry level homes have been selling at a frenzied pace, that has worked all the way up to the luxury market. March realized 49 properties that sold over $5M. The 49 sales is an increase of 250% compared to the preceding 3 year average of 14 sales per month. The prices of the luxury market is still not quite back to the peak conditions of 2017. As the averages sales price was $8.6M. However the average sales price in March of $7.6M, is up over $1.6M from the low recorded in May 2020 of $6M.
Dane Eitel
Founder & Lead Analyst
EitelInsights.com


