
Gold & Precious Metals

The Gold Report: The Global and Mail reported that more than 50 private-equity mining deals were struck in Canada in 2011—more than in any other sector. Why is private equity pouring venture capital into junior mining plays faster than any other Canadian business sector?
Stephen Taylor: The important thing is that private equity funds have the patience and the experience to take the long-term view that’s required with development-stage mining companies. There’s been a growing dysfunction in the U.S. initial public offering market for small-cap companies and development-stage enterprises of any type. It has led to depressed valuations. It’s not surprising that managers of private equity funds have the patience and see some bargains and are jumping into the sector.
TGR: Most of the deals involved minority positions, not takeovers. Why?
ST: That is really the best way to do deals as a private equity investor. These firms are looking to partner with or back experienced management teams. Experienced management teams are increasingly reluctant to cede control to an outside firm that doesn’t have real expertise in the mining sector. Trying to seek majority control would be a mistake.
TGR: What was the performance of The Taylor Fund in 2011?
ST: The fund, which has about $45 million under management, had a rough year. It was down about 20% in 2011 after a gain of 21% in 2010 and 96% in 2009. Since inception, it’s averaged just more than 26% a year versus about 9% a year for the S&P 500.
TGR: What’s the current industry weighting of the fund?
ST: It’s about 40% invested in energy, which is mainly oil and gas. Mining comprises about 30%. About one-third of the companies are in China, another third are in the U.S. and the final third are in Canada. The Canadian component includes many companies that have substantial operations in other parts of the world.
TGR: You previously told The Gold Report that you saw some “overdone selloffs in the resource space.” Was the selloff that occurred in the latter half of 2011 overdone?
ST: It clearly was. It seemed that 2011 was particularly fierce in the junior resource space. Sharp selloffs have been followed by quick bounce-backs. Miranda Gold Corp. (MAD:TSX.V) sunk from $0.67/share to $0.24/share at year-end but has since recovered somewhat. Silvermex Resources Inc. (SLX:TSX; GGCRF:OTC) went from about $1/share to $0.36/share at year-end, but is back up to $0.46/share.
TGR: Did the Taylor Fund add to existing positions or new positions as other investors were exiting junior mining plays?
ST: We were indeed. We were selective buyers on our core positions like Lumina Copper Corp. (LCC:TSX). We participated in the recent Anfield Nickel Corp. (ANF:TSX.V) financing. We want to be selective in our new additions, but we’re always going to be looking to quality management teams as one of our first conditions.
TGR: How long on average do you hold a position in junior mining?
ST: Typically, two to three years. Last year, we did lighten up in some names where the results weren’t what we had hoped. We lightened a bit on Fire River Gold Corp. (FAU:TSX.V; FVGCF:OTCQX) after some disappointing results.
TGR: You remain bullish on precious metals in general?
ST: As long as central governments around the world continue to print money and to telegraph a low to negative real interest-rate policy, precious metals are the place to be quite frankly. The next two quarters may be flat to sideways, but over the next two to three years precious metals are going much higher.
TGR: News about the Greek debt deal pushed the gold price up recently. Was this just a short-term uptick?
ST: The Greek debt deal is the first of many as other countries around the world will ultimately be forced to restructure their obligations as well. All of these will contribute to rising demand for precious metals and will support higher prices. It could occur in the next quarter or the next year, but I won’t be so bold as to make that distinction. I do know I want to be long on precious metals and that they’re going to be much higher over the course of several years.
TGR: Anfield and Lumina are nickel and copper plays. Do you see value in base metals?
ST: I do. There’s a long-term secular rise in living standards that will continue for a huge portion of the world’s population in China, India and Brazil. As this process grinds forward over the next 10–30 years, regardless of short-term disruptions, there will be an inevitable increase in demand for base metals. Existing deposits also continue to be depleted. As owners of some of the largest undeveloped base metals projects in the world, Anfield and Lumina are going to be well positioned.
Lumina is one of many Ross Beaty–related companies with which we’ve been involved. He has a tremendous record at generating shareholder value. The company has done extensive drilling on the Taca Taca property in Argentina during the past couple of years. There has also been significant historic drilling done on the project. The deposit just gets bigger and bigger. It’s close to being the largest undeveloped copper deposit in the world, if it’s not already.
That’s going to be a very valuable resource to someone. The company has indicated that it’s going to put itself up for auction at some point in the next several months. Based on transaction prices for other undeveloped copper deposits, the ultimate sale price could be in the neighborhood of $1 billion, or about $20/share. I think Lumina will be acquired or bought out in 2012 at a price in excess of $20/share.
TGR: David Strang, who is president and CEO of Lumina, was also involved in the management teams of Global Copper, Northern Peru Copper, Lumina Resources and Regalito Copper, all of which were bought by bigger players. How long before Lumina gets a takeover bid?
ST: Within the next 6 to 12 months. It’s possible that an unsolicited, unexpected bid could emerge before then, but I believe the company will begin to actively solicit bids in the first half of 2012.
TGR: What does Lumina need to do before that happens?
ST: It just needs to continue to derisk the project. The largest elements have been done. Frankly, the deposit is so big at this point that I almost wish the company would explore creating a spin-off vehicle to hold a portion of it for further exploration and perhaps to sell down the road.
TGR: It’s an interesting story because it’s less than 100 kilometers from the Escondida Copper Mine owned and operated by BHP Billiton Ltd. (BHP: NYSE, BLT: LON, BHP:ASX) and Rio Tinto Plc (RIO:LSE). That certainly seems like a likely dance partner.
Anfield, which has essentially the same management group as Lumina, has a nickel laterite project in Guatemala. Anfield was assembled by Ross Beaty years ago and seems to work pretty well. Is Anfield a takeover target as well?
ST: I believe it is. This team has skin in the game. They have substantial personal investments in these companies. They also participated in the recent financing. As a side note, they also participated in the Lumina financing in November. I really respect that. It sends a very positive signal when management teams put up their own money and buy at prices that are close to what other investors paid.
TGR: What are some of the companies that you have positions in that are developing precious metals projects?
ST: We continue to be fans of Miranda. It has a number of irons in the fire and, ultimately, one or more of them are going to hit. It did a joint venture with Red Eagle Mining Corp. (RD:TSX.V) on the Pavo Real project in Colombia. I wouldn’t be surprised if Miranda continues to pick up projects in Colombia and elsewhere.
Red Eagle continues to drill Pavo Real. It has been able to attract some sophisticated, smart investors. I’ve heard that Ross Beaty and his group have a position slightly less than 10% in Red Eagle. That speaks volumes as to the quality of the group that Ken Cunningham, CEO of Miranda, and Ian Slater, CEO of Red Eagle, put together.
TGR: Red Eagle has two main projects, Pavo Real and Santa Rosa. Which one of those excites you more?
ST: The drill results from Santa Rosa were OK. Clearly, one hopes for a homerun. The potential for those in a place like Colombia always exists. However, I don’t play favorites. I will stand by the management team and not play geologist today.
TGR: You weren’t overwhelmed by the drill results from Santa Rosa?
ST: Don’t get me wrong. I was not disappointed by the Santa Rosa results. It’s just that I’d love to see a homerun and this was double.
TGR: Do you think it’s starting to look like a bulk tonnage target?
ST: It’s always a possibility. The company didn’t have any preconceptions. The point of the drilling program was to see what it had and which direction that would take it. It’s got some good potential there. Let’s see where the drill bit takes us.
TGR: Miranda has projects in Colombia, Nevada and Alaska. Which one is getting the lion’s share of the attention?
ST: It has good joint venture partners that are busy drilling away in Nevada, one of which is Agnico-Eagle Mines Ltd. (AEM:TSX; AEM:NYSE). But the attention going forward in terms of new developments could be additional land in Colombia. CEO Cunningham clearly has his eyes and ears open. It wouldn’t surprise me to see the company pick up some additional property there.
TGR: You mentioned Silvermex earlier. What are your thoughts on it?
ST: Silvermex continues to do a good job ramping up production at La Guitarra. It’s slow and steady. Its stock got caught in the selloff that we talked about earlier, but it’s trudging along.
I’m very bullish on silver. I believe that could outperform gold on a percentage basis over the next two to three years. Silvermex is a great way to play that trend.
TGR: What’s the next catalyst for that stock?
ST: It’s going to be either the silver price and the macro developments that drive that or further delineation of its plans going forward at La Guitarra. Silvermex is getting some good drill results in some high-grade areas. Everyone’s waiting to see where it wants to go.
TGR: Does Pan American Silver Corp.’s (PAA:TSX; PAAS:NASDAQ) purchase of Minefinders Corp. (MFL:TSX; MFN:NYSE) bode well for a company like Silvermex?
ST: Clearly, Silvermex could be a good acquisition target at some point. It’s a process that will continue into the years ahead, however.
TGR: You also have a position in Largo Resources Ltd. (LGO:TSX.V)?
ST: We have a small position. We like CEO Mark Brennan, Largo and vanadium. It had to do a bit of a dilutive financing to get its mine under construction. We may invest more in that name at some point, but we’re largely on the sidelines at the moment.
TGR: Do you have any final thoughts on the space for investors?
ST: My biggest worry for a lot of these development-stage companies is governmental risk. Governments and jurisdictions around the world may get greedy when faced with the pressure to restructure their financial obligations and debt. They may attempt to take a bigger piece of the pie. That’s a risk that’s always been part of the mining business, but investors should be particularly attuned to that over the next two to three years.
Stephen Taylor is chairman and CEO of Taylor Asset Management, a Chicago-based investment management firm focusing on small-cap domestic equities and emerging markets. He also serves as a portfolio manager for the Taylor International Fund Ltd., a small-cap equity fund. In addition to emerging markets, Taylor’s area of expertise includes private equity, restructuring and turnaround situations and both small- and mid-cap companies. He has considerable experience in the natural resources and finance industries in Canada and China.
Want to read more exclusive Gold Report interviews like this? Sign up for our free e-newsletter, and you’ll learn when new articles have been published. To see a list of recent interviews with industry analysts and commentators, visit our Exclusive Interviews page.

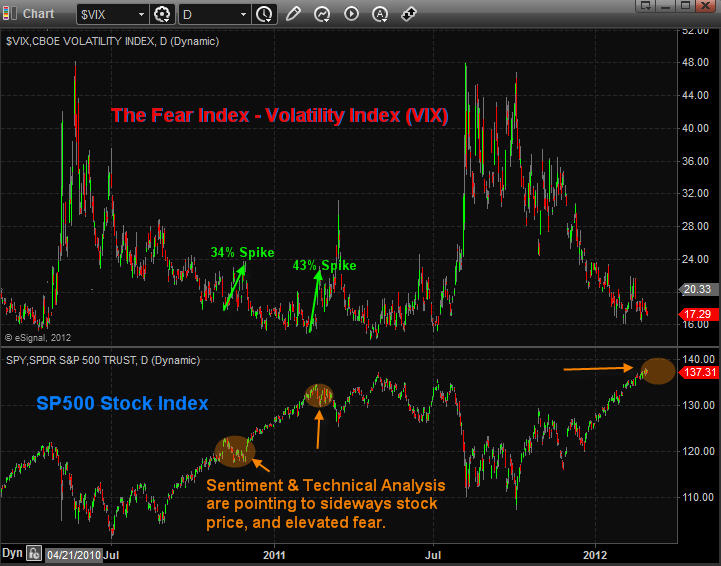
Over the past 5 months we have seen volatility steadily decline as stocks and commodities rise in value. The 65% drop in the volatility index is now trading at a level which has triggered many selloffs in the stock market over the years as investors become more and more comfortable and greedy with rising stock prices.
Looking at the market from a HERD mentality and seeing everyone run to buy more stocks for their portfolio has me on edge. We could see a strong wave of fear/selling hit the S&P 500 Index over the next two weeks catching the masses with their hand in the cookie jar . . . again.
If you don’t know what the volatility index (VIX) is, then think of it as the fear index. It tells us how fearful/uncertain investors are or how complacent they are with rising stock prices. Additionally a rising VIX also demonstrates how certain the herd is that higher prices should continue.
The chart below shows this fear index on top with the SP500 index below and the correlation between the two underlying assets. Just remember the phrase “When the VIX is low it’s time to GO, When the VIX is high it’s time to BUY”.
Additionally the Volatility Index prices in fear for the next 30 days so do not be looking at this for big picture analysis. Fear happens very quickly and turns on a dime so it should only be used for short term trading, generally 3-15 days.
Volatility Index and SP500 Correlation & Forecast Daily Chart:
Global Issues Continue To Grow But What Will Spark Global Fear?
Everyone has to admit the stock market has been on fire since the October lows of last year with the S&P 500 Index trading up over 26%. It has been a great run, but is it about to end? Where should investors focus on putting their money? Dividend stocks, bonds, gold, or just sit in cash for the time being??
I may be able to help you figure that out.
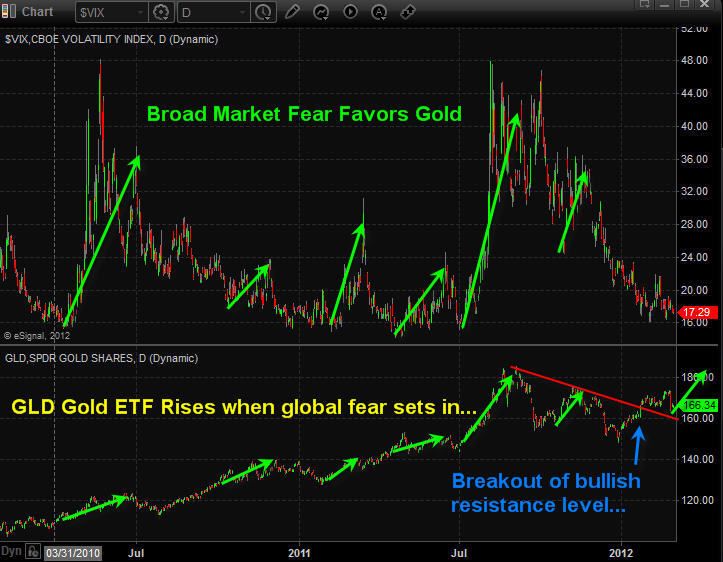
Below is a chart of the Volatility index and the gold exchange traded fund which tracks the price of gold bullion. Notice how when fear is just starting to ramp up gold tends to be a neutral or a little weak but not long after investors start selling their shares of securities we see money flow into the shiny yellow safe haven.
Gold & Fear Go Hand-In-Hand: Daily Chart
Looking at the relationship between investor fear/uncertainty and gold you will notice scared money has a tendency to move out of stocks and into safe havens.
Trading Conclusion Looking Forward 3 months…
In short, I feel the financial markets overall (stocks, commodities, and currencies) are going to start seeing a rise in volatility meaning larger daily swings which inherently increased overall downside risk to portfolios and all open positions.
To give you a really basic example of how risk increases, look at the daily potential risk the SP500 can have during different VIX price levels:
Volatility index under 20.00 Low Risk: Expect up to 1% price gaps at 9:30am ET, and up to 5% corrections from a previous high.
Volatility index between 20 – 30 Medium Risk: Expect up to 2% price gaps at 9:30am ET, and up to 15% corrections from recent market tops or bottoms.
Volatility index over 30 High Risk: Expect 3+% price gaps at 9:30am ET, and possibly another 5-15% correction from the previous VIX reading at Medium Risk
Note on price gaps: If you don’t know what I am talking about a price gap is simply the difference between the previous day’s close at 4:00pm ET and the opening price at 9:30am ET.
To continue on my market outlook, I feel the stock market will trade sideways or possibly grind higher for the next 1-2 weeks, during this time volatility should trade flat or slightly higher because it is already trading at a historically low level. It is just a matter of time before some bad news hits the market or sellers start to apply pressure and either of these will send the fear index higher.
I hope you found this info useful and if you would like to get these reports free every week delivered to your inbox be sure to join my FREE NEWSLETTER HERE: www.GoldAndOilGuy.com
Chris Vermeulen

Today billionaire Eric Sprott told King World News that a staggering 500 million ounces of paper silver traded hands during the takedown in the metals this week. Eric Sprott, Chairman of Sprott Asset Management, had this to say about what took place the day of the plunge in gold and silver: “I can only imagine it’s the same forces that for the last twelve years have been at work in the gold market, trying to keep the volatility very large on the downside. As you are aware, we hardly ever get days when you get an intraday $100 rise in gold. When we look back at what happened (on Wednesday) we saw huge sell orders in gold and silver.”
Eric Sprott continues:
“When I look at the silver market in particular, in a 30 minute span we had sellers of 225 million equivalent paper ounces, in a market that in one year the silver miners only produce 800 million ounces. So again, it’s the paper markets overwhelming the physical market. It’s stunning to me that on a day like Feb. 29th we traded 500 million ounces of silver.
No rational person could believe it had anything to do with the real market for silver….
Continue reading the Eric Sprott interview (scroll down) HERE
Downside risk in equity markets and most sectors exceed short term upside potential. Short term weakness will provide an opportunity to enter into seasonal plays this spring including Energy, Mines and Metals, Chemicals and the Auto sector. Energy already is showing encouraging signs of seasonal strength.
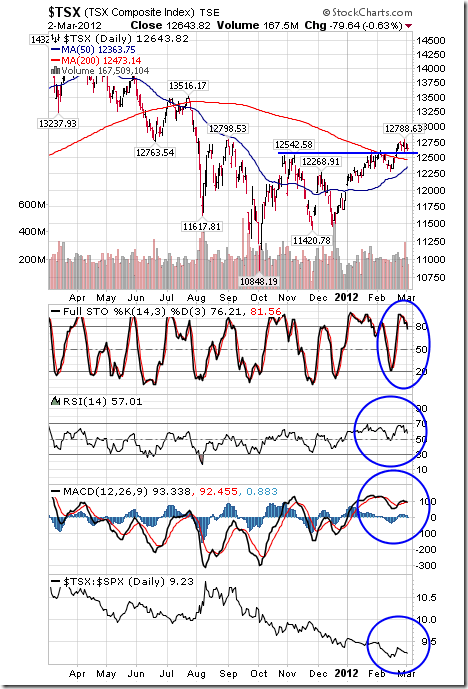
The TSX Composite Index slipped 81.95 points (0.64%) last week. Intermediate trend is up. Support is at 11,420.78. The Index remains above its 50 and 200 day moving averages. Short term momentum indicators are overbought. Strength relative to the S&P 500 Index remains slightly positive.
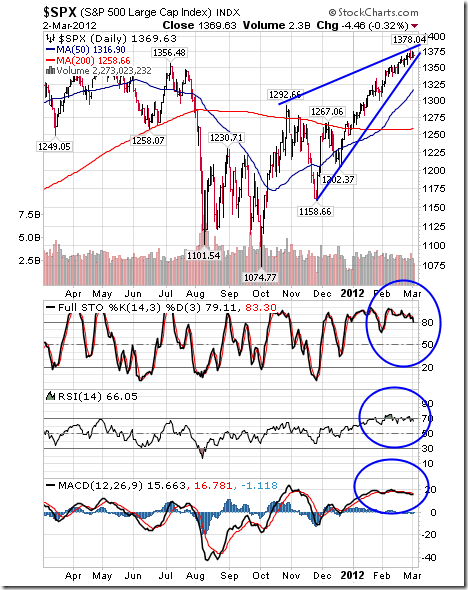
The S&P 500 Index added 3.89 points (0.28%) last week. Intermediate trend is up. The Index remains within a rising wedge pattern and well above its 50 and 200 day moving averages. Short term momentum indicators are overbought and showing signs of rolling over. However, short term momentum indicators are not significant as long as the Index remains in the rising wedge pattern.
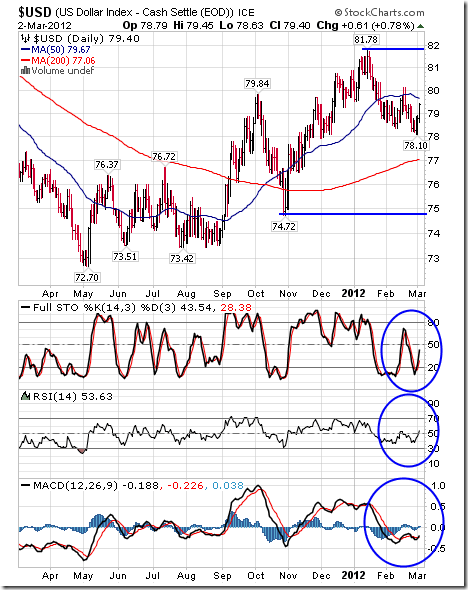
The U.S. Dollar added 1.18 last week. Intermediate trend remains up. Short term momentum indicators are recovering from oversold levels.
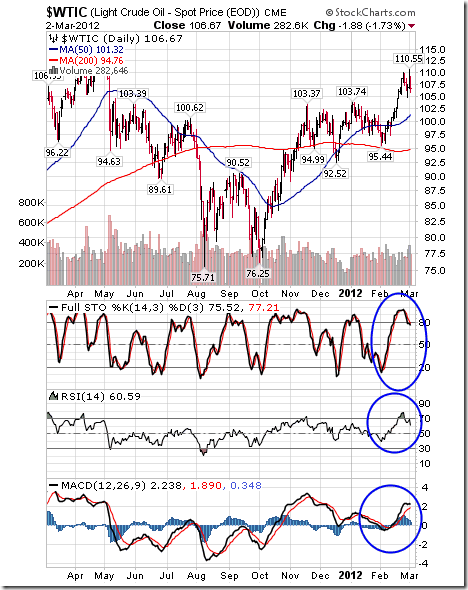
Crude oil slipped $2.78 per barrel (2.54%) last week (including a spike on Thursday to $110.55). Intermediate trend is up. Short term momentum indicators are overbought and showing early signs of rolling over. ‘Tis the season for crude oil prices to move higher!
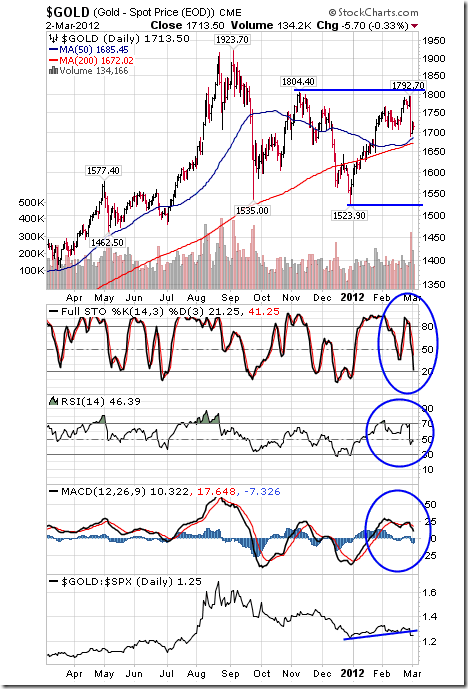
Gold plunged $62.30 per ounce (3.51%) including a Leibovit volume reversal on Thursday. Support is at 1,523.90 and resistance is at 1,804.40. Short term momentum indicators have rolled over from an overbought level. Strength relative to the S&P 500 Index no longer is positive.
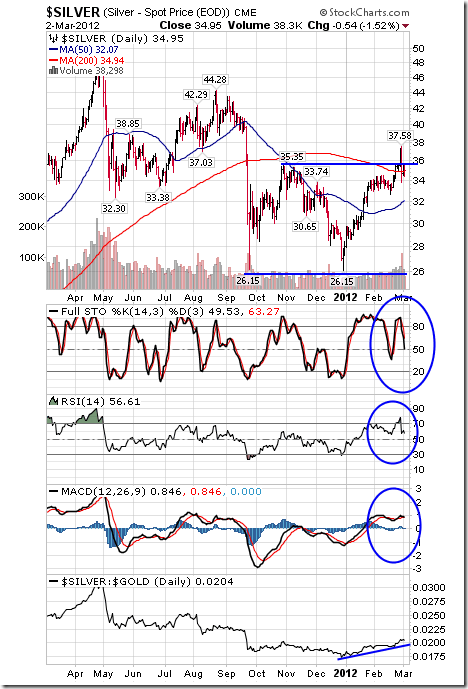
Silver dropped $0.48 per ounce (1.35%) last week. Intermediate trend remains up despite a Leibovit negative volume reversal on Thursday. Silver remains above its 50 and 200 day moving averages. Short term momentum indicators have rolled over from overbought levels. Strength relative to gold remains positive. Seasonal influences remain positive.
….view 45 more Charts and Analysis HERE

The recent selloff is just one of the many shakeouts that somehow manages to occur when precious metals are about to take off. For weeks we have stated that we were on the verge of a breakout at $35 in silver, $4 copper and $1800 gold. Coincidence??? Gold Stock Trades thinks not.
In 2012, we have recently witnessed a dramatic 18% move in gold from $1525 to approximately $1800 gold and silver has made an impressive 30% move from $27.5 to $37.50 since the beginning of the year. It is characteristic in gold and silver to witness short term volatile pullbacks at the beginning of major moves to shakeout the short term speculators looking for overnight riches and who lack patience and fortitude.
…..read more HERE


-
I know Mike is a very solid investor and respect his opinions very much. So if he says pay attention to this or that - I will.
~ Dale G.
-
I've started managing my own investments so view Michael's site as a one-stop shop from which to get information and perspectives.
~ Dave E.
-
Michael offers easy reading, honest, common sense information that anyone can use in a practical manner.
~ der_al.
-
A sane voice in a scrambled investment world.
~ Ed R.
Inside Edge Pro Contributors

Greg Weldon

Josef Schachter

Tyler Bollhorn

Ryan Irvine

Paul Beattie

Martin Straith

Patrick Ceresna

Mark Leibovit

James Thorne

Victor Adair