
Timing & trends
Todd Market Forecast for Tuesday March 13, 2012
The stock market was higher by a little over 100 Dow points when late in the day, JP Morgan raised its dividend and announced a massive $15 billion stock buyback. There is now anticipation that other banks will follow suit.
There seemed to be little reason for the earlier rally. Yes, retail sales were perceived as being good, but a lot of that increase was at gasoline stations. The Federal Reserve FOMC meeting and announcement was also basically a non event.
One has to ask, was there sufficient leakage of the JP Morgan announcement to tip the scales toward the upside prior to the announcement.
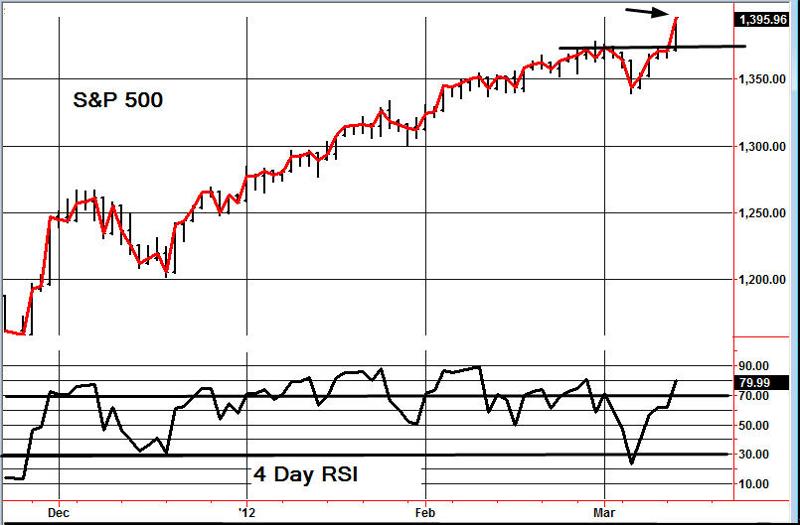
Regardless of the reason, the major indices broke out above the resistance zone that we showed in yesterday’s update and this is a bullish occurrence.
Available Mon- Friday after 6:00 P.M. Eastern, 3:00 Pacific.
DOW + 218 on 1550 net advances
NASDAQ COMP + 56 on 1250 net advances
SHORT TERM TREND Bullish (change)
INTERMEDIATE TERM TREND Bullish
TORONTO EXCHANGE: Toronto gained all that it lost yesterday and then some. We’ll be changing our evaluation.

STOCK MARKET SUMMARY upated after today’s close + a Gold Comment immediately below saying…. “one of the best gold market timers around, is Mark Leibovit”
Mark Says “Time is running out for the current (stock rally), but the intermediate trend for 2012 is still bullish”
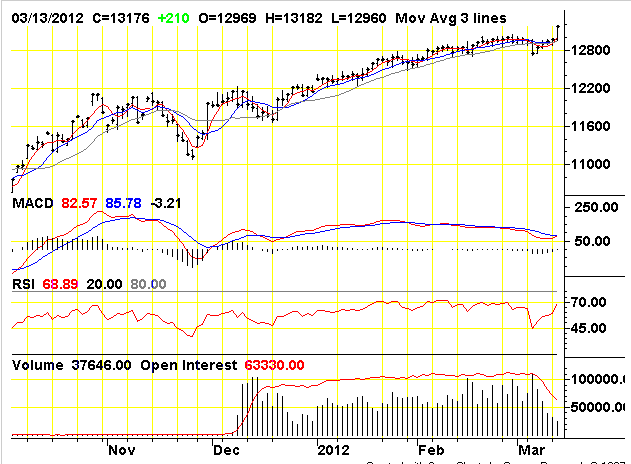
Equities exploded higher yet again today as the news seems to be all good. For the session the Dow was up 217.97 at 13,177.68, the S&P 500 was up 24.86 at 1395.95, and the Nasdaq Composite was up 56.22 at 3039.88. Volume increased over Monday and breadth was strong.
Well folks, in a normal market this would smell like a top. Markets explode higher yet again after a prolonged run – and all the news is GREAT! Retail sales strong, key banks pass stress tests (did anyone expect otherwise?), unemployment is down, 200,000 new jobs were created last nonth, Europe’s problems are on their way to being solved, etc. It seems the ‘wall of worry’ that the market has been climbing is being dismantled brick by brick.
While this latest rally looks suspect from a contrarian standpoint, we must wait for price and volume to confirm any reversals that may develop. Until then, the trend is higher.
Equities opened strong and finished stronger as news of the bank stress tests were released two days early after the Fed announced no change in interest rates with inflation not being a major threat.
Financials exploded higher as the release of the bank stress tests removed an element of uncertainty and forced shorts to cover positions. Also news that JP Morgan Chase is increasing their dividend and initiating a $15 billion stock buyback program brought in a rush of buyers late in the session. JPM closed 7.03% higher at 43.39.
Better than expected retail sales got stocks off to a solid start this morning. February retail sales rose by 1.1% vs. consensus of 1.0%. Excluding autos, retail sales were up 0.9% vs. consensus of 0.6%.
The FOMC opted to leave its fed funds target rate at 0.00% to 0.25%. The statement said that economic conditions, including low rates of resource utilization and a subdued outlook for inflation, are likely to warrant exceptionally low levels for the fed funds rate at least through late 2014.
In individual stock news, Molycorp shares gained 3.2 percent to $30.82.
Shares of Urban Outfitters Inc fell 5.3 percent to $27.95 after the company said it expects margins to continue to be pressured.
———————————————
Canadian News
Canadian equities moved higher after an upbeat FOMC statement and strong U.S. retail sales.
The S&P/TSX composite index gained 109.68 points to 12,537.69 as nine of its 10 main sectors posted gains. Materials stocks sank 0.4 percent on weak gold bullion prices.
Broad market gains were led by energy company Suncor Energy which gained 2.6 percent to C$34.04, and financial company Royal Bank of Canada which gained 2.2 percent to C$58.00.
The Fed didn’t signal any change in its plan to keep interest rates low which stoked optimism about the economy. That in turn put upward pressure on oil and copper prices, which impacted energy and base-metal mining shares.
Mining stocks were strong, led by gains in Teck Resources as its shares gained nearly 3 percent to C$36.53 while First Quantum advanced 3.3 percent to C$21.13.
The dollar was stronger despite all of the hoopla in the equity market. The U.S. Dollar Index was up .243 at 80.133.
Precious metals were lower today as gold sank on liquidation as the risk trade is firmly on at this point. Spot gold was off 27.50 at 1673.30. Silver was off .18 at 33.43, platinum was off 10 at 1684, and palladium was up 1 at 701.
Copper posted strong gains on the great news throughout the session as the May contract settled .0650 higher at 3.9025.
Crude oil settled 0.37 higher at 106.71.
Good Night.
Gold Comment from Dan Dorfman of Trim Tabs Lauding Mark Leibovit’s Timing Excellence (and current caution)
TrimTabs Money Blog
Gold Bulls Fear More Grief, Maybe a $200 Dive
By Dan Dorfman
Don’t get suckered! There are times when gold can turn into fool’s gold. This could be one of those times. In other words, gold stands out as an exciting investment for the long run, but looms as a potential dog of an investment for the short run.
Those essentially are the cautionary suggestions from a couple of outspoken and generally buoyant long-time gold bulls. More specifically, they’re saying if you’re tempted to take a flier on the precious metal in the hopes of buying it on the cheap after its wicked $130-an-ounce decline over five days that sent it skidding to around $1,660, your timing could be for the birds.
Their basic view is that the recent thunderstorms in the gold market-largely a reflection of a hint from Federal Reserve chairman Ben Bernanke that further quantitative easing might not be in the cards, Greek debt fears and a firming of the greenback-may be far from over. The inference is clear, namely gold could head down again before it heads up.
Our other wary long-term gold bull, one of the best gold market timers around, is Mark Leibovit, editor of the Arizona-based Leibovit VR Gold Letter. His view: gold shares are weakening and we need a confirmation of a bottom before jumping back in. “I would step aside till the dust settles,” he says. Another current negative, he notes, is the seasonal factor, a reference to the fact that gold often tops out in February or March, remains stagnant for about 90 to 120 days and then resumes its advance in the late summer.
For the longer term, though, Leibovit, who sees a full-scale confrontation between Israel and Iran before the end of May, says gold remains on a buy signal, but he emphasizes he would only buy the volatile metal here on weakness and cautions “it’s definitely not for the faint of heart.”
Before year end, though, he sees a gold reversal, with the metal, reflecting all the well known positive fundamentals, in particular global round-the-clock money printing, climbing to $2,000 or more. Among his favorite gold plays are Canadian Mapleleaf coins, Central Fund of Canada and a Canadian exchange-traded fund backed by the Royal Canadian Mint, an ETF that trades on the Toronto Stock Exchange under the symbol MNT and enables its investors to take delivery of their physical assets.
Marks Stock Comment before today’s opening
STOCKS – ACTION ALERT – SELL (Time is running out for the current rally, but the intermediate trend for 2012 is still bullish)
Today is both ‘Turnaround Tuesday’ and FOMC day likely triggering a rally following a down day on Monday. I have unfulfilled upside targets in the S&P 500 between 1395 and 1445, but felt a shakeout back to first 1323 and possibly 1270 were doable this Spring. We may still rally into the end of the month or early April and I could be early in my SELL signal. One of the key indexes to watch is the Russell 2000 which displayed several short-term sell signals in my work in February ahead of the early March sell-off. It is now rebounding and a breakout above 833.02 (the February 6 high) especially on volume would likely be coincident with new rally highs elsewhere. We are also watching the key Dow Transports which also topped out in early February at 5384.15, now 5144.28. New market highs, however, does not negate the chances of still seeing a sharp correction in the Spring, but this time coming from higher ground rather than current levels.
 The Dow Daily below:
Tse Daily Chart 3/13/12

VRTRADER.COM Trial Signup:
THE RENEWAL OF YOUR SUBSCRIPTION IS AUTOMATIC. YOUR CREDIT CARD WILL CONTINUE TO BE BILLED UNLESS YOU NOTIFY VRtrader.com SEVEN DAYS PRIOR TO SUBSCRIPTION EXPIRATION EITHER VIA EMAIL POSTING THE WORD ‘UNSUBSCRIBE’ IN THE SUBJECT BOX OR TELEPHONE US AT (928) 282-1275 OF CANCELLATION. NO REFUNDS ARE AVAILABLE ON SILVER, PLATINUM OR VR FORECASTER (ANNUAL FORECAST MODEL) SUBSCRIPTIONS.
Welcome and congratulations on choosing VRTrader.com as a source for your stock market commentary, information and analysis for the U.S. Stock Market. Needless to say we are very happy that you are joining us for AT LEAST the next 30 days days and look forward to providing you rewarding and inciteful information that will help you toward your goal of succeeding in the markets.
Here is the Special Trial Offer: Use this month to kick our tires. Pay 50% for the first 30 days (No refund) and sample our Silver or Platinum service and then decide what works best for you. If you aren’t 100% ready to move forward, simply email us to cancel one week before your 30 day 50% off trial subscription ends and it will be canceled and you will not be charged ANY FURTHER, no questions asked. Just send an email to mark.vrtrader@gmail.com” data-mce-href=”mailto:mark.vrtrader@gmail.com” data-mce-href=”mailto:mark.vrtrader@gmail.com“>mark.vrtrader@gmail.com“>mark.vrtrader@gmail.com” data-mce-href=”mailto:mark.vrtrader@gmail.com“>mark.vrtrader@gmail.com or call 928-282-1275 to cancel. You will receive an emailed confirmation of your cancellation at that time.
The 30 day trial is allowed one time only. By taking this 30 day 50% trial, you agree to be charged the full cost of the monthly Silver or Platinum service (choose one only) at the end of the 30 day trial subscription period, unless you cancel first. The regular Silver monthly rate is $49.40 and the Silver quarterly rate is $133.50. The regular Platinum monthly rate is $129.95 and the Platinum quarterly rate is $350.85. The special trial 50% off trial rates are listed below. Sign up today!
There are no refunds or pro-rata refunds offered at VRTrader.com for any subscription. You are being offered a 50% discount for trying our service for the first 30 days only!

With continued volatility in the gold and silver markets, today King World News reached out to 40 year veteran John Hathaway. Hathaway is the prolific manager of the Tocqueville Gold Fund and he has achieved a 5-star rating from Morningstar. Hathaway sent KWN, exclusively, an outline of 9 key points in the gold and silver markets. Here is a portion of one of the 9 key points (all 9 points below): “The fact that gold has survived the negative news flow from the monetary and economic front is encouraging. If gold can withstand the apparently changing narrative that had underpinned a bullish stance on gold, it will be a sign of enormous strength.”
This past week I read another excellent article by Jeremy Grantham which included several “tips” for retail investors…the tip that really got my attention was, “Stock market opinions must be read with a careful understanding of the time period being used.” His article reminded me how important it is for me to trade the same time horizon as my analysis….because if I’m not properly connecting the time frame of my analysis to the time frame of my trading….and vice versa….I’m going to be losing money. In fact, I think any time I’ve “struggled” with trading it’s because my short term trading strategies have been based upon longer term analysis.


Canadian farmland continues to receive favorable attention from alternative investors. We believe it stems from some unique and increasingly sought after characteristics – low volatility, low correlations to traditional asset classes, high correlation to inflation, superior risk adjusted returns, linkage to emerging market growth with limited political risk, reliable cash-flow generation, if structured correctly, minimal counter-party risk and, in Saskatchewan in particular, a margin of safety.


-
I know Mike is a very solid investor and respect his opinions very much. So if he says pay attention to this or that - I will.
~ Dale G.
-
I've started managing my own investments so view Michael's site as a one-stop shop from which to get information and perspectives.
~ Dave E.
-
Michael offers easy reading, honest, common sense information that anyone can use in a practical manner.
~ der_al.
-
A sane voice in a scrambled investment world.
~ Ed R.
Inside Edge Pro Contributors

Greg Weldon

Josef Schachter

Tyler Bollhorn

Ryan Irvine

Paul Beattie

Martin Straith

Patrick Ceresna

Mark Leibovit

James Thorne

Victor Adair