
Energy & Commodities
We take a look at the latest developments in the oil market, including charts of all the major inventory categories.
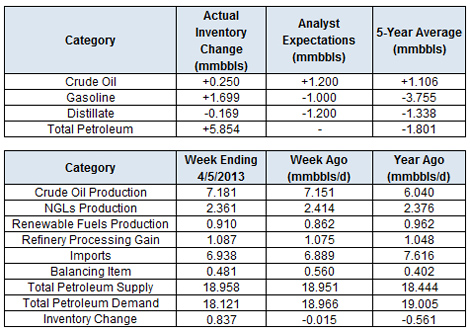
The Department of Energy reported this morning that in the week ending April 5, U.S. crude oil inventories increased by 0.3 million barrels, gasoline inventories increased by 1.7 million barrels, distillate inventories decreased by 0.2 million barrels and total petroleum inventories increased by 5.9 million barrels.
Oil prices were lower after the release of the latest inventory figures. Crude continues to underperform stock markets, which hit fresh record highs in today’s session. Brent remains in a downtrend, and we see prices testing the psychologically significant support level at $100 in the coming weeks.
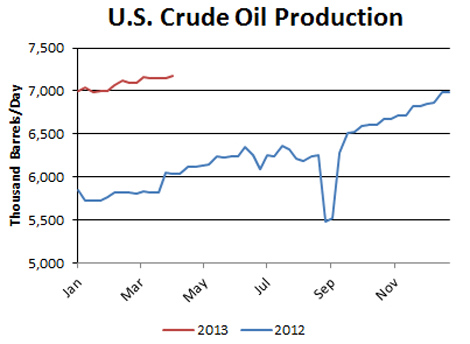
In our view, the surge in U.S. production has played a major role in dampening oil prices. U.S. output hit a fresh 21-year high last week at 7.18 million barrels per day, up 1.26 mmbbl/d, or 22 percent from a year ago.
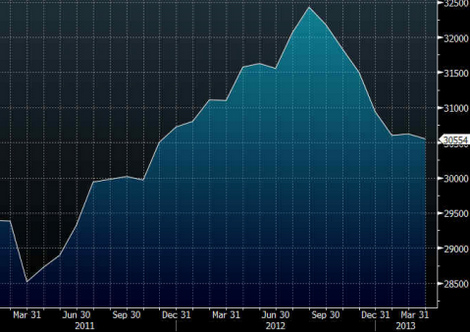
In turn, OPEC has had to cut back its output to keep the market in balance. The cartel’s output fell to 30.55 mmbbl/d in March, the lowest level since November 2011 and nearly 2 million barrels per day below the most recent peak set in August 2012. The reduction in OPEC’s output—and consequent increase in OPEC’s spare capacity—has created a buffer against supply disruptions. Oil prices typically perform poorly during periods of high OPEC spare capacity.
OPEC Crude Production
BRENT
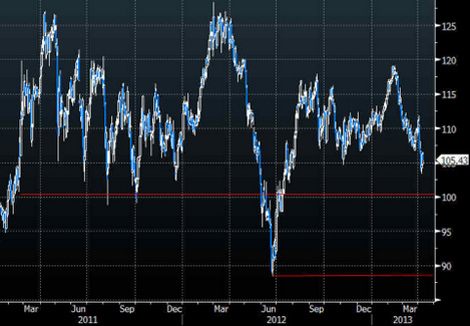
WTI
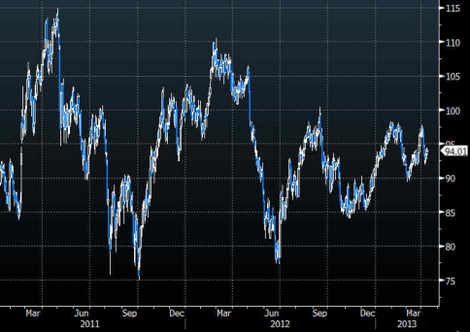
Bottom Line: The correction in oil prices may continue as Brent falls to $100. A break below that level exposes much lower levels near $87. WTI is set to continue its outperformance, but may decline if Brent falls significantly from here.
…..read more HERE

Those who understand its ‘post-capitalist’ rules will prosper
 In 1993, management guru Peter Drucker published a short book entitled Post-Capitalist Society. Despite the fact that the Internet was still in its pre-browser infancy, Drucker identified that developed-world economies were entering a new knowledge-based era– as opposed to the preceding industrial-based era, which represented just as big a leap from the agrarian-based one it had superseded.
Drucker used the term post-capitalist not to suggest the emergence of a new “ism” beyond the free market, but to describe a new economic order that was no longer defined by the adversarial classes of labor and the owners of capital. Now that knowledge has trumped financial capital and labor alike, the new classes are knowledge workers and service workers.
As for the role of capital, Drucker wryly points out that by Marx’s definition of socialist paradise – that the workers owned the means of production (in the 19th century, that meant mines, factories and tools) – America is a workers’ paradise, because a significant percentage of stocks and bonds were owned by pension funds indirectly owned by the workers.
In the two decades since 1993, privately owned and managed 401K retirement funds have added to the pool of worker-owned financial capital.
Drucker’s main point is that the role of finance and capital is not the same in a knowledge economy as it was in a capital-intensive industrial economy that needed massive sums of bank credit to expand production.
How much bank financing did Apple, Oracle, Microsoft, or Google require to expand? Investment banks reaped huge profits in taking these fast-growing knowledge companies public, but these tech companies’ need for financial capital was met with relatively modest venture-capital investments raised from pools of individuals.
That the dominant knowledge-based corporations had little need for bank capital illustrates the diminished role for finance capital in a knowledge economy. (This also explains the explosive rise in the 1990s and 2000s of financialization; i.e., excessive debt, risk, leverage, and moral hazard. Commercial and investment banks needed new profit sources to exploit, as traditional commercial lending was no longer profitable enough.)
In a knowledge economy, the primary asset – knowledge – is “owned” by the worker and cannot be taken from him/her. Knowledge is a form of mobile human capital.
In Drucker’s view, knowledge, not industry or finance, is now the dominant basis of wealth creation, and this transformation requires new social structures. The old industrial-era worldview of “labor versus capital” no longer describes the key social relations or realities of the knowledge economy.
The transition from the industrial economy to the knowledge economy is the modern-day equivalent of the Industrial Revolution, which transformed an agrarian social order to an industrial one of factories, workers, and large-scale concentrations of capital and wealth. These major transitions are disruptive and unpredictable, as the existing social and financial orders are replaced by new, rapidly evolving arrangements. As Drucker put it, the person coming of age at the end of the transitional period cannot imagine the life led by his/her grandparents– the dominant social organizations that everyone previously took for granted have changed.
Following in the footsteps of historian Fernand Braudel, Drucker identifies four key transitions in the global economy: in the 1300s, from a feudal, agrarian economy to modern capitalism and the nation-state; in the late 1700s and 1800s, the Industrial Revolution of steam power and factories; in the 20th century, a Productivity Revolution as management of work and processes boosted the productivity of labor, transforming the proletariat class into the middle class; and since the 1990s, the emergence of the Knowledge Economy.
In Drucker’s analysis, these fast-spreading economic revolutions trigger equally profound political and social dynamics. The dominant social structures that we take for granted – labor and capital, and the nation-state – are not immutable; rather, they are the modern-day equivalent of the late-1200s feudal society that seemed permanent to those who had known nothing else but that was already being dismantled and replaced by the Renaissance-era development of modern capitalism.
From this perspective, the nation-state is no longer indispensable to the knowledge economy, and as a result, Drucker foresaw the emergence of new social structures would arise and co-exist with the nation-state.
Drucker summed up the difference between what many term a post-industrial economy and what he calls a knowledge economy this way: “That knowledge has become the resource rather than a resource is what makes our society ‘post-capitalist.’ This fact changes – fundamentally – the structure of society. The means of production is and will be knowledge.”
Knowledge and Management
As we might expect from an author who spent his career studying management, Drucker sees the Management Revolution that began around 1950 as a key dynamic in the knowledge economy. The lessons in management learned from the unprecedented expansion of U.S. production in World War II were codified and applied to post-war industry, most famously in Japan.
This is the third phase of knowledge being applied to production. In the Industrial Revolution, knowledge was applied to tools and products. In the second phase, knowledge was applied to work flow and processes, enabling the Productivity Revolution that greatly boosted workers’ productivity and wages. The third phase is the application of knowledge to knowledge itself, or what Drucker terms the Management Revolution, which has seen the emergence and dominance of a professional managerial class, not just in the private sector but in the non-profit and government sectors.
The nature of knowledge has changed, in Drucker’s analysis, from a luxury that afforded the Elite opportunities for self-development, to applied knowledge. In the present era, the conventional liberal-arts university education produces generalists; i.e., a class of educated people. In terms of generating results in the world outside the person, knowledge must be effectively organized into specialized disciplines that incorporate methodologies that can be taught and applied across a spectrum of people and tasks.
Drucker characterizes this as the movement from knowledge (generalized) to knowledges (applied, specialized). Organizations can then focus this methodical knowledge on accomplishing a specific, defined task or mission.
Though it may seem incredulous to us, Drucker observes that the current meaning of “organization” was not listed in the authoritative Oxford dictionary of 1950. While social groups and organizations have existed for as long as humanity itself, Drucker distinguishes between the traditional “conserving institutions” of family, community, and society, and the destabilizing post-capitalist “society of organizations” that is adapted for constant change.
Organizations require management, and in the knowledge economy, that means managing change and helping the organization learn how to innovate. Innovation can no longer be left to chance; it must be organized as a systematic process.
Without a systematic process of constant innovation, organizations will become obsolete.
Drucker takes this process of innovation one step further and concludes that this requires decentralization, as this is the only means to reach decisions quickly based on performance, and proximity to markets, technology, and the environment.
Though he doesn’t state it directly, this means that the highly centralized sectors of the economy, from finance to government, will be disrupted by a rapidly evolving, decentralized “society of organizations.”
What Work Will Be In Demand (and What Won’t) in the Future?
So if this is the nature of the new economy, what type of worker will be most in demand?
Will your current industry, job, or skill set be as relevant? Are there steps you can start taking now to defend or increase your future market value?
In Part II: Positioning Yourself to Prosper in the Post-Capitalist Economy, we examine what impact these transformational forces will have on us as individuals, households, and communities, and how we can best prepare for the fast-evolving knowledge economy.
The global economy has only experienced three major transformations in the past 1,000 years, and arguably, we are living through the fourth. Those who understand the nature of this transition and position themselves intelligently will be disproportionately better off – a topic covered fully in my earlier report on The Future of Work.
Click here to read Part II of this report (free executive summary; enrollment required for full access).

US stocks are still going up. Gold is still dillydallying.
Gold is waiting to see what happens. Japan and the US are pumping up the monetary base – fast. But collectively, their balance sheets actually contracted by $415 billion in the first quarter – led by a $370 billion decline in the ECB’s balance sheet.
Result: slightly less paper money in the developed economies… and a slightly lower gold price. Seems logical. Seems sensible.
You see, since the start of the secular bull market in gold, there has been a nearly perfect correlation between the gold price and the rate of balance sheet expansion (akamoney printing) at the Fed, the ECB, the Bank of England and the Bank of Japan.
You can see clearly it in this chart courtesy of our friends at the Sprott Group.

According to Sprott, for every extra $1 trillion in collective balance sheet expansion by these central banks, gold has risen $210 per ounce.
Gold is the world’s alternative money. It and bitcoins. New supply of paper money is expanding rapidly. New supplies of gold and bitcoins are much more stable.
But many mainstream pundits are sure the end of the secular bull market in gold is at hand.
Who knows? Maybe they’re right.
But it seems more likely that when the Japanese get their presses running hot, the price of gold will resume its upward climb.
Like the Fed in the 1970s, central banks in the high-debt, low-growth developed economies have decided that inflation is the solution to low growth and high unemployment.
Unless something happens to stop them, they’ll probably keep increasing the money supply. And the price of gold will continue to correlate to the rate of increase in the monetary base of the developed world’s major central banks.
Doing the Damnedest Things
But we’re still laughing at the Japanese… and at Ben Bernanke… and at economists and central bankers everywhere.
And at ourselves! We all do the damnedest things.
Remember the dot-com bubble? People thought they could rich by buying companies with no earnings… no assets… and no business plan that had ever been tested. They invested hundreds of billions of dollars in these companies.
And when we pointed out to them at the time in our Daily Reckoning e-letter that the whole thing was loony, they said we “didn’t get it.”
As it turned out, we were happy not to get it.
And remember the US housing bubble? People thought they could get rich by buying houses. They thought that some magic force was making houses more and more valuable… and that all they had to do was to buy the biggest, most expensive house they could afford and “flip” it for a outsized profit.
Again, we didn’t get it. How could an inanimate object that needed constant maintenance and attention increase your wealth? Houses were consumer items, not capital investments.
And again, it turned out that not getting it was a big advantage.
So you’re probably wondering… what is it that we don’t get now?
We’ll tell you. We don’t get how printing money can make people wealthier. It never did in the past. Instead, it just led to higher inflation, bankruptcies, riots, revolutions… and disappointment.
Not that we have a closed mind about it. If someone could explain how printing up pieces of paper makes us more prosperous, we’d be all for it.
We’d want more of it. Heck, if one or two trillion new dollars or yen or euro makes you wealthier, why not print up 10 quazillion?
Wait a minute. Didn’t Argentina try that in the 1980s? Didn’t Brazil give it a whirl in the 1990s… and Zimbabwe in the 2000s?
We don’t remember any of them getting richer. Instead, they got poorer.
So what’s the magic that Ben Bernanke and the Japanese have discovered? What’s the secret?
There may be one. Anything’s possible. But what is it?
Until we get a good answer… we’re going to keep laughing.
Regards,
![]()
Bill
Remember the “Flash Crash”? Three Years Later, We’re Still Not Protected…
High-frequency trades — automatic buy and sell orders made by computers every minute — now make up over 50% of the trades on the stock market.
Yet the SEC hasn’t completely figured out how to track and regulate those trades.
It’s just now building a system to monitor the companies behind these rapid trading computers.
But guess who’s setting up the system for the government watchdog?
One of the largest high-frequency trading firms in the business.
Talk about the fox guarding the henhouse. The SEC doesn’t have a clue.
You need to protect yourself before a market catastrophe hits. This video shows you everything you need to know.

We analyze whether gold has maintained its purchasing power as widely believed.
One of the characteristics that makes gold so appealing to investors is its store of value property (read Gold & Silver Continue To Frustrate Bears As Prices Hold Key Triple-Bottom Support). The yellow metal tends to maintain its value over time, say its proponents. Some even go as far as to say that 1 ounce of gold buys the same amount of bread, as it did at any time throughout history.
Now, whether this is true is debatable, but a quick back-of-the-envelope calculation yields some interesting results. For example, one widely reported statistic is that an ounce of gold bought 350 loaves of bread during the time of King Nebuchadnezzar of Babylon, who reigned during the sixth century BC.
How many loaves of bread does an ounce of gold buy today? Well, the calculation isn’t as simple one as one would think. There are so many different types of bread and prices for bread. Nevertheless, a look at the Bureau of Labor Statistics’ consumer price index suggests that on average, a pound of bread in the U.S. costs somewhere between $1.44 to $2.04, depending on whether it’s white or whole wheat.
If we take the average of those two prices, and further assume that a loaf of bread weighs 1.5 pounds, we reach a loaf price of $2.61. Now, some—particularly those in high-cost-of-living locales—will take issue with this price. In any case, that means that an ounce of gold—last trading for $1,585—can purchase 607 loaves of bread. A loaf of bread would have to cost roughly $4.50 to reach the 350-loaf-to-1 ounce-of-gold ratio.
This result tends to support the bullish view that gold maintains its value over time. However, even conceding that, others may draw the conclusion that gold is overvalued based on the somewhat-facetious gold/loaf-of-bread ratio.
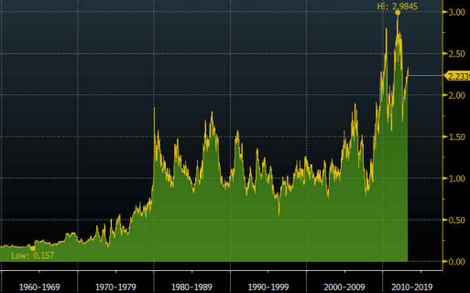
This whole discussion raises the question of how gold has performed versus other goods and gold’s relative value versus other goods. Sticking with the bread theme, the first ratio we take a look at is the gold/wheat ratio.
While we don’t have data on wheat prices going back to the 6th century BC, we have several decades of data that show gold is currently quite expensive relative to the grain. The period following 1980 is most noteworthy, in our view. Prior to 1971, gold traded at a fixed price in the U.S., and in the decade through 1980, high rates of inflation spurred the last great rally and peak in prices.
For the 25 years following 1980, the gold/wheat ratio was fairly stable, fluctuating between 90 and 150 (or alternately, 0.9 and 1.5 using a 100 bushel multiplier as the chart below does). Only recently has the gold/wheat ratio broken above that range.
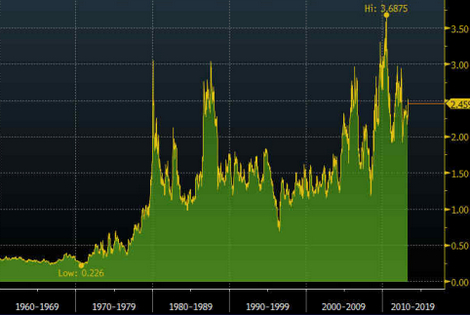
We see similar patterns in the gold/corn ratio and the gold/copper ratio. Both are near the upper ends of their respective ranges.
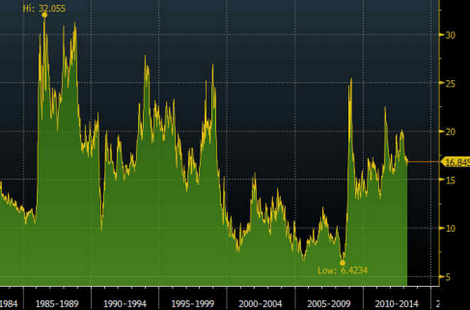
On the other hand, one ratio that paints a different picture is the gold/oil ratio. That ratio is well within its 30-year range.
Of course, there could be all sorts of reasons why any individual commodity fluctuates. Perhaps technology has pushed down the real cost of wheat, thereby depressing prices of that grain and concurrently pushing up the gold/wheat ratio.
Different people will draw different conclusions from these various ratios. But one thing is for sure: It’s hard to argue with the notion that gold tends to preserve its value over time. The evidence bears that out.
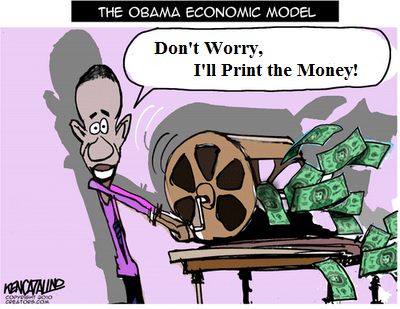 We ended almost every one of nearly 100 webinars in 2011 with “Don’t Worry, They’ll Print the Money”. This is how confident my Co-Host, Ty Andros and I were that the global central banks had no other recourse but monetization.
We felt strongly that the western economies had passed the ‘event horizon’ and that the economic spiral was now inescapable.
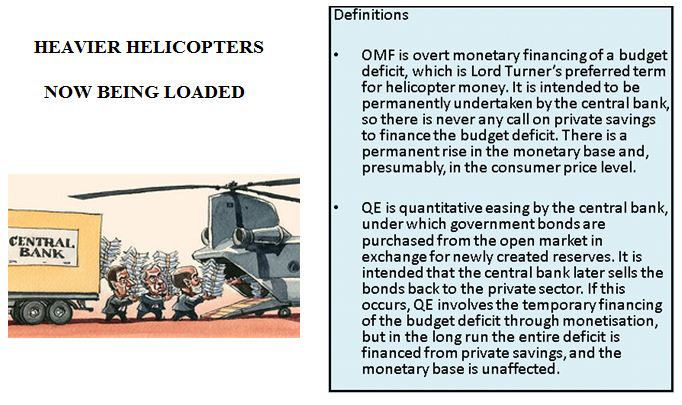
Outright Monetary Financing or OMF is what presently lies in front of us as QE¥ ends and it has profound implications for precious metals.
The charts as we will show are signaling that the smart money sees this and are already quietly laying down their bets. These players include the central banks not presently part of the Currency Cartel. The path however is going to be tricky and the charts also show why.
The global central bankers are feverishly loading the helicopters, but these are helicopters like we have never seen before.
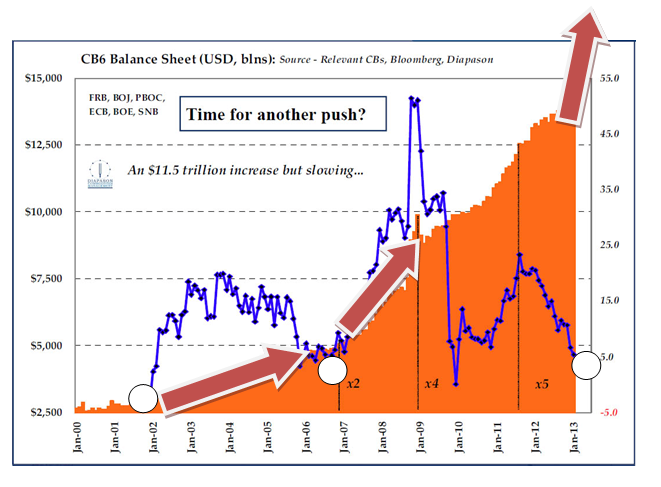
We have been carefully observing that the global central bank balance sheet expansions have exhibited the following:
- Each new increase has been significantly larger,
- Each new increase has come with diminishing intervals,
- Each increase has been more coordinated between central banks,
- Each central bank balance sheet appears to keep the total expansion within a well defined boundary condition,
- Each time the TOTALRATE OF INCREASE approaches zero (see blue line below) it soon triggers the next increase.
…..read more HERE

-
I know Mike is a very solid investor and respect his opinions very much. So if he says pay attention to this or that - I will.
~ Dale G.
-
I've started managing my own investments so view Michael's site as a one-stop shop from which to get information and perspectives.
~ Dave E.
-
Michael offers easy reading, honest, common sense information that anyone can use in a practical manner.
~ der_al.
-
A sane voice in a scrambled investment world.
~ Ed R.
Inside Edge Pro Contributors

Greg Weldon

Josef Schachter

Tyler Bollhorn

Ryan Irvine

Paul Beattie

Martin Straith

Patrick Ceresna

Mark Leibovit

James Thorne

Victor Adair