

We take a look at the latest developments in the oil market, including charts of all the major inventory categories.
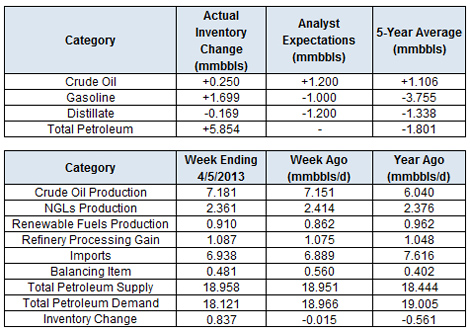
The Department of Energy reported this morning that in the week ending April 5, U.S. crude oil inventories increased by 0.3 million barrels, gasoline inventories increased by 1.7 million barrels, distillate inventories decreased by 0.2 million barrels and total petroleum inventories increased by 5.9 million barrels.
Oil prices were lower after the release of the latest inventory figures. Crude continues to underperform stock markets, which hit fresh record highs in today’s session. Brent remains in a downtrend, and we see prices testing the psychologically significant support level at $100 in the coming weeks.
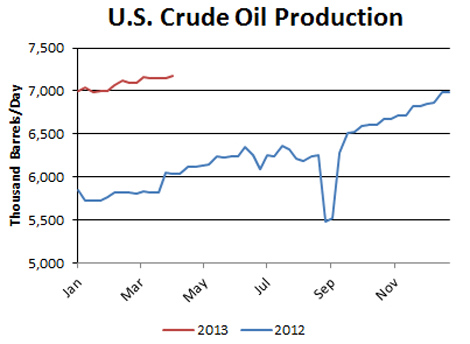
In our view, the surge in U.S. production has played a major role in dampening oil prices. U.S. output hit a fresh 21-year high last week at 7.18 million barrels per day, up 1.26 mmbbl/d, or 22 percent from a year ago.
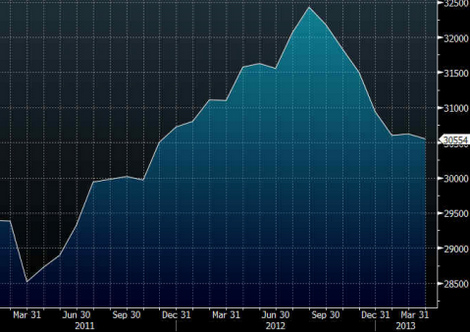
In turn, OPEC has had to cut back its output to keep the market in balance. The cartel’s output fell to 30.55 mmbbl/d in March, the lowest level since November 2011 and nearly 2 million barrels per day below the most recent peak set in August 2012. The reduction in OPEC’s output—and consequent increase in OPEC’s spare capacity—has created a buffer against supply disruptions. Oil prices typically perform poorly during periods of high OPEC spare capacity.
OPEC Crude Production
BRENT
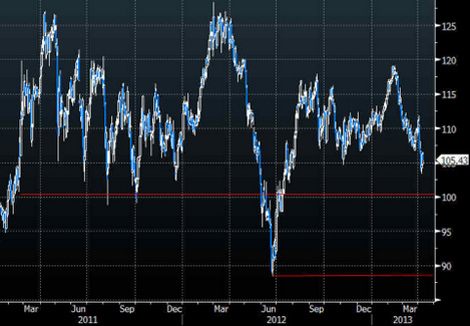
WTI
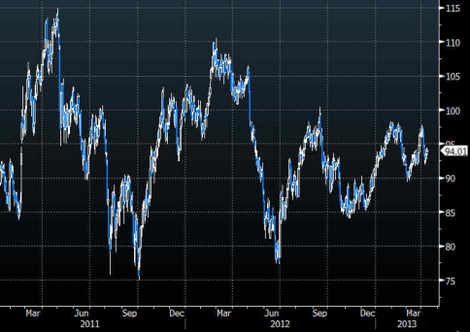
Bottom Line: The correction in oil prices may continue as Brent falls to $100. A break below that level exposes much lower levels near $87. WTI is set to continue its outperformance, but may decline if Brent falls significantly from here.
…..read more HERE


