

We analyze whether gold has maintained its purchasing power as widely believed.
One of the characteristics that makes gold so appealing to investors is its store of value property (read Gold & Silver Continue To Frustrate Bears As Prices Hold Key Triple-Bottom Support). The yellow metal tends to maintain its value over time, say its proponents. Some even go as far as to say that 1 ounce of gold buys the same amount of bread, as it did at any time throughout history.
Now, whether this is true is debatable, but a quick back-of-the-envelope calculation yields some interesting results. For example, one widely reported statistic is that an ounce of gold bought 350 loaves of bread during the time of King Nebuchadnezzar of Babylon, who reigned during the sixth century BC.
How many loaves of bread does an ounce of gold buy today? Well, the calculation isn’t as simple one as one would think. There are so many different types of bread and prices for bread. Nevertheless, a look at the Bureau of Labor Statistics’ consumer price index suggests that on average, a pound of bread in the U.S. costs somewhere between $1.44 to $2.04, depending on whether it’s white or whole wheat.
If we take the average of those two prices, and further assume that a loaf of bread weighs 1.5 pounds, we reach a loaf price of $2.61. Now, some—particularly those in high-cost-of-living locales—will take issue with this price. In any case, that means that an ounce of gold—last trading for $1,585—can purchase 607 loaves of bread. A loaf of bread would have to cost roughly $4.50 to reach the 350-loaf-to-1 ounce-of-gold ratio.
This result tends to support the bullish view that gold maintains its value over time. However, even conceding that, others may draw the conclusion that gold is overvalued based on the somewhat-facetious gold/loaf-of-bread ratio.
This whole discussion raises the question of how gold has performed versus other goods and gold’s relative value versus other goods. Sticking with the bread theme, the first ratio we take a look at is the gold/wheat ratio.
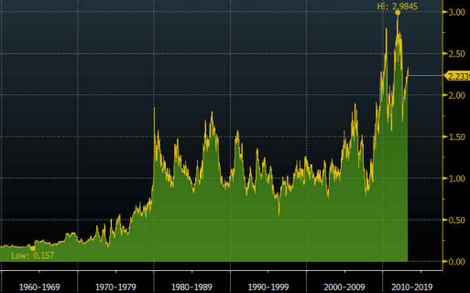
While we don’t have data on wheat prices going back to the 6th century BC, we have several decades of data that show gold is currently quite expensive relative to the grain. The period following 1980 is most noteworthy, in our view. Prior to 1971, gold traded at a fixed price in the U.S., and in the decade through 1980, high rates of inflation spurred the last great rally and peak in prices.
For the 25 years following 1980, the gold/wheat ratio was fairly stable, fluctuating between 90 and 150 (or alternately, 0.9 and 1.5 using a 100 bushel multiplier as the chart below does). Only recently has the gold/wheat ratio broken above that range.
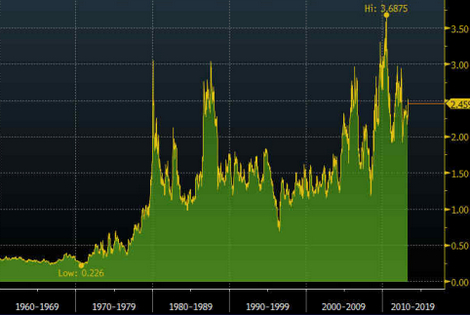
We see similar patterns in the gold/corn ratio and the gold/copper ratio. Both are near the upper ends of their respective ranges.
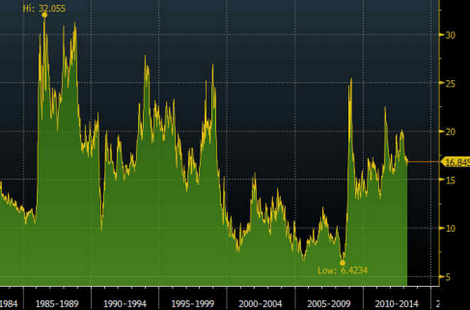
On the other hand, one ratio that paints a different picture is the gold/oil ratio. That ratio is well within its 30-year range.
Of course, there could be all sorts of reasons why any individual commodity fluctuates. Perhaps technology has pushed down the real cost of wheat, thereby depressing prices of that grain and concurrently pushing up the gold/wheat ratio.
Different people will draw different conclusions from these various ratios. But one thing is for sure: It’s hard to argue with the notion that gold tends to preserve its value over time. The evidence bears that out.


