
Gold & Precious Metals
Bull markets I have stated many times are 7, 11, 13 or 21.
Gold has three very interesting bottoms. The 1999 is the intraday low. 2000 is the lowest yearly closing. Then 2001 produces the lowest quarter closing. This is an interesting set up that is rare to say the least. So effectively, both the 11 and 13 cycles come into play since the low was not a single event. So we got the 13 year since 2012 was the highest closing but we got the intraday in 2011 as 11 up from the lowest closing. Had both the intraday and the close been unified in 1999, then the ideal would have been 2010 with a max of 2012.
Likewise, on the way down we should have had a 19 month correction but the move up to create the highest annual closing in 2012 extended the cycle. Everything happens for a reason and this may prove to be the currency crisis.
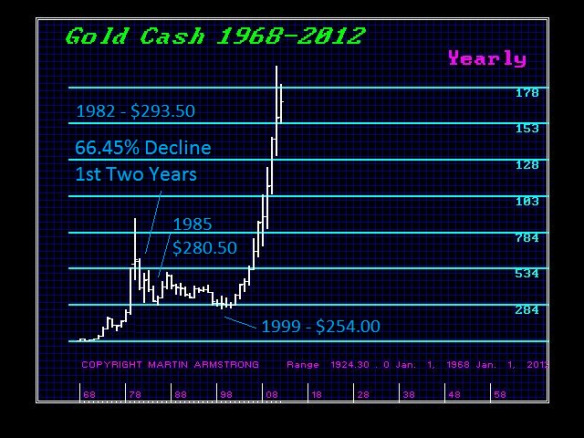
This decline will be no different than anything before. The bulk of the drop always takes place within the first 2-3 years. So just as gold crashed from $875 in 1980 to $293 by 1982, the 5 year bear market prevailed but low was $280 compared to $293. The 19 year low was only $254.
Even if gold declines into 2015, the bulk of the drop will most likely take place during this year as was the case 1980-1982. A lower low in 2015 may be marginal. That depends upon the low we see this time. If it is in the 1150 area, then the worse case should be 875-907.
We still see the phase transition for 2017 time frame and that is normally up to a 2 year event so 2015-2017 does not change anything long-term. The rest will be in the report.

Based on both recent history and mainstream economic theory the past few years should not have been possible. When you cut interest rates to near-zero, run deficits of 10% of GDP and buy up every government bond in sight with newly created currency, you get a boom, end of story. That’s just the way capitalism works.
But this time was different. After four years of QE and ZIRP and all the other easy-money acronyms, we entered the month of May with Europe in a deepening recession and the US recovery petering out.
The culprit? The one piece of the puzzle that governments can’t control: the velocity of money. This is simply a measure of how quickly holders of currency, i.e., banks, consumers, businesses, hand their currency off to someone else. The faster and more frequent the hand-offs, the more stuff gets bought and the more robustly an economy grows. But after their 2009 near-death experience, the world’s banks have been in no mood to lend. Instead, they’ve been sticking all the new currency their governments have been giving them under the proverbial mattress. This reluctance to lend means record low money velocity and little or no economic growth.

But in just the past month something fundamental has changed. US home sales and prices have accelerated, with prices returning to 2006 levels in some markets and bidding wars, flippers and interest-only mortgages once again becoming common. Stock prices pierced old records and then spiked rather than corrected. Suddenly we’re back in an asset-driven boom.
…..read it all HERE

Michael grills Josef on his 40 years of expertise on Small to Mid-Cap Oil & Gas Companies. Audio directly below:
{mp3}mtmay18josefhour1{/mp3}

Everywhere PIMCO founder and co-chief investment officer Bill Gross looks, he sees bubbles.
“Not just in the bond market,” he told Bloomberg Television in an interview earlier this week, but in the bull-run of the stock market over the past few years as well. These bubbles, of course, are being inflated by the billows of Federal Reserve bond buying. Now bogged down in its fourth discrete round of quantitative easing, the Fed has pumped so much liquidity into the economy that what once felt like a flood is now the new normal.
“As long as the Fed and Bank of Japan and other central banks keep writing checks and do not withdraw, then the bubble can be supported,” Gross said. For some context, the Federal Reserve is throwing $85 billion at the yield curve every month, or about 0.6 percent of GDP. The BoJ is spending 7.5 trillion yen ($80 billion per month), or almost 1.4 percent of GDP.
In the U.S., the conversation about paring back purchases has been going on in earnest for a number of months. This week alone, three regional Fed presidents suggested reducing purchases immediately, while one suggested that a wind-down begin in summer. At the beginning of the year, the Fed announced that it would continue with QE as long as inflation did not exceed 2 percent (currently at an annual rate of 1.8 percent), and as long as the headline unemployment rate remained above 6.5 percent (currently at 7.5 percent).
Meanwhile, Japan’s most recent stimulus initiative has just begun, and will last for at least two years.
…..read page two HERE
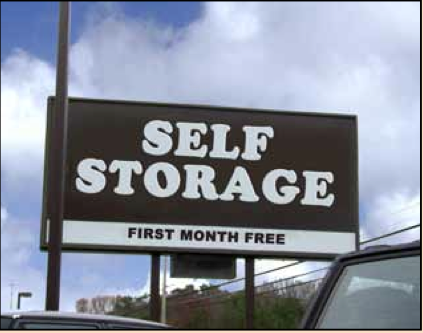 One in 10 U.S. Households rented a storage unit in 2009. That number grew from one in 17 in 1995.
Self-storage: The Poster Child for America’s Addiction to Excess. ‘
10 Tips to Stop Overspending


-
I know Mike is a very solid investor and respect his opinions very much. So if he says pay attention to this or that - I will.
~ Dale G.
-
I've started managing my own investments so view Michael's site as a one-stop shop from which to get information and perspectives.
~ Dave E.
-
Michael offers easy reading, honest, common sense information that anyone can use in a practical manner.
~ der_al.
-
A sane voice in a scrambled investment world.
~ Ed R.
Inside Edge Pro Contributors

Greg Weldon

Josef Schachter

Tyler Bollhorn

Ryan Irvine

Paul Beattie

Martin Straith

Patrick Ceresna

Mark Leibovit

James Thorne

Victor Adair