Gold & Precious Metals

Is It Time to Start Freaking Out About the Gold Supply?

You hear a lot about central banks and gold reserves these days.

Back in February, Germany decided to start repatriating some of its U.S.- and Paris-held gold. And in March, Switzerland announced plans to vote to do the same, as well as to stop selling its gold reserves.

Moves like these aren’t necessarily out-of-the-ordinary. After all, if you’re a gold buyer, it’s generally not a good idea to buy and hold it sight unseen.

But many can’t help but wonder whether Germany, Switzerland and potentially other countries doubt perhaps not the purity of the gold bars held in their name, but rather their existence.

While we expect their gold is ready for the taking, it does make you wonder why, in Germany’s case, it will take seven years for the wealth transfer to be complete.

Whatever the reasoning for the timeline, it’s a lesson to us all that the companies storing and selling your bullion should be able to produce your gold upon request.

But let’s suppose the bullion isn’t where it’s supposed to be … and the governments have to go and buy gold on the open market. Will there be enough available?

Well, there’s plenty in the ground. So that may depend on whether several miners can go forward with their plans to get it out. And unfortunately for some big gold projects, miners are finding themselves between a (gold) rock and a hard place …

Last week, Atna Resources (ATNAF) announced that low gold prices have “temporarily downsized” the ramp-up of underground mining operations at its Pinson Mine near Winnemucca, Nevada. Atna’s stock was punished mercilessly.

Pinson was expected to yield 50,000 to 57,000 gold ounces this year. Atna had hoped to increase that production to as much as 200,000 gold ounces annually.

Nope. Not gonna happen. At least, not at these prices.

But the Pinson Mine is small potatoes, right?

On Monday, Mexico’s Minera Frisco (MFRVF), owned by billionaire Carlos Slim, said that production at its gold and silver mine El Coronel was suspended due to “illegal” worker action.

El Coronel produced 42,211 ounces of gold and 4,234 ounces of silver in the first quarter of 2013, and was planning on ramping up production.

A production ramp-up? Nope, not gonna happen now.

But that’s still small potatoes, right?

On Friday, Roque Benavides, chief executive of mining company Buenaventura, talked to Reuters about Conga, the monster, $4.8 billion Peruvian gold project that is being developed by Newmont Mining (NEM). Buenaventura is junior partner on the project.

Protests flared up at Conga again last week. And these aren’t placard-holding hippies singing “Kumbaya.” People have died in clashes with security forces at the Conga project.

The project was suspended in November 2011 at the request of Peru’s central government, after increased protests in Cajamarca by anti-mining activists. Benavides says that those protests, if they continue, could mean the end of the project.

Conga could have an average annual output of 580,000 to 680,000 ounces of gold and 155 million to 235 million pounds of copper during its first five years.

Now THAT’S big potatoes.

On Monday, an Indonesian government official announced that Grasberg, an Indonesian copper mine owned by Freeport-McMoRan Copper and Gold (FCX), will not be able to resume output for three months until a probe into a deadly tunnel collapse is completed.

Grasberg is known as a copper mine — the third-largest in the world, in fact — but it’s also the BIGGEST gold-producing mine in the world, averaging more than 1 million ounces of gold production each year for the past three years.

That’s HUGE potatoes!

Should We Start to Worry
About Gold Supply Now?

The word on the street is that it’s getting tougher and tougher to buy physical gold.

Maybe that’s why people in Singapore were paying a premium of $7 per ounce for physical gold last week — a new record. And if you want to buy physical gold in Singapore in June — too bad! Orders put in now won’t be filled until July.


  • Maybe that’s why the Indian government just raised the import tariff on gold — AGAIN — on Sunday, in desperate bid to clamp down on consumer demand for the yellow metal. And this is happening during an economic slowdown! What’s going to happen when India’s economy starts firing on all cylinders again?
  • Maybe that’s why sales of physical gold are hitting “astronomical” levels in Dubai. Expat Indians are rushing to buy gold in Dubai and ship it home, perhaps in a bid to get around India’s onerous new gold-import restrictions. Dubai merchants report that their sales have shot up by 400% after the recent price plunge.
  • Maybe that’s also why sales of American Eagle gold bullion coins by the U.S. Mint — despite dropping in May from April — are still on track to set a new annual sales record.


The buyers are there. The suppliers are getting thinned out. The question of the day may soon become: “Got physical gold?”

What’s your answer going to be?

Got Gold (Miners)?

Miners look good too, of course — at least, the good ones do. That’s why I recommended two new gold miners to my Junior Resource Millionaire subscribers on Friday. Are those positions up? Yup! Are they likely to go higher? Hey, nothing’s certain in this world, but I think the odds favor this trade.

And let’s look at the Market Vectors Gold Miners ETF (GDX), a basket of leading gold miners.

060513-img-01

Despite recent bad news from Newmont and Barrick Gold (ABX), which is having its own troubles with a multibillion-dollar project, the gold miners seem to be breaking out. Maybe it’s because the gold they do own is suddenly looking a lot more valuable.

The real test will come at the 50-day moving average. Good luck to all.

If you’re doing this on your own, do your own due diligence.

All the best,
Sean

P.S.Tony Sagami has discovered a peculiar indicator that has an incredible 85% accuracy in determining whether a stock will rise or fall. That means for every 10 trades, better than eight of them can make money.

But Tony found a way to juice up his returns. Just in the last 12 months, you could have had the opportunity to make gains better than 600%… five different times!

He’s revealing the details about his secret ABR Indicator in a new breakthrough presentation. However, as with all other proprietary trading strategies, it’s important to keep it under-wraps. So, he’s not planning to leave this new video online for long.

While you still can, I urge you to //www.gliq.com/cgi-bin/click?weiss_uwd+SEAN-TAC2013-link+UWD1351+vgbb@shaw.ca+g446+5619124“>click this link here and watch it immediately.

Real Estate: 43 Year Inflation Adjusted

For some perspective on the all-important US real estate market, the chart below illustrates the inflation-adjusted median price of a single-family home in the United States over the past 43 years. Not only did housing prices increase at a rapid rate from 1991 to 2005, the rate at which housing prices increased — increased. All those gains were given back during the following 6.5 years. Over the past three months, however, the median price of a single-family home has surged by over 10% — the second biggest three-month gain on record (the data goes back to 1968). Not surprisingly, this three-month surge has resulted in new post-financial crisis highs.

20130605

The chart below shows the S&P TSX Real Estate, Gold, Energy and Financial Services Indices as well as the Bank of Canada Commodities Index (CCI) all valued in CA$. In April 2013 Gold slumped again and for the first time since November 2008 it dropped decisively below the energy and real estate indexes barely above the financials. The Bank of Canada Commodities Index has been rising on a slumping CAD/USD pair as the U.S. Dollar rally puts pressure on a lot of orthodox positions. We should note that March 2013 is when the Eurozone introduced its bank “bail-in” template for Cypriot investors. In common parlance, bank accounts are akin to a Bernie Madoff deposit scheme. Will Canadian asset prices be jacked up via Eurozone capital flight as it has with the Asian carry? It is showing up at the whale level. On the other side, one feature of a massive global post bubble deflation is debt revulsion. In Japan during their decades long contraction, savings increased as investors repaired their balance sheets. These are volatile times.


1926155 orig

 Notes:
Does the real estate rally continue? The answer may surprise you. Find out now with the exclusive & highly regarded charts of Chart of the Day Plus.

Richard Russell – Silver, Gold & A Coming Stock Market Crash

“I’ve been wrestling with a moral question.  Would it have been better to allow the bear market of 2008-09 to continue down to its ultimate and natural conclusion — or would it have been preferable to “step in” (as the Bernanke Fed did) and attempt to halt the bear market in its tracks?  Of course, we know that Ben Bernanke chose the latter course, which meant attempting to halt the bear market.

Personally, I’ve voted against the Bernanke way.  The reason is that I never thought it was possible to halt and then reverse the primary trend of the stock market or the economy — any more than I think we can halt the dawn and thus hold back the night.

One of the basic theorems of Dow Theory is that the primary trend of the market cannot be reversed.  Once a bull or bear market is under way, one way or another, it will run its course to conclusion.  The primary trend of the market and the economy is based on human sentiment — greed and fear, bear markets and bull markets end in exhaustion.  Bear markets end when the last sellers have exhausted their desire to sell.  Bull markets end when the last group of buyers have had enough.

After reading my Thursday site on megaphone formations, subscribers may now be wondering whether Friday’s action represented the start of the collapse in the Dow’s megaphone formation.  Unfortunately, I must state that there is absolutely no way of knowing.  This means that holders of stocks must make a personal decision.  Sell or take the consequences — if, indeed, the great megaphone pattern in the Dow is in the early stage of crashing.

Personally, I never wanted to be in this position.  I have already made the judgment that this market was over-bought, over-valued and over-loved.  I also noted that margin borrowing on the NYSE was near a record high — investors were borrowing heavily and greedily to increase their positions in this market.  Treasury bonds were sliding and interest rates were rising. 

Incidentally, I note that there are now five distribution days for the S&P and four for the Nasdaq.  And one churning or stalling day on Thursday.  This tells me that institutional money wants OUT of this market, which is another indication that being out of this market is the correct position.  A stalling day is a session in which the market is up only slightly on rising volume.

We’re now in June which, historically, is the worst month for stocks.  The next five months make up the “bad” six months of every year for stocks (“Sell in May and go away”).  All things considered, this is not a market I want to be in.  My preference has been to buy dividend-paying blue chip stocks at or near bear market bottoms, at which time great stocks are usually sold for whatever the bid may be (and the bids at a bear market bottom are usually “below known value”).  Conclusion — I would probably stay with this market if I owned the diamonds (DIAs), and be ready to sell if the market turns nasty.  If I was out of the market I would stay out.”

“I believe Fed chief Bernanke thought he was doing a good and patriotic deed when he stepped into the market in 2009.  Bernanke believed that the Fed made terrible mistakes during the 1930s, and that he, Bernanke, now knows better.  Bernanke even went so far as to apologize to the nation for the Fed’s mistakes during the 1930s.  Bernanke believed that he had learned from the Fed’s errors during the Great Depression, and that this time the Fed, under his (Bernanke’s) supervision would do it better.

In the coming weeks and months we will have a chance to see whether Bernanke can “do it better.”  From my standpoint, I see only two courses for the Bernanke Fed, (1) sit tight and HOPE that everything works out as originally planned, or (2) step up QE-2-infinity even further on the thesis that “if first, you don’t succeed, then try, try again.” 

Other than that I see the picture as a battle — the Bernanke Fed versus the power of the primary trend (plus perhaps the unintended consequences of attempting to halt the path of the great primary trend).”

“Gold represents wealth.  It is the staple around which everything else revolves.  Alan Greenspan agreed with this in an article he wrote in 1966. But when Greenspan was chosen as Fed chief, he turned his back on gold in favor of power and prestige and Federal Reserve notes.  

From there, his career went downhill, he’s now considered a sad joke. When Ben Bernanke was asked if gold was money, he dodged the question, and by omission he denied that gold was money.  This was the beginning of his troubles.  He was living a lie.

When you start with a dishonest premise, everything that follows will fail to work. The Constitution of the United States (Article 1 Section 10) tells us that “No State shall make any Thing but gold and silver Coin a Tender in payment of debts.”

The Federal Reserve acts on the thesis that their Federal Reserve notes can be used as tender in the payment of debts, a premise in direct opposition to the US Constitution.  I see this betrayal as the basic cause for all the troubles that we are now contending with.

The ratio of debt to Gross National Product in the US is climbing up off the charts.  This never could have happened if the gold standard was in use.  The US is like a 500 pound fat man who faces the choice of an extreme diet or a lingering death.  To actually solve our problem, Americans would have to choose an extreme decline in living standards (and deflation) while at the same time boosting their savings radically.  Americans would never submit to a drastic decline in our living standards and deflation.  The unappetizing other side of the coin is that we continue to live it up, while China buys up our nation, piece by piece.

What is the worst possible environment for investing?  The Fed has given it to us — A low interest environment along with an eroding currency.  That’s what we have now.  At present there’s no perfect or even a satisfactory investment position.  You are not safe in bonds, you are not safe in stocks, and you are not safe in cash.  Which is why I choose gold.  It doesn’t bring in income, but it will be around when everything else is in ruins.  And if the whole current house of cards starts to fall apart, chances are that there will be a huge panic to own gold, which is out of the Fed’s and the government’s grip.”

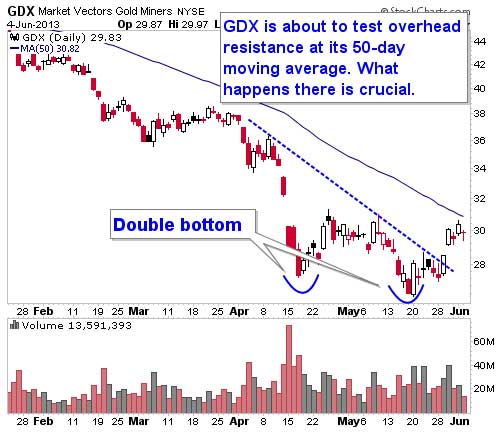
Russell’s warning for silver bears: “Everybody hates silver, and everybody wants to short it.  But keep your eye on silver.” (the chart on the day he published these extraordinary comments)

KWN RR 6-3-2013

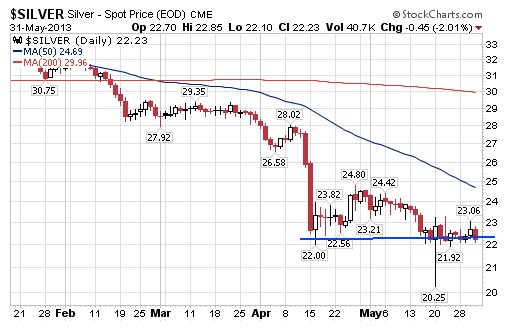
The Chart Close of business June 4th:

sc

To subscribe to Richard Russell’s Dow Theory Letters CLICK HERE. 

About Richard Russell

Russell began publishing Dow Theory Letters in 1958, and he has been writing the Letters ever since (never once having skipped a Letter). Dow Theory Letters is the oldest service continuously written by one person in the business.

Russell gained wide recognition via a series of over 30 Dow Theory and technical articles that he wrote for Barron’s during the late-’50s through the ’90s. Through Barron’s and via word of mouth, he gained a wide following. Russell was the first (in 1960) to recommend gold stocks. He called the top of the 1949-’66 bull market. And almost to the day he called the bottom of the great 1972-’74 bear market, and the beginning of the great bull market which started in December 1974.

The Letters, published every three weeks, cover the US stock market, foreign markets, bonds, precious metals, commodities, economics –plus Russell’s widely-followed comments and observations and stock market philosophy.

In 1989 Russell took over Julian Snyder’s well-known advisory service, “International Moneyline”, a service which Mr. Synder ran from Switzerland. Then, in 1998 Russell took over the Zweig Forecast from famed market analyst, Martin Zweig. Russell has written articles and been quoted in such publications as Bloomberg magazine, Barron’s, Time, Newsweek, Money Magazine, the Wall Street Journal, the New York Times, Reuters, and others. Subscribers to Dow Theory Letters number over 12,000, hailing from all 50 states and dozens of overseas counties.

A native New Yorker (born in 1924) Russell has lived through depressions and booms, through good times and bad, through war and peace. He was educated at Rutgers and received his BA at NYU. Russell flew as a combat bombardier on B-25 Mitchell Bombers with the 12th Air Force during World War II.

One of the favorite features of the Letter is Russell’s daily Primary Trend Index (PTI), which is a proprietary index which has been included in the Letters since 1971. The PTI has been an amazingly accurate and useful guide to the trend of the market, and it often actually differs with Russell’s opinions. But Russell always defers to his PTI. Says Russell, “The PTI is a lot smarter than I am. It’s a great ego-deflator, as far as I’m concerned, and I’ve learned never to fight it.”

Letters are published and mailed every three weeks. We offer a TRIAL (two consecutive up-to-date issues) for $1.00 (same price that was originally charged in 1958). Trials, please one time only. Mail your $1.00 check to: Dow Theory Letters, PO Box 1759, La Jolla, CA 92038 (annual cost of a subscription is $300, tax deductible if ordered through your business).

IMPORTANT: As an added plus for subscribers, the latest Primary Trend Index (PTI) figure for the day will be posted on our web site — posting will take place a few hours after the close of the market. Also included will be Russell’s comments and observations on the day’s action along with critical market data. Each subscriber will be issued a private user name and password for entrance to the members area of the website.

Investors Intelligence is the organization that monitors almost ALL market letters and then releases their widely-followed “percentage of bullish or bearish advisory services.” This is what Investors Intelligence says about Richard Russell’s Dow Theory Letters: “Richard Russell is by far the most interesting writer of all the services we get.” Feb. 19, 1999.

Below are two of the most widely read articles published by Dow Theory Letters over the past 40 years. Request for these pieces have been received from dozens of organizations. Click on the titles to read the articles.


Rich Man, Poor Man (The Power of Compounding)


The Perfect Business

Why Do People Fear the Hindenburg Omen?

Not a track record to be proud of:Screen shot 2013-06-04 at 10.07.37 AM

The Hindenburg Omen may be a cool sounding technical indicator, but determining its reliability is a whole other story.

Tom McClellan, whose McClellan Oscillator is among the technical indicators used to trigger a Hindenburg Omen signal, said the Omen is a great “warning,” since it successfully warned of every major declining since 1984. But as the chart shows, it’s not a great “sell” signal, since it has also flashed warnings, more often than not, especially at times when the market continued higher.

While the Omen foreshadowed significant drops in 1987 and prior to the 2008 financial crisis, it has proven to be a false alarm more often than not. Significant stock-market declines have followed the indicator just 25% of the time. For instance, the technical signal flashed in August 2010, when the Dow was trading in the low 10000s. It has since rallied more than 5000 points in less than three years.

Oppenheimer chief market technician Carter Braxton Worth believes the S&P 500 is headed for a 6-9% pullback, but not because the Hindenburg Omen says so. Worth says Hindenburg is too “mechanical” an indicator to rely on. “You become a slave to the data,” he said. “I’m not going to suspend my judgment and wait and wait until I get a reading.”

Worth has been expecting the S&P 500 to sell off to the 1535-1585 level given the “unnatural, complacent nature of the trading over the last six months.”

And McClellan is also bearish over the next several months. He expects “lots and lots of damage the rest of the summer leading to a bottom which no one will believe in September.”

If that scenario plays out, should the Hindenburg Omen be blamed for the decline? We’ll let you be the judge of that.

….morer articles from MoneyBeat:

Gold’s Glittering Dilemma

The Dow’s Ridiculous Tuesday Streak, by the Numbers

Goldman Sachs: Keep the Faith on Treasurys


US SK MKT FORESHADOWS ANOTHER RALLY – TRUE STORY!

Over the past couple week’s investors and traders have been growing increasingly bearish for the US stock market. While I too also feel this rally is getting long in the teeth there is no reason to exit long positions and start shorting.

My followers know I do not pick tops and I do not pick bottoms. This I explained in great detail in my previous report. There are more cons to that tactic and on several different levels (timing, volatility, emotions, lack of experience, addiction) than there are pro’s.

Keeping things simple, short and to the point here is my thinking for today and this week on the broad market. Remember my analysis is 100% technical based using price, volume, cycles, volatility, momentum and sentiment. I try not to let any emotions, gut feel, or bias flow into my projections. I say “TRY” because I am only human and at times when the market and emotions are flying high they still take control of me but that is few and far between.

So let’s get to the charts shall we!

SP500 INDEX TRADING DAILY CHART – SPY EXCHANGE TRADED FUND

The SP500 index continues to hold up within its rising trend channel and the recent pullback is bullish. Remember the trend is your friend and it can continue for very long periods of times ranging from days, weeks, and even months…

SP500Uptrend

The US Stock Market MUSCLE Indexes

The charts below show and explain my thinking… But in short we need these two indexes to be strong if we want to see another major leg higher in the SPY, or to at least test the recent highs.

Today the market opened slightly higher and push up in the first 30 minutes with strong volume. Overall the market looks as though it needs a day pause/pullback before taking another run higher.

Small cap stocks are the ULTIMATE Risk On play and generate ridiculous gains in very short periods of time. I focus on these with my trading partner exclusively at ActiveTradingPartners.com where we have been making a killing on trades like:NUGT up 21% in 1 dayandIOC up 11% in 2 days

 
USLeaders

Bullish Index Price, Volume & Candles

The SP500 has been very predictable the past couple weeks for both intraday trading during key reversal times in the market when price has pullback to a support zone, and also for swing trading. Last week we myself and followers bought SSO ETF when the market pulled back and we exited the next day for a 3.5% profit.

Yesterday was a perfect intraday example with the SP500 bottoming out at my 11:30am morning reversal time zone with price trading at support. Price then rallied into the close posting a 12 point gain on the SP500 futures for a simple momentum play pocketing $600.

1130

US Stock Market Mid-Week Conclusion:

In short, I still like stocks as the place to be and will not get bearish until proven wrong. Once price reverses and the technical clearly paint a bearish picture with price, volume, momentum, cycles and sentiment will I start shorting the bounces.

This week is a pivotal one for the stock market so expect increased volatility and possibly lower lows still until the counter-trend flushes the weak position out before moving higher.

If you like my simple, clean and profitable market analysis join my NEWSLETTER: www.thegoldandoilguy.com/signup.php

Chris Vermeulen


test-php-789