
Currency
Second quarter GDP figures in Japan came in well below expectations. The Japanese economy grew 2.6% in Q2 at an annualized rate, below economists’ consensus prediction for 3.6% growth. Business spending fell 0.1% year over year in the second quarter, versus forecasts for a 0.6% rise.
Japan industrial production contracted 3.1% from the previous month in June and fell 4.6% year over year, versus a 3.3% and 4.8% contraction, respectively, in May. Capacity utilization fell 2.3% in June after rising 2.3% the month before.
The Yen hit $96.04 against $96.33 prior to the data print, MarketWatch’s Michael Kitchen says.
The Nikkei is also off -1.26%.
Seasonally-adjusted GDP climbed +0.6% against Q1’s +0.9%.
As we recently explained, Japanese economic data has been doing a lot of missing expectations lately. Industrial production, household spending and July PMI all fell short.
Plus, July employment fell for the first time in three months.
Abe-nomics — the loose monetary policy ordered by Prime Minister Shinzo Abe to reinflate Japan’s economy — have now been in place about half a year.

There was a nice move in both gold and silver overnight and the rally continued as the metals opened for the week in New York.
One trader explains the bullish move was brought on by backwardation in the futures market (when the spot market trades higher than the nearest futures price). This can be explained by a demand for physical gold or immediate delivery, and thus, as well explains higher wait times for manufactured product.
Click here to view a clip from Bloomberg TV.

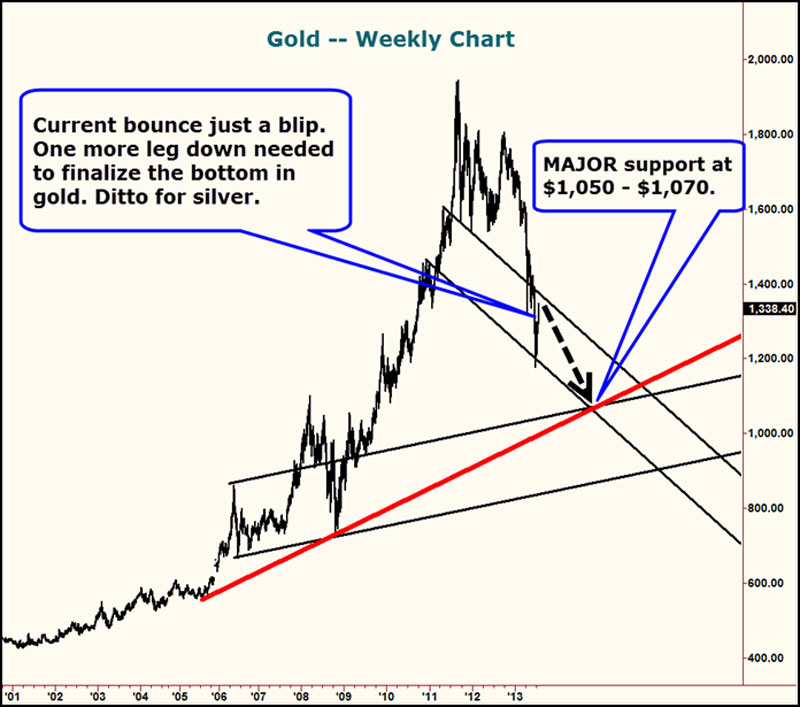
….Potential Major Bottom.
In a previous column, I showed you that my cycle work was showing a possible major low forming in the mining sector last Tuesday, August 6.
Well, I was wrong. It formed the next day, August 7.
You can see it here on this chart of the Market Vectors Gold Miners ETF (GDX). Notice the spike low on August 7 and how it penetrated and closed below the uptrend line.
Then the next day the GDX surged back above that uptrend line, exploding 9.08 percent higher.
That kind of move — plunging below an uptrend line and immediately and strongly reversing higher back above it — is typically only found at major lows.
So yes, I’d say the cycles were on the money and we have the potential for a major low. To confirm that low, I’d like to see GDX close above the downtrend line shown on the chart.
Then the next day the GDX surged back above that uptrend line, exploding 9.08 percent higher.
That kind of move — plunging below an uptrend line and immediately and strongly reversing higher back above it — is typically only found at major lows.
You can see the same type of action in this chart of the ARCA Gold Bugs ETF (HUI). Note the fake out low and the 9.02 percent surge that followed.
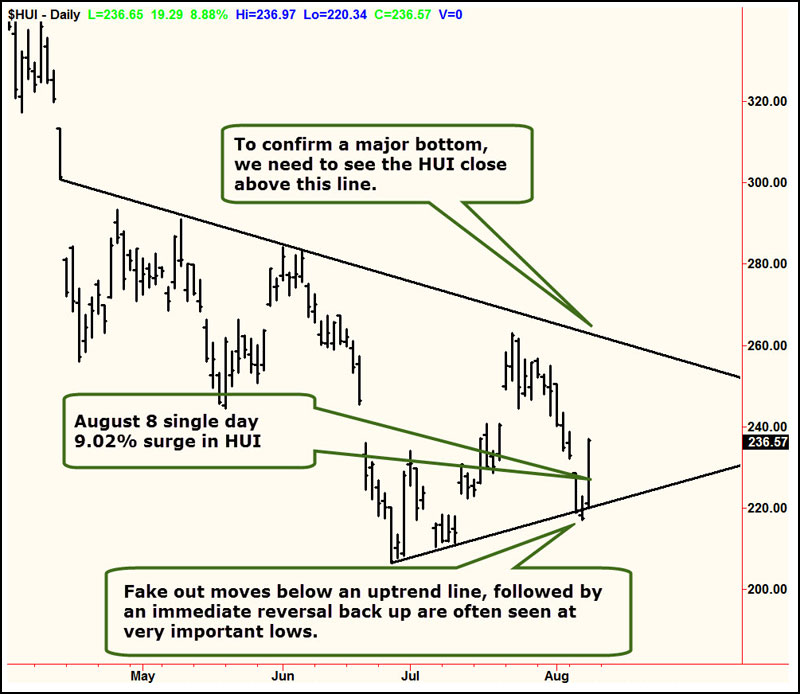
A close above the downtrend line on this chart would confirm a major low for senior miners, which this ETF tracks.
You can also see it here on this chart of the Market Vectors Junior Gold Miners ETF (GDXJ). Again, notice the fake out move into a low followed by an amazing 15.35% single day surge in the most speculative junior miners.
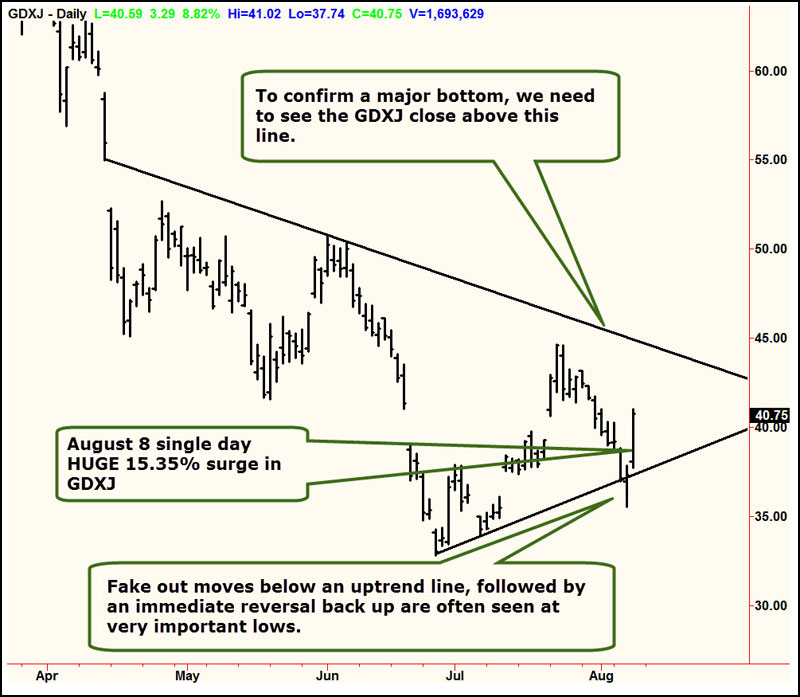
A close above the downtrend line on this chart, and junior miners are off to the races.
So the two most important questions now are:
First, is this the MAJOR bottom for mining shares, and if so, what kind of upside potential could there be over the short and long term? And …
Second, if gold and silver remain weak and head lower into September — as I’ve been warning — won’t that destroy the potential for a major bottom forming now in mining shares?
My answers:
Yes, we indeed have the potential for a MAJOR low in the mining sector. As noted above, the only remaining confirmation would be a close above the downtrend lines shown on each chart, for each of those mining share ETFs.
Assuming that happens, the short-term potential — say over the next six months — is as much as a 50 percent move. That’s not chicken feed.
Over the long-term — the next three years — I think the potential is extraordinary. The right mining shares should double, triple and even quadruple. Select explorers and junior miners should do even better, and multiply your money several times over.
 As to the second question, my models do indeed still show the potential for gold and silver to slide going into September and test the prior major lows or even spike lower to new lows.
But here’s the key you need to know: Don’t buy into the conventional wisdom that mining shares and gold and silver have to bottom — or top — at the same time. More often than not, they don’t parallel each other at important bottoms or tops. Instead, they do their own thing.
This is very important to understand. But not in the way you’re expecting to answer. Let me explain.
I don’t know precisely why mining shares and the underlying metals top or bottom at different times. There are a variety of reasons one can come up with, probably all valid, but in the end, no one really knows why.
The important point is this: As I noted earlier, don’t assume anything when it comes to the markets. Don’t have any preconceived notions of what they can or can’t do. Or what one market or sector can do versus another.
When you do that — and you have preconceived notions or accept commonly held beliefs — I can guarantee that it will trip you up and cost you way more money than it will ever make for you.
That’s always been true in the markets. Ask experienced investors or traders, and they will tell you that just about the worst thing you can do is accept commonly held beliefs or have preconceived notions.
That’s especially true with today’s markets. We are still in a financial crisis. We are in an era of drawn-out sovereign debt crises which can turn the markets — and commonly held beliefs and market relationships — on their heads and inside out.
I don’t want that for you. I don’t want you turned upside down and inside out. I want you with your feet on the ground, thinking objectively and independently. That’s how you will best protect and grow your wealth.
I consider it largely my job to help you do that. It’s why I am always challenging market opinions … often taking a contrarian’s point of view … and why I spend the majority of my time busting all the market myths that are out there.
There are many of them. And the simple truth is that most of what you hear from the talking heads in the financial media is pure garbage.
That said, I will always endeavor to help you see the world a bit differently, so that you’re not sheep led to slaughter.
Right now, here is what I recommend in regards to the miners: Be patient and wait for the above ETFs to close above those downtrend lines that you see on the charts. It’s the more conservative approach, but it should prove to be a nice way to get back into the mining sector.
For active subscribers to my Real Wealth Report and my speculative trading services, get ready to make a potential bundle of money in mining shares. Shortly I am going to pull the trigger on a slew of recommendations.
Best wishes,
Larry
About Larry Edelson
Swing Trading Daily is your source for the most up-to-date, actionable and profitable stock market analysis. Our goal is to provide investors with information on where to find the most profitable ideas in bull markets and when to steer clear from risky investments.
Topics covered include:
Subscribe to our RSS feed to stay on top of all of our articles in real time. You can also follow us on Twitter, Facebook and Google Plus!
This investment news is brought to you by Money and Markets. Money and Markets is a free daily investment newsletter from Martin D. Weiss and Weiss Research analysts offering the latest investing news and financial insights for the stock market, including tips and advice on investing in gold, energy and oil. Dr. Weiss is a leader in the fields of investing, interest rates, financial safety and economic forecasting. To view archives or subscribe, visit http://www.moneyandmarkets.com/.

The Half Full Economy
The marginal economic strength that was described in the most recent GDP release from Washington has caused many to double down on their belief that the Federal Reserve will begin tapering Quantitative Easing sometime later this year. While I believe that is a fantasy given our economy’s extreme dependence on QE, market observers should have learned long ago that the Bureau of Economic Analysis (BEA) initial GDP estimates can’t be trusted. A perusal of their subsequent GDP revisions in the last five years reveals a clear trend: They are almost twice as likely to revise initial estimates down rather than up, and the downward adjustments have been much larger on average.
As a result of this phenomenon, an overall optimism has pervaded the economic discussion that has consistently been unfulfilled by actual performance. The government is continuously over promising and under delivering. Unfortunately, no one seems to care.
Measuring the size of the economy accurately in anything close to real time is difficult, inexact, and messy. That is why the BEA has long pursued a policy of initial quarterly estimates (known as the “advanced estimate”), followed by two or three subsequent revisions as more thorough analysis comes to bear. The first estimates come out about a month after the conclusion of a particular quarter. The second and third revisions then come in monthly intervals thereafter. But in the minds of the media, the public and the politicians, the initial report carries much more weight than the revisions. It is the initial report that attracts the screaming headlines and sets the tone. The revisions are typically buried and ignored. This creates an unfortunate situation where the initial estimates are both the most important and the least reliable.
However, logic would dictate that revisions would fall equally in the up and down categories. After all, government bean counters are expected to report objectively, not to create a narrative or manage expectations. If anything, I believe that the public would be better served if they would adhere to the conservative playbook of under promising. That is exactly what they seemed to be doing before the economic crash of 2008. From 2002 to mid-summer 2008, the BEA revised initial GDP estimates a total of 25 times, 80% of which (20 revisions) were higher than their initial estimate. However, the average amplitude of the upward and downward revisions were equal at .5%. The difference may have been a function of the relatively strong economy that the nation saw over that time (which I believe was a result of the unsustainable and artificial housing boom). See the chart below.
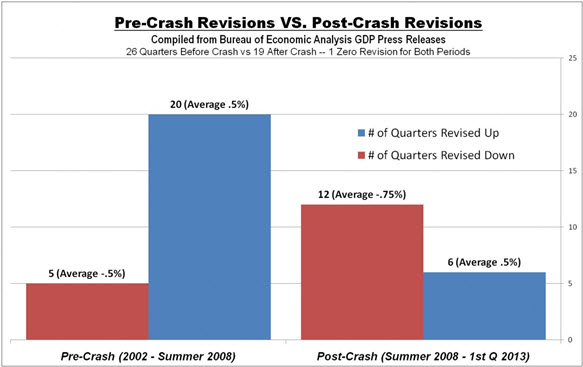
But since mid-2008 we have seen a very different story. 67% of the revisions (12 of 18) have been downward, and those adjustments have been, on average, 50% larger than the upward revisions (.75% vs. .5%). Here’s another way of looking at it: Since mid-2008, revisions have shaved a total of 6 points of growth off the initial estimates. This works out to be an average of 1.3 points of growth per year that some may have expected but that never actually happened.
The pattern of early optimism may stem from the lack of understanding in Washington about how monetary stimulus actually retards economic growth. Many of the statisticians may be former academics who take it as gospel that government spending and money printing create growth. As a result, they expect the initial boost created by stimulus to be sustainable. The evidence suggests that it is not.
But there can be little doubt that these overly optimistic projections have worked wonders on the public relations front. The big Wall Street firms and the talking heads on financial TV set the tone by jumping on the new releases and ignoring the revisions to prior releases. That is precisely what happened last week when the better than expected 1.7% growth in 2nd quarter GDP overshadowed the .7% downward revision to 1st quarter GDP from 1.8% to 1.1%. The initial estimate for 1st quarter GDP, released back in April, was 2.5%. Since the consensus expectation for 2nd quarter GDP was just 1%, the media jumped all over the “good” news, while ignoring the revisions to the prior quarter, and discounting the strong likelihood that Q2 GDP will be revised downward. The nature of our short-term 24-hour news cycle is a big factor in this. Reporters are always looking for the big story of the day, not the minutia of last month. The lack of critical thinking and economic understanding also play a role.
Of course even if you have the discipline to focus on the final estimates, you still aren’t getting the real story. All GDP estimates are based on imperfect inflation measurement tools, which I believe are designed to under report inflation and over report growth. The most recent GDP projection used an annualized .71% inflation deflator to arrive at 1.7% growth. Anyone who believes that inflation is currently running below 1% has simply no grasp of our current economy. Look for more analysis of this topic in my upcoming columns. In the meantime, don’t get excited by initial reports of a healthy recovery. The reality is likely to be more sobering.
Peter Schiff is the CEO and Chief Global Strategist of Euro Pacific Capital, best-selling author and host of syndicated Peter Schiff Show.
Subscribe to Euro Pacific’s Weekly Digest: Receive all commentaries by Peter Schiff, John Browne, and other Euro Pacific commentators delivered to your inbox every Monday!
Don’t forget to sign up for our Global Investor Newsletter.

As the markets are propelled higher by the successive interventions of the Federal Reserve it is hard not to think that the current rise will continue indefinitely. The most common belief is currently that even if the Fed begins to “taper” their purchases the resurgence of economic growth will continue to propel stocks higher even in the face of higher interest rates. The financial world has finally achieved a “utopian” state where there is no longer investment risk in any asset class -because if it stumbles the central banks of the world will be there to catch them.
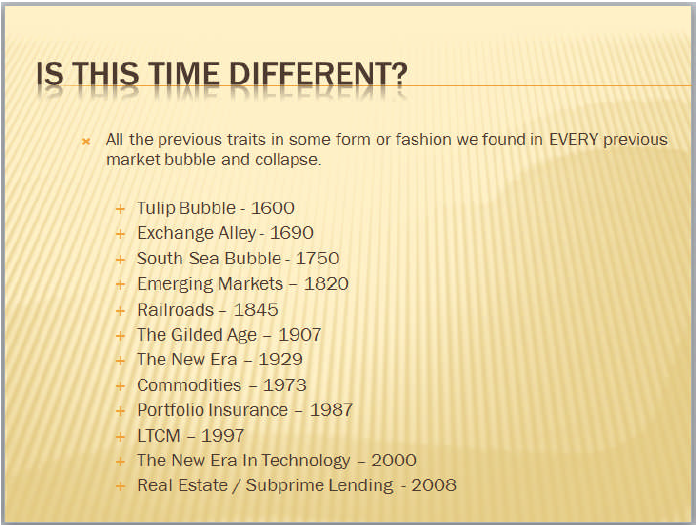
However, a quick look at history tells us that this time is not really different. In March of 2008 I was giving a seminar discussing why we had already likely entered into a recession and that a market swoon of mass proportions was approaching. While the advice fell on deaf ears as we were in a “Goldilocks” economy, and “subprime” was contained, the bubble ended just a few short months later as it was no “different” then versus any other time in history, or, even now.
The slide below was from the presentation:
About Lance Roberts
Lance Roberts, the host of “StreetTalkLive”, has a unique ability to bring the complex world of economics, investing and personal financial wealth building to you in simple, easy and informative ways but also makes it entertaining to listen to at the same time. Lance brings fundamental, technical and economic perspectives, combined with a unique focus, to the day’s news helping listeners understand how it impacts their money.
After having been in the investing world for more than 25 years from private banking and investment management to private and venture capital; Lance has pretty much “been there and done that” at one point or another. His common sense approach has appealed to audiences for over a decade and continues to grow each and every week.
Making money is not hard. Learning how to keep it has been the trick. Lance’s teachings are fairly basic. Conservation of principal, a disciplined approach and living on less than you make and carrying little or no debt is the only way to build wealth. His advice is more of the “chicken soup” variety as there is no magic “black box” to build wealth – just time, hard work and sacrifice.
Lance is also the Chief Editor of the X-Report, a weekly subscriber based-newsletter that is distributed nationwide. The newsletter covers economic, political and market topics as they relate to the management portfolios. A daily financial blog, audio and video’s also keep members informed of the day’s events and how it impacts your money.
Lance’s investment strategies and knowledge have been featured on Fox 26, CNBC, Fox Business News and Fox News. He has been quoted by a litany of publications from the Wall Street Journal, Reuters, The Washington Post all the way to TheStreet.com as well as on several of the nation’s biggest financial blogs such as the Pragmatic Capitalist, Zero Hedge and Seeking Alpha.
After all it is “All About You And Your Money”

-
I know Mike is a very solid investor and respect his opinions very much. So if he says pay attention to this or that - I will.
~ Dale G.
-
I've started managing my own investments so view Michael's site as a one-stop shop from which to get information and perspectives.
~ Dave E.
-
Michael offers easy reading, honest, common sense information that anyone can use in a practical manner.
~ der_al.
-
A sane voice in a scrambled investment world.
~ Ed R.
Inside Edge Pro Contributors

Greg Weldon

Josef Schachter

Tyler Bollhorn

Ryan Irvine

Paul Beattie

Martin Straith

Patrick Ceresna

Mark Leibovit

James Thorne

Victor Adair