The bear market in precious metals equities will end soon, says Jordan Roy-Byrne, editor and publisher of The Daily Gold Premium, perhaps even by the end of the year. But the rising tide will not lift all juniors equally. In this interview with The Gold Report,Roy-Byrne explains why bottom-fishing is a bad idea and why the savvy investor must find companies that will not just survive but thrive when the bears become bulls.
The Gold Report: The managing director of the International Monetary Fund, Christine Lagarde, worries about the world sliding back into recession. What are the chances of that?
Jordan Roy-Byrne: We tend to have recessions every four or five years, on average. In the last 30 or 40 years, however, recessions have been less frequent than the average, due to extremely expansionary monetary policy. But another recession is almost a certainty in the next couple of years. I expect it will be milder than the 2008 recession. Typically, after such a severe recession or financial crisis the next recession is quite mild in comparison.
TGR: We seem to have permanent quantitative easing in the U.S. Do you think there’s a point when the country will hit a debt wall?
JRB: I don’t know if the U.S. will ever hit a debt wall. We have the world’s reserve currency, and that’s not going to change any time soon. We have the ability to print a lot of money, and there’s always going to be demand for our bonds. If that demand wanes, I think we will see central banks increase their buying. They will buy every bond if they have to in order to prevent interest rates from rising.
Looking out over the next five years, I see similarities to the 1940s after World War II when there was essentially huge quantitative easing and interest rate price fixing. This was done to lower the debt-to-GDP ratio. There were a couple of recessions, but when the economy grew, it grew very strongly. There was quite a bit of inflation, that was the negative consequence, but the debt-to-GDP ratio did begin to decline.
The problem with debt is not the nominal amount. The problem is when the economy doesn’t grow fast enough to service the debt. One way to deal with that problem is to keep interest rates extremely low so there is very high nominal growth. The drawback to this is inflation. Commodity prices in the mid-to-late 1940s escalated substantially. I think we could see similarities in the next five years.
TGR: We’ve seen for some time an inverse relationship between precious metal stocks and equities in general. Do you think this will continue? Must equities fall before gold and silver stocks rise?
JRB: I do think this relationship will continue. Historically, gold stocks have performed fantastically at times when equities are in a bear market. The two best examples are 1972–1974 and 2000–2003. Because the gold bugs have lost a lot of money and don’t have the firepower to drive the market higher right now, outside money is going to have to come in. I think once conventional investments weaken, which I expect to happen in the next three to six months, asset managers will look to precious metals. For example, there were quite a few generalists and international fund managers at the recent Denver Gold Forum.
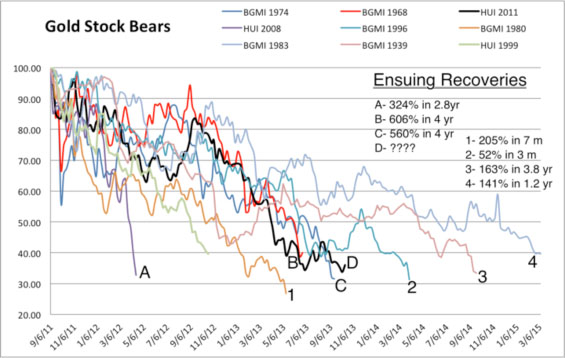
TGR: How long will this bear market in precious metal stocks last?
JRB: It could already be over. Gold and gold stocks have been in a bear market for two years and two months but silver, silver stocks and juniors peaked in April 2011 and have been in a bear market for 2.5 years. History shows that bear markets in the gold stocks tend to average 65%, while the two worst were 72%. At the June low the NYSE Arca Gold BUGS Index (HUI) was down 67%. That tells us the market is likely very close to a low or has already bottomed.
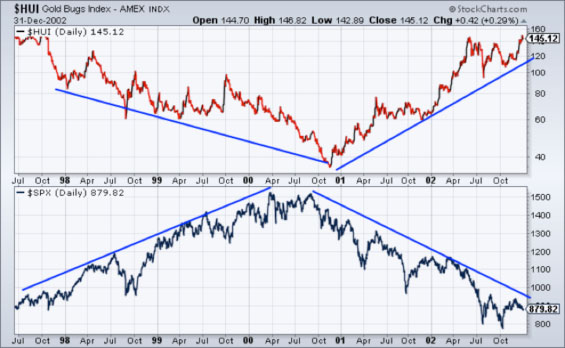
The market is retesting its summer low. Some stocks have already bottomed. Some will make double bottoms, and the worst will make new lows. That’s just how a bottom is—disjointed. The major bottoms in 2000 and 2008 occurred in October–November, so we are right on schedule.
TGR: How strong will the recovery be?
JRB: The recovery will be fantastic because that’s what always happens in this sector. Looking at recoveries from major bottoms starting from 1960, the average recovery for large gold stocks was 58% over the first four months and 75% over the first seven months. My guess is that the next recovery will be stronger than average, but the problem is we don’t know when it will start. It could be late November or even January. It could have started already. In the summer rally, Market Vectors Junior Gold Miners ETF (GDXJ) rebounded 59% from its low in only two months. Odds are, many stocks could be up 40–50% before most realize a bottom is in.
TGR: Could you talk about relative strength analysis and its importance to the valuation of precious metal stocks?
JRB: Relative strength analysis is a type of technical analysis that compares one security or market to another. We use this analysis to spot market leaders and market laggards. We want to own the leaders and avoid the laggards, obviously. You don’t necessarily want to chase the strongest stocks. There’s an art to it. My view is you want to identify what the strongest stocks are when the sector is correcting, and you want to buy them when they are correcting.
For example, the market has been correcting for the last several weeks, and this may continue for another week or two. So, if you happen to like a stock that has performed really well and you haven’t bought it yet, maybe in the next week or two that stock will come down another 5%, 10% or 15%, and that gives you the opportunity to buy it.
TGR: You’ve written that buying a weak stock on the dip is not a good idea. In a time of bottoming stocks, however, there is a great temptation to go bottom fishing. How do investors distinguish between stocks that are truly undervalued and those that have fallen for good reason?
JRB: Mining companies—95% of them, anyway—are not like blue chip stocks. A lot of these companies that have declined 80% can end up declining 99%. Relative strength analysis should be used in conjunction with fundamental analysis. For example, you may really like a company, but if it’s badly underperforming the sector, that is a warning sign.
A recent example is Pretium Resources Inc. (PVG:TSX; PVG:NYSE). It was very strong during the summer rebound, but at the end of August some huge and consistent selling came in and it continued into September. It was one of the weakest stocks in September, ahead of its major decline. The warning signs were there.
TGR: Let’s look at the four big mining locations in North America: Nevada, Mexico, Ontario and Quebec. We’ll begin with Mexico. Which companies do you like there and why?
JRB: Some of the absolutely best companies are located in Mexico, and that should tell you something about Mexico as a jurisdiction. Two of the best are First Majestic Silver Corp. (FR:TSX; AG:NYSE; FMV:FSE) and Argonaut Gold Inc. (AR:TSX). First Majestic put its Del Toro mine into production this year. It is ramping up steadily and will be the company’s largest mine. First Majestic continues to have a stronger growth outlook than all of its smaller former peers, which is quite amazing considering how strongly the company has grown already. One might expect its size to limit its growth. That’s not the case.
As far as relative strength goes, First Majestic has held up very well during this downturn compared to the majority of silver stocks. Typically, when silver rallies, First Majestic shares perform well. In the recent summer rally, shares went from $9 to $16. Again, this is quite amazing, considering that First Majestic is a billion-dollar company, not some tiny junior.
TGR: And Argonaut?
JRB: Argonaut has two growing mines in Mexico, La Colorada and El Castillo, and two strong development projects, San Antonio in Mexico and the recently acquired Magino project in Ontario. There could be permitting issues with San Antonio. It’s not going to be a slam dunk, but if Argonaut can get that mine into production before the end of 2014, it will have a growth profile basically unmatched by anyone in the industry. In addition, Argonaut has ongoing cash flow, a very strong cash position of around $140 million ($140M) and one of the best management teams in the industry.
TGR: Do you consider Argonaut to be an undervalued stock that’s likely to show a significant gain with the end of the bear market?
JRB: Yes. Argonaut’s relative strength has been very strong for the most part over the last year or two. In early July, its shares went from about $5 to more than $8, and I think we’re going to see a similar move when the bear market ends in the next few months.
Argonaut has the management, the capital and the projects to be a serious growth-oriented producer over the next three or four years. That’s why I call it a long-term gift.
TGR: What do you like in Nevada?
JRB: Nevada’s a great jurisdiction, both politically and geologically. Drill costs tend to be lower and deposits are easier to work with because so many projects are open pittable and heap leachable. There are two Nevada companies I like. The first is Corvus Gold Inc. (KOR:TSX). This is one of my absolute favorites right now. The company has a large gold deposit called North Bullfrog very close to Barrick Gold Corp.’s (ABX:TSX; ABX:NYSE) old Bullfrog mine.
Corvus’ main resource at North Bullfrog is moderately economic at current prices, but the real kicker is that it has been getting higher-grade intercepts at Sierra Blanca and especially Yellowjacket, and the metallurgy on the latter is very good. Corvus will be coming out with a new resource estimate by the end of 2013 or early 2014 and a preliminary economic assessment will follow. Yellowjacket is going to be part of a starter pit, and I believe the economics at these gold prices are going to be very favorable.
TGR: What is Corvus’ relative strength?
JRB: Its relative strength could be indicating that it has something very significant on its hands and that Yellowjacket is going to be worth quite a bit. Corvus is one of only three stocks in this sector trading above a rising 400-day moving average. It’s difficult to buy a stock that’s already gone up so much, but I think Corvus is going to perform very well in 2014. I think it has a good shot to be acquired.
TGR: What is your second Nevada pick?
JRB: As far as production stories go, Klondex Mines Ltd. (KDX:TSX; KLNDF:OTCBB) is one I’ve started following recently. With regard to relative strength, it has been one of the strongest stocks over the last six to nine months. If you like the fundamentals, you want to try to buy it on weakness. Klondex’s Fire Creek project looks to have outstanding potential. Grades have been spectacular; the company has a sizeable resource and it has been doing some bulk sampling, which I believe has gone pretty well.
When Klondex goes into commercial production, it is going to be able to produce a sizeable amount of gold at a low cost with very low capital expenses. It’s going to be highly economic, but it won’t be easy, and there will have to be some financings along the way. This is an underground, narrow-vein mine, but the new CEO, Paul Huet, is experienced with these types of deposits and is the man for the job. It’s a perfect fit.
TGR: What do you like in Ontario and Quebec?
JRB: Balmoral Resources Ltd. (BAR:TSX.V; BAMLF:OTCQX), which just announced a financing that will take its cash position to $11M. The company has made a high-grade discovery at its Martiniere project, which is located about 40 kilometers away from Detour Gold Corp.’s (DGC:TSX) mine. Balmoral should have a maiden resource estimate out in early 2014. This is going to be a high-grade property, and, like Corvus, it’s another potential acquisition.
The stock has been beaten down, but it did rally 100% during the summer. That tells me that there is a lot of leverage if you buy shares near a low. CEO Darin Wagner has done it before—built up an exploration company and sold it for nearly $0.5 billion. It looks as if he’s going to be able to do it again. The question comes down to what price will Balmoral sell out. Obviously it wants to wait for a market recovery, so it can prove up more value and get a better price. At the same time, potential acquirers (of not just Balmoral) want to wait for improved market sentiment. No one is taking any risks right now, though those that do could be rewarded.
TGR: Any other companies anywhere you’d like to mention?
JRB: Bear Creek Mining Corp. (BCM:TSX.V) in Peru. The company’s Corani deposit has gotten environmental approval, and it’s going to be a mine. The economics are tremendous. It can make money at $20/ounce ($20/oz) silver, and it can make a ton of money at $25/oz. This is a stock that has shown very good relative strength over the last 12 months. That says that long-term selling has dried up.
The only issue for Bear Creek is financing. The company can’t escape doing an equity component if it intends to finance the entire project, and that would be just too dilutive at these prices. So it is going to look at starting with a smaller operation, getting that going and then working its way up because this will eventually become a huge mine.
TGR: What about Bear Creek’s Santa Ana project?
JRB: That was taken away by the previous administration in Peru. Bear Creek has been going through the courts to try to get it back. There was a story in Reuters that quoted the mining minister of Peru saying he was looking for an amicable solution. The market is essentially giving Bear Creek zero for this project, but it looks as if the company could get some value out of it in the coming months. I think investors should keep their eyes on the Santa Ana situation. Who knows? This could be a reason why Bear Creek shares are showing good relative strength.
TGR: Bear Creek’s share price has yo-yoed from $1.60 to more than $2.50 twice since August.
JRB: It’s a very volatile stock. There’s not a huge amount of liquidity in it because something in the vicinity of 50–60% is held by a small number of hands. Silver Wheaton Corp. (SLW:TSX; SLW:NYSE) and Tocqueville are big holders. It’s a stock you want to buy on weakness rather than on strength.
TGR: We’ve discussed companies in Mexico and Peru. A couple of people I’ve interviewed in the last month have said that they are not happy with the talk of a new Mexican royalty regime. What do you make of this?
JRB: First, nothing has gone through. Second, the mining lobby in Mexico is very powerful, so I would be surprised if it does go through at that level. We’re talking about a 7% tax. If we get back into a bull market for precious metals, I don’t think 7% is really going to matter. I’m not an expert on this issue, but maybe we’ll see a 3% or 4% tax go through. It’s just a random guess.
Based on the charts of how companies operating in Mexico are performing, this potential tax is not an issue. However, if these companies in Mexico start to underperform the sector it could be because of the new tax regime.
TGR: Peru was regarded as toxic just a few years ago, but its reputation has improved a fair bit. I’m told that each company operating in Peru has to be considered individually based on its ability to come to a modus vivendi with the government and local communities. Do you agree?
JRB: I think that’s accurate. Let’s step back and remember that Peru is one of the world’s leading producers of commodities. Peru is economically dependent on the mining industry. Bear Creek is a wonderful example of what you said. At Corani, Bear Creek has done fabulous work with the local community, which will see lots of jobs when it goes into production. But Santa Ana was taken away from the company because of local strife. The two projects are in completely different areas. It’s a case-by-case situation. Investors have to look at where the project is located and the attitudes of the local community. Bear Creek’s situation underscores this perfectly.
TGR: Maynard Keynes said famously that the market can remain irrational longer than an investor can remain solvent. Many investors in gold and silver companies are close to their limits in this regard. What advice do you have for them?
JRB: Well, everyone’s personal financial situation is different. Everyone has different goals and tolerance of risk and time objectives. Therefore, it’s difficult to give blanket advice, but if investors are in companies that have been market laggards, companies that don’t have much potential, they have got to sell them. They should do research and get into companies with the potential to be market leaders, companies that will not just survive but thrive when we do get a recovery.
TGR: Jordan, thank you for your time and your insights.
Jordan Roy-Byrne is a Chartered Market Technician, a member of the Market Technicians Association and a former official contributor to the CME Group, the largest futures exchange in the world. He is the editor of The Daily Gold Premium, and his work has been featured in CNBC, Barron’s, the Financial Times, Alphaville, Yahoo Finance, Business Insider, 321Gold, Gold-Eagle, FinancialSense, GoldSeekand Kitco.
Want to read more Gold Report interviews like this? Sign up for our free e-newsletter, and you’ll learn when new articles have been published. To see a list of recent interviews with industry analysts and commentators, visit our Streetwise Interviews page.
Related Articles
DISCLOSURE:
1) Kevin Michael Grace conducted this interview for The Gold Report and provides services to The Gold Report as an independent contractor. He or his family own shares of the following companies mentioned in this interview: None.
2) The following companies mentioned in the interview are sponsors of The Gold Report: Argonaut Gold Inc., Klondex Mines Ltd. and Balmoral Resources Ltd. Streetwise Reports does not accept stock in exchange for its services or as sponsorship payment.
3) Jordan Roy-Byrne: I or my family own shares of the following companies mentioned in this interview: Argonaut Gold Inc., Bear Creek Mining Corp. and Corvus Gold Inc. I personally am or my family is paid by the following companies mentioned in this interview: None. My company has a financial relationship with the following companies mentioned in this interview: Argonaut Gold Inc., Corvus Gold Inc., Bear Creek Mining Corp., First Majestic Silver Corp. and Balmoral Resources Ltd. I was not paid by Streetwise Reports for participating in this interview. Comments and opinions expressed are my own comments and opinions. I had the opportunity to review the interview for accuracy as of the date of the interview and am responsible for the content of the interview.
4) Interviews are edited for clarity. Streetwise Reports does not make editorial comments or change experts’ statements without their consent.
5) The interview does not constitute investment advice. Each reader is encouraged to consult with his or her individual financial professional and any action a reader takes as a result of information presented here is his or her own responsibility. By opening this page, each reader accepts and agrees to Streetwise Reports’ terms of use and full legal disclaimer.
6) From time to time, Streetwise Reports LLC and its directors, officers, employees or members of their families, as well as persons interviewed for articles and interviews on the site, may have a long or short position in securities mentioned and may make purchases and/or sales of those securities in the open market or otherwise.

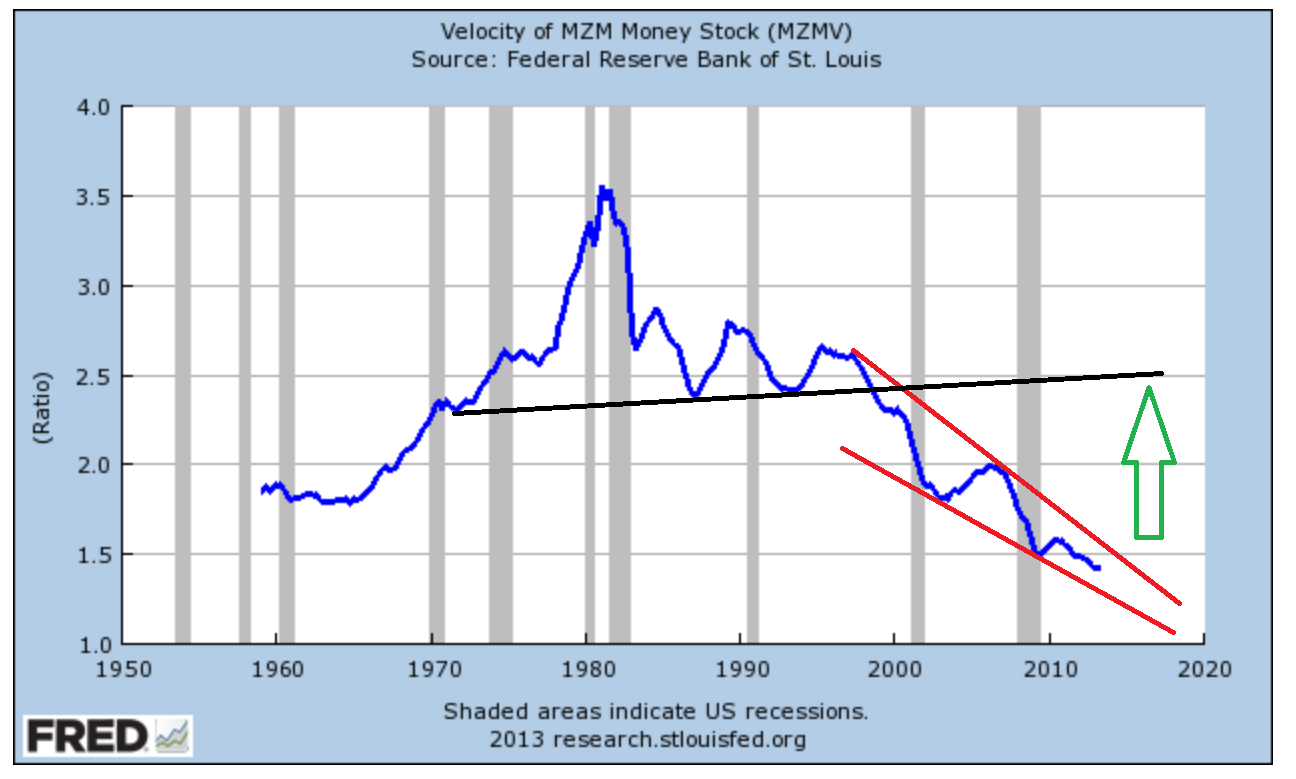 This “MZM” (Money Zero Maturity) chart is especially interesting, because it excludes large time deposits.


