
Bonds & Interest Rates
Washington (AFP) – US producer prices slipped slightly in September after August’s gains, pulled down by falling food prices, leaving wholesale inflation almost flat from a year ago, the Labor Department said Tuesday.
Producer prices dropped 0.1 percent from August; excluding volatile food and energy, prices were up 0.1 percent.
For the year to September, producer prices — an indicator of inflationary pressures — were up a bare 0.3 percent.
That was the lowest 12-month change since October 2009, when prices were contracting, providing evidence that economic growth remains tepid.
“Despite noise in components, wholesale inflation is tame,” said economist Chris Low at FTN Financial.

Retail sales in the U.S. outside of auto dealers climbed in September, indicating households were sustaining the economic expansion before the government shutdown shook confidence.
The 0.4 percent gain in purchases excluding vehicles followed a 0.1 percent increase in August and matched the median forecast of economists surveyed by Bloomberg, Commerce Department figures showed today in Washington. Total sales dropped 0.1 percent, restrained by the biggest decrease at auto dealers since October 2012, as purchases early in the month were included in the August data.
Americans snapped up the newest cellular phones and video games last month as low borrowing costs and rising household wealth backed by improving home and stock prices gave them the wherewithal to sustain demand. At the same time, the 16-day partial closing of federal agencies may have upended spending this month as consumers grew increasingly concerned it would hurt the world’s largest economy.
“Consumers continue to hold in despite all the uncertainty going into the shutdown,” said Millan Mulraine, director of U.S. rates research at TD Securities USA LLC in New York, who accurately projected the gain in sales excluding autos. “We ended the quarter on a fairly solid note. Whether this buoyancy can be sustained remains a question after the hit to consumer confidence from the shutdown.”

The Conference Board has just released its monthly consumer confidence measure, and it was a big miss.
The measure dropped to 71.2 in October, down from 79.7 and missing economist expectations of 75.0.
“Consumer confidence deteriorated considerably as the federal government shutdown and debt-ceiling crisis took a particularly large toll on consumers’ expectations,” Conference Board Director Lynn Franco said in a statement.
“Similar declines in confidence were experienced during the payroll tax hike earlier this year, the fiscal cliff discussions in late 2012, and the government shutdown in 1995/1996. However, given the temporary nature of the current resolution, confidence is likely to remain volatile for the next several months.”
Respondents expecting business conditions to improve over the next six months dropped to 16% from 20.6%, but those expecting conditions to worsen jumped to 17.5% from 10.3%, according to the report.

 Usually what goes up normally ends up coming back down to Earth with a damn great thud. Well, that was long ago with good old Isaac Newton and the apple story. Apple might well be part of the story these days as an example of things that are going up but that have ascended so high for the moment that they have almost vanished from sight. But, there is simply no reason to defy the laws of Newton on Gravity. Negating the laws of gravity in such a way as to turn Newton on his own head is exactly what the stock market is doing right now. Antigravity might not exist in the real world but there is a theory that is refuted by the Gravity Establishment as to the means of blocking gravity effects on bodies. Have the stock markets and the financial wizards just put that into practice and is there some way of explaining why the stock market has increased yet again with no apparent reason?
….read more HERE

Many events moved the market this month. Gold demand was stable but more important, gold is getting a boost from the weaker U.S. dollar.
The U.S. dollar is now clearly bearish, and since gold and the U.S. dollar generally move in opposite directions, this is very bullish for gold. So is the fact the Fed’s QE stimulus is currently expected to continue well into 2014.
Plus, gold tends to rise every time Congress raises the U.S. debt ceiling. And with the debt ceiling recently lifted, gold is indeed looking upward.
GOLD’S BIG PICTURE
While gold has been much stronger than most currencies over the past 12 years, it still hasn’t compared to the grand rise in the 1970s.
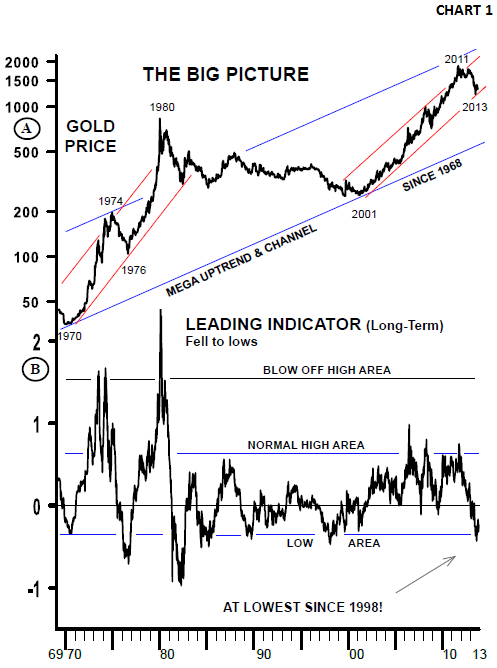
Chart 1 shows the gold price since 1969. Back then, gold rose 2300% in 10 years, from 1970 to 1980. The blow-off peaks were clearly pronounced. But this time around, the gold rise has been moderate in comparison.
Gold had a steady 10 year rise from 2001 to 2011 and it gained 661%. That wasn’t shabby by any means, but it certainly wasn’t like the 1970s.
As you can see, gold’s leading indicator reached a normal high area during the 2001-2011 rise. But the spike peaks to blow off high areas seen in the 1970s are still to come.
Many are comparing today’s decline to the 1976 decline. Then, gold gave back 50% after rising about 460% from 1970 -74. Today, gold has given back 36% of its 661% rise.
However, the troubled world we live in is proving plenty of ammunition to say a rise similar to the 1976-80 rise could still be ahead of us.
In addition, gold’s leading indicator is currently at a major low area. In other words, gold is bombed out and very oversold, reinforcing the likelihood of an upcoming sustained rise.
For now though, we’ll take gold’s renewed upmove one step at a time…
Much will tell us the direction over the next month or two. We’re currently in a seasonally strong month for the metals and a rise, even if it’s not a strong leg upward, should continue to be promising.
TIMING IS KEY
This is where gold timing comes in.
Gold has been forming a good looking base since reaching its closing low above $1200 on June 27. And it’s becoming more important for this low area to hold (see Chart 2A).
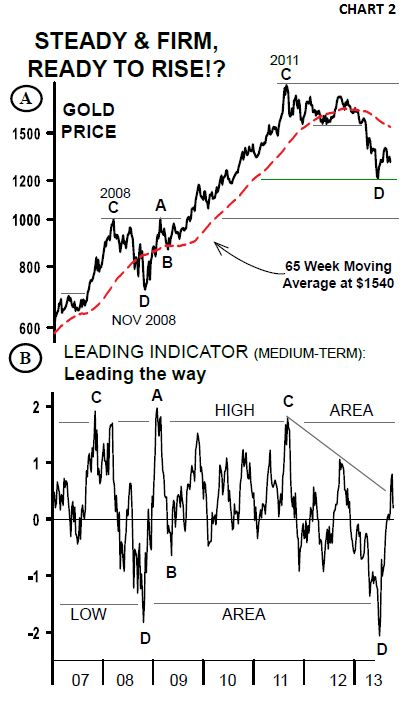
As long as it does, the market will be fine.
This chart shows the major steps in the market. The green line shows the $1200 low. And if it holds, as most indicators suggest, we could next see gold rise to the $1536 – $1540 area.
This is a key level. It’s the old support and the 65-week moving average.
If gold fails to break above this level, the bear will not be out of the woods. But if it’s clearly surpassed, we could then see the $1700 level tested and possibly the old highs revisited!
—
Mary Anne & Pamela Aden are well known analysts and editors of The Aden Forecast, a market newsletter named 2010 Letter of the Year by MarketWatch, which provides specific forecasts and recommendations on gold, stocks, interest rates and the other major markets. For more information, go to www.adenforecast.com


-
I know Mike is a very solid investor and respect his opinions very much. So if he says pay attention to this or that - I will.
~ Dale G.
-
I've started managing my own investments so view Michael's site as a one-stop shop from which to get information and perspectives.
~ Dave E.
-
Michael offers easy reading, honest, common sense information that anyone can use in a practical manner.
~ der_al.
-
A sane voice in a scrambled investment world.
~ Ed R.
Inside Edge Pro Contributors

Greg Weldon

Josef Schachter

Tyler Bollhorn

Ryan Irvine

Paul Beattie

Martin Straith

Patrick Ceresna

Mark Leibovit

James Thorne

Victor Adair