
Gold & Precious Metals
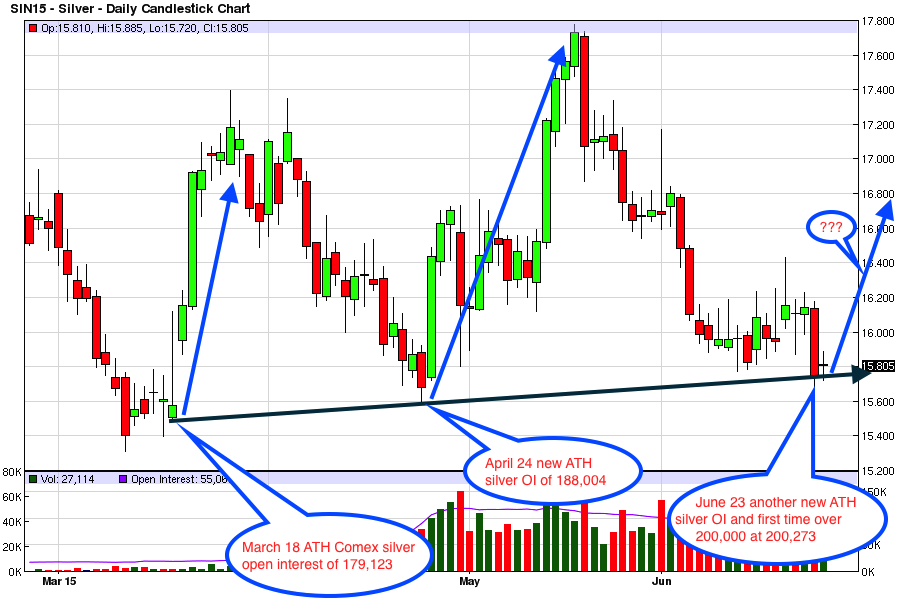
For the first time ever, total Comex silver open interest exceeded 200M contracts yesterday, settling at 200,273. This means that the coming Spec short squeeze is going to be violent and substantial. And why isn’t anyone calling this a “bubble”?
The final open interest numbers for yesterday are in and they are truly remarkable. Gold, which declined by $7, saw its OI rise by over 11,000 contracts to 430,978. This is the highest Comex gold OI since late March. Since yesterday was a CoT survey day, there’s no doubt in my mind that this week’s report will show another substantial and bullish improvement in the gold CoT structure. Why? For the Wed-Tue “CoT week”, gold was down $5 but total Comex OI ROSE by over 15,000 contracts with 2/3 of the rise coming Fri-Tue when price was declining by over $25. That’s A LOT of fresh Spec shorting in gold and it will likely move the gold CoT to a bullish structure not seen since the early November lows last year.
That’s all well and good but, obviously, the point of this post is silver so let’s get right to it…
Yesterday, as price was being smashed nearly 2.5% or 40¢, total Comex silver OI rose by another 4,909 contracts to close at 200,273. That’s the first time in the history of the Comex that total OI has exceeded 200,000 contracts.
- First of all, why now? Why is silver OI at record highs when price is at 5-year lows? And where are all the “bubble callers”? They were out in force four years ago with price in the $40s and total OI at 140,000. Why can’t this current time be called a “short bubble”? It clearly is. I guess it’s only a “bubble” when it fits the narrative you’re trying to promote.
- Let’s do some math. There are 5,000 ounces of paper silver behind every Comex contract. Multiply 5,000 X 200,000 and you get a total Comex obligation of over 1,000,000,000 ounces of silver. Hmmm. Last year’s global mine supply was just under 900,000,000 ounces and the TOTAL Comex vault shows holdings of 181,000,000 ounces. How is it even legal to print 200,000 contracts when there’s only enough silver in the vaults to cover less than 40,000?
- On the topic of mine supply, the WGC estimates total global gold mine supply at about 92,000,000 ounces. Total Comex gold OI at 430,978 represents 43,000,000 ounces or about 47% of total annual mine supply. In silver, as noted above the percentage is about 112% of total annual mine supply.
From a CoT standpoint, this is all extraordinarily bullish for paper silver. As mentioned earlier, the next report is due Friday and it will be based upon these numbers from last evening. For the CoT week, silver was down 21¢. Remarkably, over this same period, total silver OI spiked by 9,500 contracts from 191,774 to yesterday’s 200,273. From a CoT perspective, we are back to a very bullish extreme in silver, too.
And what about the short squeeze that we’ve been expecting. OH, IT’S DEFINITELY COMING and the growth of Spec short open interest this week only adds more fuel for the fire. All we need is a spark. We almost had that spark last week after the Fedlines but silver failed to cross its 50-day moving average and fell back. The “doubling-down” on Spec short positions this week is simply accelerant for the fire once it begins. The chart below can’t make it much more clear for everyone:
In other news today, the Greek situation is reaching a true crisis point and the US economy is slipping into recession. Meh,
whatever. The HFT algos don’t give a damn about such arcane notions as fundamentals, all they see is a declining yen and they sell “gold” accordingly:

I need to get this posted so I’ll just leave you with this…
In the 3.5 years since MFingGlobal when I officially quit trading, rarely have I been so tempted to wander full force into The Casino. This current situation is so extreme and the “short bubble” so HUGE that it is very difficult for me to remain on the sidelines. However, on the sidelines I shall remain. This personal restriction does not apply to you, however, my dear reader. Best of luck, be patient and prepare accordingly.
TF

 The money bubble has not yet burst, although we’re getting close to that moment in time. We’re seeing some unusual events that have occurred over the past 12 months.
For example, although interest rates have moved back up recently, a couple of weeks ago, people were paying money to have the German government take their money for 10 years. That’s a sign something is amiss. Capitalism doesn’t work that way. If you pay to have your money decrease over 10 years, you’re destroying capital.
Still, we haven’t had the pop of the bubble yet, but we’re on a clear trend toward the bubble popping, which it will if we don’t go back to sound money policies. The popping of the bubble means that fiat currencies will no longer be used and trusted in commerce the way they are now because people will have lost confidence in them.
HAI: In that context, what do you make of the recent rally in the U.S. dollar? Is it just one fiat currency rising against other ones? Is it meaningless?
…read the whole interview HERE

 As stated previously, asset monetization by small E&P operators will start in earnest in the second half of this year out of cash flow necessity. Most, if not all, smaller market capitalization companies, public or private, are still free cash flow negative (operating cash flow less capital expenditure) and only a few of the larger ones are now, or will be, based on guidance. The point is, with volumes languishing (and probably poised to decline) tied to a flat oil futures price curve and with economics marginal at $60 per barrel, many E&P operators find themselves running through hedges in 2015 and still in need to finance their already reduced capital spending.
With Wall Street unwilling to lend anymore and prospects of fall credit line redeterminations looming, further reducing liquidity, it islikely small E&P operators will turn to either mature producing asset sales or, more likely, to undeveloped assets which require more capital spending. We are seeing this being factored into stock prices as we speak, as small cap E&P valuations have collapsed to 4-6 times the Enterprise Value/Earnings Before Interest, Taxes, Depreciation, and Amortization (EV/EBITDA) from 6-8X EV/EBITDA. This not only reflects solvency risk but also the natural course of bringing assets to a price more in line with their underlying sale value.
Wall Street is famous for getting public prices at levels that magically make deals happen and, with better funded E&P companies
trading at substantial premiums vs. the leveraged ones, this is what is occurring. Take the collapse of Goodrich Petroleum (GDP) as a prime example as to what is now taking place and what will continue through the latter half of this year. Here is a company with $100million in liquidity but who continues to be free cash flow negative on current strip pricing in 2015 & 2016. However, it has a capital spending budget of $100 million for 2015 and 2016 and a free cash deficit of $60 million-$80 million in each of 2015 and 2016 depending on asset price assumptions. To plug the hole it hopes to sell its Eagle Ford assets this year.
This isn’t intended to make a case on GDP but to demonstrate the quantifiable ongoing stupidity of perpetuating models that aren’t self-funded which were being fueled by easy money from the Federal Reserve. This also demonstrates how the OPEC strategy of maintaining an oil price ceiling is affecting U.S. E&P companies, forcing a consolidation which I believe will be unprecedented in size and scope. This will eventually improve the industry cash flow break even points, based on improved cost and scale and, as a result, cast doubt over the long term viability of the OPEC strategy. It appears the Saudis, despite being educated here in the US, have neglected their capital market & economic classes as we are witnessing the E&P model self-correcting itself. State run oil companies don’t do this very well and usually fail to adjust to price movements while free market capital-based societies do.
The revival of the US oil industry will occur after the upcoming consolidation and will reduce the number of cost inefficient players as well as the short selling in group while ultimately, self-healing the industry by improving cash flows, given the likelihood of oil remaining below $100. I fully expect valuations to expand in 2016, once the wave of asset sales starts in the months ahead. These operators with plenty of cash will be the biggest beneficiaries.
On a final note, listening to the Federal Reserve yesterday it was clear that the pressure on the dollar rise is being lifted as they now realize that, despite attempts to fudge economic statistics, the US economy is in recession and rate hikes are a farce based on hope and little else. Expect the dollar to weaken considerably, breaching the 2015 lows thus supporting oil prices now and into 2016. This reality is not baked into expectations and the 1-2 percent dollar correction which took many by surprise is only the beginning.

Today’s chart illustrates the price to earnings ratio (PE ratio) from 1900 to present. Generally speaking, when the PE ratio is high, stocks are considered to be expensive. When the PE ratio is low, stocks are considered to be inexpensive. From 1900 into the mid-1990s, the PE ratio tended to peak in the low to mid-20s (red line) and trough somewhere around seven (green line). The price investors were willing to pay for a dollar of earnings increased during the dot-com boom (late 1990s), surged even higher during the dot-com bust (early 2000s), and spiked to extraordinary levels during the financial crisis (late 2000s). Since the early 2000s, the PE ratio has been trending lower with the very significant but relatively brief exception that was the financial crisis. More recently, due to rising stock prices and declining corporate earnings, the PE ratio has trended higher and has just made a new post-financial crisis high and is now at a level that prior to the 1990s would have been considered very high.

Quote of the Day
“Price is what you pay. Value is what you get.” – Warren Buffett
Events of the Day
June 29, 2015 – Wimbledon tennis tournament begins (ends July 6th)
July 01, 2015 – Canada Day
July 04, 2015 – US Independence Day
July 06, 2015 – Running of the Bulls begins in Pamplona, Spain (ends 7/14)
Stocks of the Day
— Find out which stocks investors are focused on with the most active stocks today.
— Which stocks are making big money? Find out with the biggest stock gainers today.
— What are the largest companies? Find out with the largest companies by market cap.
— Which stocks are the biggest dividend payers? Find out with the highest dividend paying stocks.
— You can also quickly review the performance, dividend yield and market capitalization for each of the Dow Jones Industrial Average Companies as well as the performance of the Dogs of the Dow.
Subscribe to the Free Chart of the Day
Gold and Silver rebounded following the Fed minutes released last Wednesday. However, one week later both metals are back below pre-Fed levels and moving dangerously close to important support. Silver fell 2% on Tuesday to $15.81/oz, which is only 2.2% above its lowest weekly close of $15.46 which occurred seven months ago. Meanwhile, Gold closed at $1177/oz, which is only $20/oz from its lowest weekly close. In short, precious metals are flashing code red as a breakdown could begin in the next few weeks.
Gold has held in over the past few months but its recent price action suggests trouble is ahead. Take a look at the daily chart below. Gold has failed twice in the past five weeks at its 200-day moving average. First at $1220 and a few days ago at $1207. Gold is now trading below its 50-day and 200-day moving averages and both are sloping down. We highlight the last two times Gold traded below both moving averages. A previous case was in 2015 right before Gold crashed below $1500/oz.

I’m hearing from some that sentiment is too negative and the bear has gone on too long for Gold to breakdown. The problem with that is the data argues otherwise.
We plot a weekly line chart of Gold and we include its volatility index ($GVZ) as well as the net speculative position (bottom). Gold’s volatility peaked above 60 during its 2008 bottom and above 30 at its June 2013 low. At present its near multi-year lows. Meanwhile, the net speculative position which fell to 5% and 6% during 2013 was last at 18%. There are still speculators in the market who can sell and drive Gold lower.

Staying with sentiment, we recently collected all global put-call data for GLD, SLV, GDX and GDXJ. Its another data point we provide to subscribers. We plot Gold and GLD put-call data (smoothed with a 20-day moving average) in the chart below. No indicator is perfect but lows in Gold have corresponded closely with peaks in the 20-dma. The 20-dma has started to rise but remains quite a distance from those previous peaks.

Simply put, the price action in Gold is very bearish and current sentiment (not big picture sentiment) is nowhere near an extreme. This is potentially a very dangerous time for gold and silver bulls. At somepoint (perhaps in a few months), the switch will flip and we could have some epic buying opportunities in the precious metals complex. We are positioned to take advantage of this decline so that we can take advantage of those future opportunities.
Consider learning more about our premium service including our favorite junior miners which we expect to outperform in the second half of 2015.

-
I know Mike is a very solid investor and respect his opinions very much. So if he says pay attention to this or that - I will.
~ Dale G.
-
I've started managing my own investments so view Michael's site as a one-stop shop from which to get information and perspectives.
~ Dave E.
-
Michael offers easy reading, honest, common sense information that anyone can use in a practical manner.
~ der_al.
-
A sane voice in a scrambled investment world.
~ Ed R.
Inside Edge Pro Contributors

Greg Weldon

Josef Schachter

Tyler Bollhorn

Ryan Irvine

Paul Beattie

Martin Straith

Patrick Ceresna

Mark Leibovit

James Thorne

Victor Adair