
Gold & Precious Metals
Third Phase – “The third phase of a bear market is the “throw ‘em in” phase where stocks are sold for no other reason than that the sellers need to raise cash.” – Richard Russell
The Strategy (pt 3)
Over 2 years ago I presented my first analysis of this precious metals bear market. After extensive study of the characteristics of past bear markets , I forecast a brutal bear market that would undergo three psychological stages. The third stage would be a wrenching decline that would ultimately reach levels so shocking that it would cause the destruction of the gold investment class. My analysis, which was dubbed Plunger’s Flush , was met not just with skepticism but outright derision. I believe I know how Galileo felt.
Two years hence , this analysis has proven it’s self . We have now entered into phase III of a bear market, where held at bay for four years the bear will now have its way with the Precious Metals. He will now perform his function of clearing out the accumulated malinvestment built up in the preceding 10 year bull market. At the time I presented my first analysis it was not polite to use the word “Bear Market” as consensus belief still regarded the bull to be active. The market was considered to be in a pullback in an ongoing bull market. Therefore my forecast of a crushing decline was met with universal skepticism and ridicule. Investor sentiment was not prepared to accept the reality that the sun had set on the bull market and a full course bear market lay ahead. My forecast was derived from my study of the process of development of bull and bear markets. I see little understanding of this area among the analysts who populate the gold market sector. Instead fervent believers of the gold narrative seem to dominate the landscape.
As a review, I recommend reading my academic study on major bear markets since these principles apply to our current bear market in the precious metals.
http://goldtadise.com/?p=342366
Also, if you have not read my pieces defining the phases of a bear market I recommend viewing them here:
http://goldtadise.com/?p=342331
http://goldtadise.com/?p=342347
Recent market developments provide full vindication of the bearish forecasts made over the past 2 years. I will now provide an update on the progress of this precious metals bear market and describe the model I use. Below is a big picture view of the past four years and how I have interpreted it.
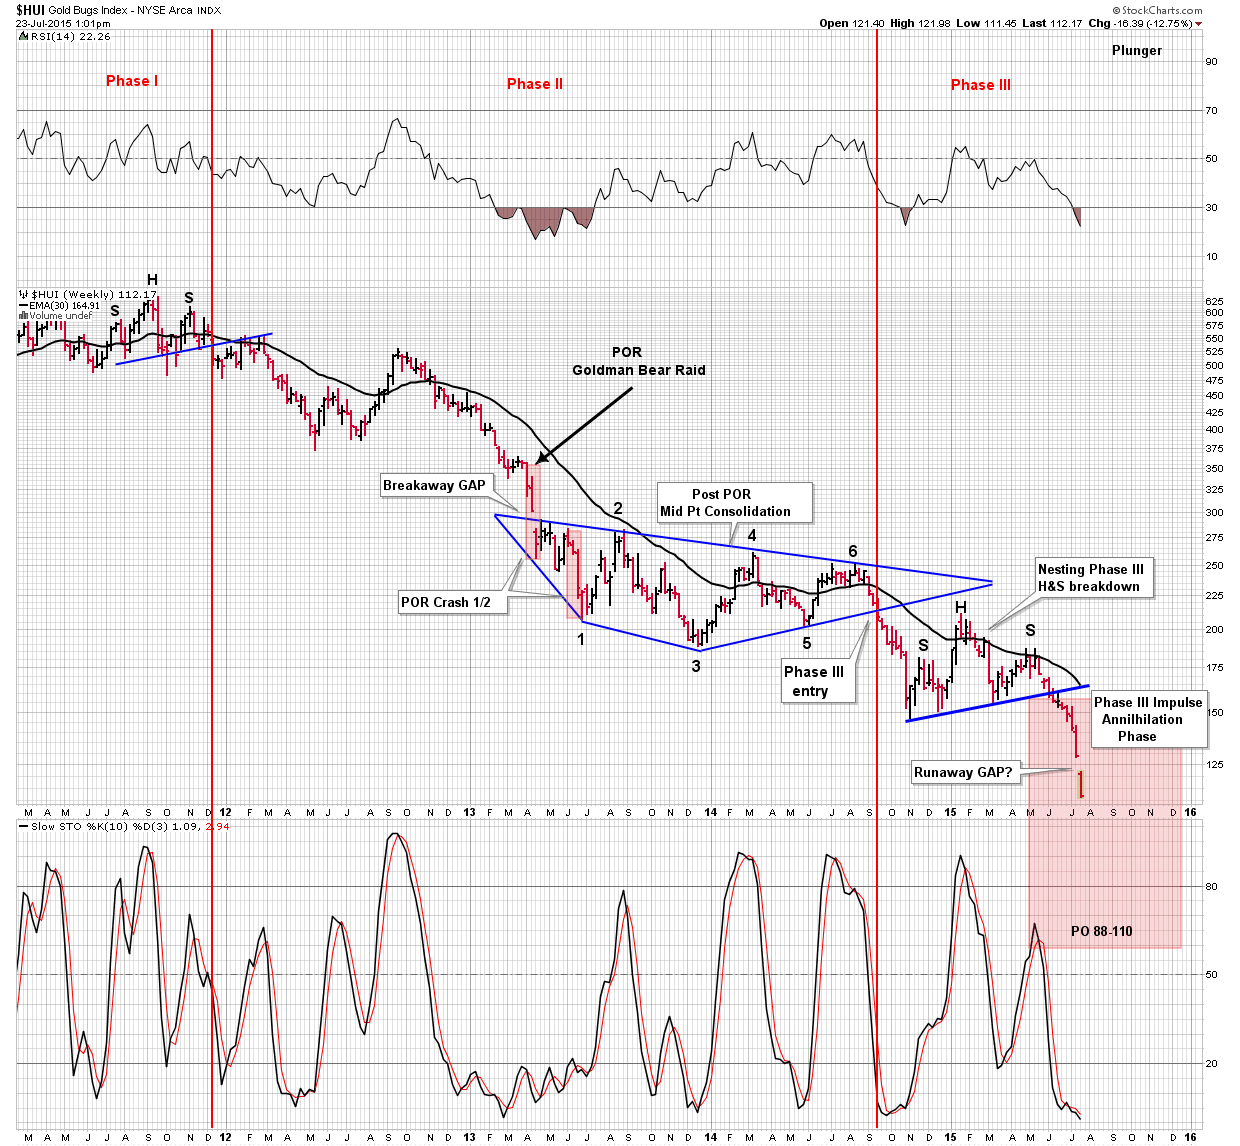
The above chart depicts the major events which define this bear market. It has been classified into three psychological phases which are
defined by the price action. After the phase I distribution top was completed in December 2011 the market entered into a prolonged phase II decline lasting another 2.5 years. Phase II developed in classic form, as once it completed the back test of the neck line of the phase I H&S it entered into a long slide. This slide ended with a sharp bear market rally (BMR) in the summer of 2012. This rally served to reinvigorate the bullish crowd and keep them believing that the bull market was still on and it had all been a corrective move. After the BMR exhausted itself the market entered into a prolonged phase II decline into the spring of 2013. I recall investor psychology at this time as being stressed, yet still optimistic that the bull would resume, the prevailing term used to describe it was “ its a correction”. This all ended with the Goldman raid on the gold market in April 2013. The 19 month slide had eroded investor sentiment to the point that they were now primed for a collective change of perception. With the crash, bullish hopes were now abandoned and it was recognized as a bear market. The classic point of recognition (POR) had arrived. The bear market process places the POR squarely in phase II….Always.
What occurs after the POR is a period of prolonged consolidation. A deceptive tug of war between bulls and bears ensues made up of several BMRs which serve to ultimately exhaust the bulls. Once this process runs its course, the market is now cleared to exit phase II and stocks can now fall of their own weight. This process of bull exhaustion took 18 months when it finally completed its post POR diamond consolidation in October 2014 and entered phase III. The 18 month diamond formation lasted such a long time likely because stubborn gold bulls refused to give up the dream of a bull market, instead expending their energy chasing apparent bear market bottoms. It is interesting to note that the ursa bear of 1932 and the Nikkei bear of 1991 both ended their post POR consolidations with a diamond formation.
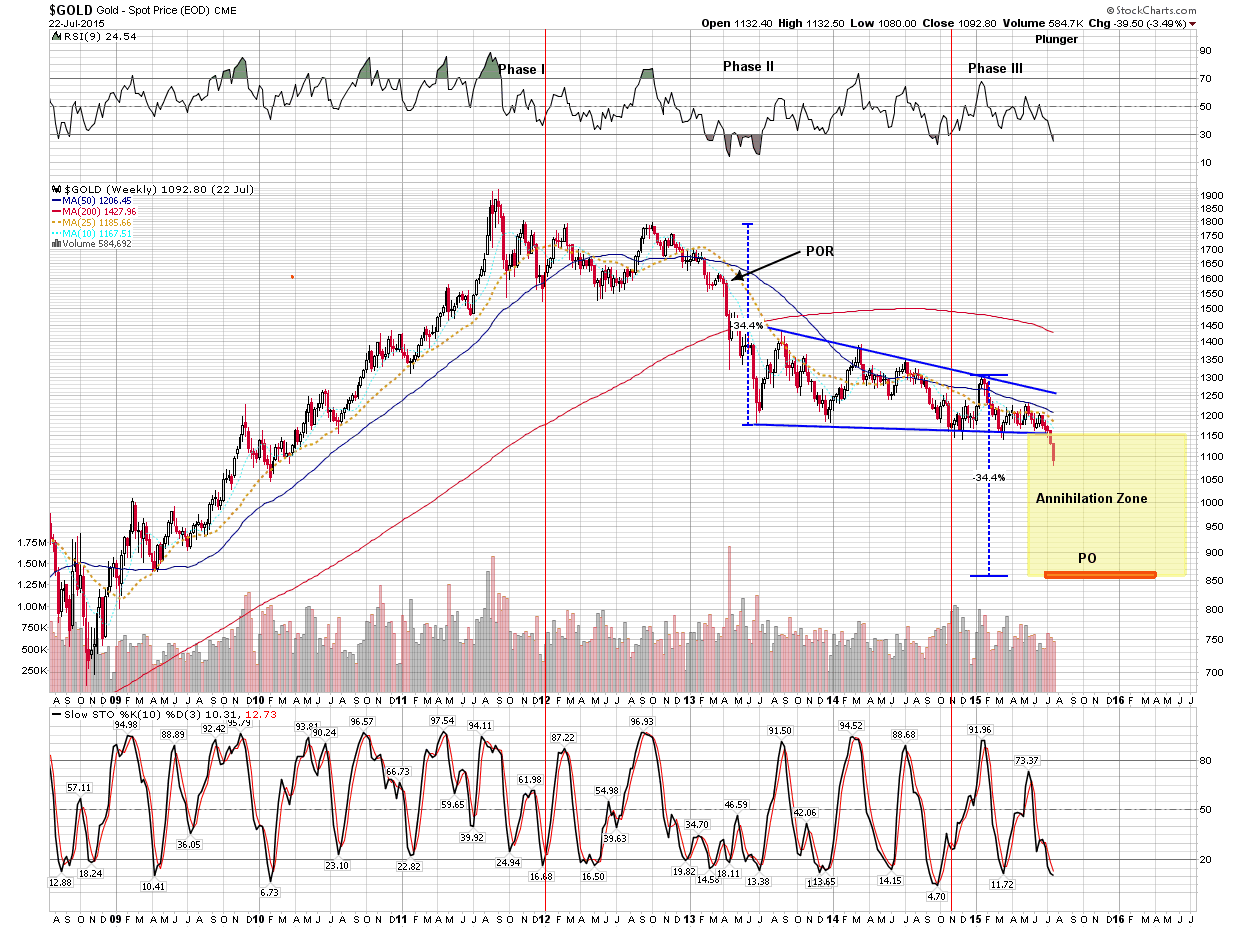
After the diamond formation breakdown of October 2014 the market was now in phase III. By definition when a market breaks down out of its post POR consolidation it then enters phase III. Normally, a downward impulse drives the price to its ultimate bottom and the bear is then over. This bear however, was peculiar because instead of an immediate downward impulse the index chose to go into nesting mode for the next 7 months. During this interval it build out a deceptive H&S pattern just beneath the phase II diamond consolidation pattern. I suspect this was again caused by die hard gold bulls still clinging to hope that a bottom was being formed. Their error was not understanding that all phases of a bear market had not yet completed. In fact, phase III was just getting started and now the end game process is just kicking off. With the June break of the nesting H&S neckline, the phase III downward impulse has finally begun. We are now in the dreaded annihilation phase which I have described in previous essays. The annihilation comes from the markets “no one gets out alive” liquidation.
Over the past four years the bear has been restrained by stubborn bulls. Those bulls are now exhausted and the bear will now have his way with this market. The blind capital of the great unwashed will now be devoured. The bear will end when the worse that can happen has been discounted by the price structure. The junior and mid-tiers have long been destroyed, now the bear will focus on the big cap stocks, where the liquidity remains. Bulls will sell their good stocks held for a rainy day, because it’s raining. It has been rather tragic watching the majority of PM analysts lead there followers to slaughter, because it has been unnecessary. What the majority of investors have not grasped is that a bear market is a process. A process that must progress through various stages of price action and investor psychology. This is what I have attempted to describe over the past two years.
There are several principles at play here. Once a declining market encounters a POR, you know a bear market is active and it’s not just a correction. All calls for a bottom are now invalid until the market enters into an identifiable phase III. Bull signals are now only valid in a phase III. Once in phase III, the market will undergo a cathartic selling event and volume will then begin to recede on subsequent declines. Prior to this any attempt at a bottom will fail and prove to be false until this process completes. So now we wait and observe the bear do his destructive work. We will watch the language of the market to identify its ultimate bottom. Serious money is made identifying the probability of a bear market low, not by buying apparent bear market bottoms.
The bear has not yet finished his work, the ultimate bottom will prove to be so shocking that it will devastate a generation of old school gold bulls. But, it will allow the foundation for the next bull market in the precious metals. This will be my final essay devoted to the great precious metals bear market. We have fought the good fight, we have survived four years of decline, we have properly identified the trends and market phases. We have been wise enough to know when to step aside. We have arrived near the bottom with both emotional and physical capital intact. We will be there to deploy at the bottom. It is time for us to focus on the upcoming epic bull market that will soon unfold in the usual deceptive manner . Join me and other like minded PM Traders at Rambus Chartology for the ride.
Plunger

 VANCOUVER, Canada – When we woke up in the morning, the TransCanada had already heaved itself over the highest point in the Rockies.
Gone were the dense forests of the East. Gone were the wide-open spaces of Saskatchewan and Alberta. We were in British Columbia – rolling downhill, following the gray-green river downstream, through boiling canyons and lazy flats…
Does any country have more bountiful natural resources than Canada?
Timber, food, cattle, minerals, water – Canadians have it all.
Too bad: When it comes to prosperity, there are few things as dangerous as inheriting money or having abundant natural resources.
Gagging on Oil
Rather than making or inventing things… or providing useful services… a resource-rich economy tends to sell itself – by the ton.
When commodities boom, the miners, farmers, and lumberjacks live high on the hog. But when they fall – the economy falls with them.
Canada’s economic growth was negative in the first quarter. The country is the world’s tenth largest exporter of crude oil. And oil is in its worst downturn in 30 years, according to Morgan Stanley.
The U.S. oil price has dipped below $50 a barrel. Along with it, the entire commodity complex – upon which much of the economy of Canada depends – could be dragged further down too.
Why?
Even more dangerous than resource abundance is economic “guidance” from the feds.
First, Alan Greenspan kept rates too low after the mini-recession of 2001. Then the Bernanke Fed pushed them down to near zero and kept them there for the last six years. And now Janet Yellen is steering the same course.
The cheap credit gave resource producers the means to overproduce and consumers the wherewithal to over consume.
At such a low cost of borrowing, producers could earn positive cash flow without regard to real economic results. And with the Fed’s rate fixing falsifying the cost of capital, they didn’t know if they were really making money or not.
So, they produced so much oil the world gagged on it.
Commodities Give Way
But now the bottom has given way under the resource market. (Scroll down to Market Insight for more…)
BHP Billiton, the world’s largest mining company by reserves, has slashed production…
…Caterpillar – which pushes lifts and carries resources all over the world – has seen sales falling for 31 months in a row…
…Chesapeake Energy – the tenth largest oil producer and second largest natural gas producer in the U.S. – has cut its dividend to preserve cash, as shares fell to a 12-year low…
…and Kumba Iron Ore, Africa’s largest iron ore producer, has eliminated its dividend after announcing that profits had crashed 66% in the first half of the year.
None of this is good news for Canada’s commodity-based economy.
But there’s something else going on here…
Life in Canada’s cities is different from the countryside. An influx of immigrants, mostly from Asia, has boosted the energy and wealth of Toronto, Vancouver, and other large urban areas.
They seem more prosperous and dynamic than the large metropolises of the U.S. For the most part, property prices are higher in Canada, too – especially in Vancouver – where they may be more a product of foreign buying than of local industry.
Outside the cities, though, you might just as well be in West Virginia, Oklahoma, or Alabama. There is little evidence of wealth or style.
Along the tracks of the TransCanada, our only reference, houses are modest – even shabby.
Neither agriculture nor forestry appears to have ever produced much profit for Canada’s heartland.
Particularly disappointing is the domestic architecture. A dear reader sent a photo (see today’s Mailbag below) of a house he had built with his own hands – of stone and logs. It is a gem. But it is unusual.
Whether you are in the outer suburbs of Toronto… or out on the plains of Alberta… the style is the same: boxy, boring, and cheap.
Pricey Property
But when we rolled into Vancouver, all of a sudden, things changed.
We saw money. There are high-rise condos everywhere. Chic people. Expensive shops. Crowded restaurants.
A few years ago, a bust in the mining sector would have emptied the restaurants. Today, the waiters keep serving drinks despite the smashup in the resource sector.
Back in the old days, a collapse in mining meant that brokers, promoters, and mining entrepreneurs – not to mention the stockholders – had to move fast to raise cash.
Their fancy cars went back to the dealers, and real estate agents put up “For Sale” signs in front of their handsome houses!
No evidence of that now.
Compared to incomes, Vancouver has the second most expensive houses in the world. Only Hong Kong has less affordable real estate.
Advice to Canadian readers: Sell.
Postscript: After four days on the rails, the TransCanada eased into Vancouver station. Luggage was off-loaded. Cabin stewards were thanked. We had become friendly with our travel companions and embraced them warmly as we headed in our separate directions.
We don’t know if we’d do it again, but it was a pleasure doing it once. Canada is a magnificent country. We were glad we got a chance to see it.
We took photos… Scroll to the end and have a look.
Regards,
Bill

This week, I ran the Abnormal Breaks US scan in search of stocks that came to life after the market has shown little interest in them for some time. A few stocks showed what I call a Bottom Fishing pattern. These occur when a stock that has been in a downward trend for some time breaks higher from a rising bottom after breaking the long term downward trend.
1. VTR
VTR broke higher from a rising bottom on Friday and closed near its high on a day when the overall market was being sold aggressively. Although this stock is still below the very long term downward trend line, it looks like it could make a tradeable short term move higher.

2. LSTR
LSTR has suffered since the end of 2014 but has started to show signs that it wants to resume the long term upward trend. The Sentiment Stockscore has risen back above 60 as the buyers start to show optimism for the stock again.

For Tyler’s whole Newsletter for this week at this link: Don’t See What You Want to See

“the price of oil is more heavily influenced by world events, declining oil fields, and financial crises”

 Last week, Europe hurriedly offered Greece a new bailout deal … the Greek parliament rushed to pass new Draconian reform laws … the German parliament did the same … and the ECB promptly dished out more money to keep the country’s banks afloat.
Nearly everyone — lenders, borrowers and politicians — did exactly what they vowed never to do.
Why?
Most people think it’s because they want to defend the euro at all costs. True.
But there’s more to all this than meets the eye: There are hidden time bombs that are driving all players down the same old path of more bailouts and debt pile-ups.
These hidden time bombs have a name: Derivatives.
And they have a number: $630.1 trillion.
That’s right. According to the Bank of International Statistics, at yearend last year, the world’s total notional value of derivatives traded over the counter (outside of organized exchanges) was $630.1 trillion.
That’s about eight times the gross domestic product of the entire planet.
It’s nearly 47 times the total amount of mortgages outstanding in the United States.
And it’s over 34 times greater than the already-huge U.S. national debt.
So here’s the hidden timebomb story in a nutshell:
1. Derivatives are high-risk bets that are extremely vulnerable to unique events like a collapse of the euro.
2. Major European banks, especially in France, the UK and Germany, hold huge amounts.
3. Because they’re so vulnerable, they feared a Greek exit from the euro could have hit them much like the failure of Lehman Brothers struck U.S. and European banks in 2008.
4. There was no way in heck they’d be willing to take that risk. So they pushed forward with a Greek rescue even though it was totally contrary to everything they believed and even in direct conflict with everything many were saying in public.
Remember: Derivatives are side bets made mostly with borrowed money. They are bets on foreign currencies (like the euro), bets on interest rates, bets on corporate failures, even bets on bets. The bets are placed by banks with each other, banks with brokerage firms, brokers with hedge funds, and hedge funds with banks, just to name a few.
They are often high-risk. And as I just showed you, they’re huge.
Defenders of derivatives claim that these giant numbers overstate the risk. And indeed, most professional players do hedge their bets. But that’s just one side of the risk.
More Dangerous Than Any Casino
To better understand how this works, consider a gambler who goes to Las Vegas. He wants to try his luck on the roulette wheel, but he also wants to play it safe.
So, instead of betting on a few random numbers, he places some bets on red, some on black, or some on even and some on odd. He rarely wins more than a fraction of what he’s betting, but he rarely loses more than a fraction either. That’s similar to what banks like Citigroup or JPMorgan Chase have done with derivatives, except for three key differences:
Difference #1. They don’t bet against the house. In fact, there is no house to bet against (which is the key to the problem). Instead, they bet against the equivalent of other players around the table.
Difference #2. Although they do balance their bets, they do not necessarily do so with the same player. So going back to the roulette metaphor, if a major bank bets on red against one player, it may bet on black against another player. Overall, its bets may be balanced and hedged. But with each individual betting partner, they’re not balanced at all.
Difference #3. The amounts are huge — thousands of times larger than all the casinos of the world put together.
Plus there’s one similarity with the roulette wheel that implies the greatest risk of all: What if the ball falls on green — the zero or double zero?
Or, in the parlance of financial risk analysis, what if financial institutions are confronted with a “Black Swan” event — one that strikes from out of the blue, that none of the participants anticipated when they originally placed their bets.
In sum, here are the urgent questions that, despite much debate, remain unanswered:
1. What happens if there is an unexpected collapse? (Two prime examples: The Lehman Brothers failure. Or a sudden exit from the euro by Greece and other Eurozone countries.)
2. What happens if that collapse is so severe — or the institutions already so weakened — it drives some of the big players into bankruptcy?
3. Most important, what happens if these bankrupt players can’t pay up on their gambling debts?
The authorities often say that these questions are merely hypothetical and should never be considered seriously. Yet each of these three supposedly “hypothetical” events took place in last debt crisis:
First, we witnessed the unexpected collapse of the biggest credit market in the world’s largest economy — the U.S. mortgage market.
Second, we witnessed the bankruptcy or near-bankruptcy of five key players in the derivatives market — Bear Stearns, Lehman Brothers, Merrill Lynch, Wachovia Bank and Citigroup.
Third, we also got the first answers to the last question in the form of a single statement that hit the international wire services on October 11, 2008 (italics are mine.):
“Intensifying solvency concerns about a number of the largest U.S.-based and European financial institutions have pushed the global financial system to the brink of systemic meltdown.”
This statement was not the random rant of a gloom-and-doomer on the fringe of society. It was the serious, objective assessment announced at a Washington, D.C., press conference by the managing director of the International Monetary Fund (IMF).
He was the highest world authority on this matter. He saw the dangers. And he was not joking. But neither he nor anyone else seemed ready to answer the most burning, urgent questions it raised for millions of savers:
What is a “Systemic Meltdown”?
And How is it Possible?
Here are the answers:
Definition: A systemic meltdown is a chain reaction of failures, forcing a temporary global shutdown of banks and financial markets around the world. Essentially, the global economy comes to a screeching halt, hopefully for just a short period of time.
Likelihood: Unknown. However, the unmistakable implication of the IMF’s statement is that, by October 2008, so many of the world’s largest banks were so close to bankruptcy, the entire banking system was vulnerable to this kind of massive collapse.
And the unmistakable nightmare of European officials today is that the bankruptcy of an entire member nation — Greece — could set off a similar meltdown.
The most immediate cause: None other than the same derivatives I’m talking about here.
But despite abundant talk of reforms, little has changed since 2008. Indeed …
* In the United States, under lobbying pressure from large Wall Street banks, one of the most critical reforms was postponed until late 2017.
* In Europe, even talk of reform has been, at best, subdued by complacency and sidelined by the Greek crisis.
Result: We still have a global banking system that remains, as before, a large, global gambling network without a mechanism to handle failures.
Ironically, even the Mafia knows how to better handle gambling networks to avert systemic meltdowns.
In the numbers racket, for example, players place their bets through a bookie, who in turn is part of an intricate network of bookies. Most of the time, the system works. But if just one big player fails to pay bookie A, that bookie might be forced to renege on bookie B, who, in turn, stiffs bookie C, causing a chain reaction of payment failures.
The bookies go bankrupt. The losers lose. And even the winners get nothing. Worst of all, players counting on winnings from one side of their bets to cover losses in offsetting bets are also wiped out. The whole network crumbles — a systemic meltdown.
To avert this kind of a disaster, the Mafia henchmen know exactly what they have to do, and they do it swiftly: If a gambler fails to pay once, he could find himself with broken bones in a dark alley; twice, and he could wind up in cement boots at the bottom of the East River.
Established stock and commodity exchanges, like the New York Stock Exchange, the Chicago Board of Trade, or the London Stock Exchange, also have strong enforcement mechanisms. Unlike the Mafia, of course, the trading is entirely legal. But, like the Mafia, they fully recognize the dangers of a meltdown and have strict procedures to counter them.
When you want to purchase 100 shares of Microsoft, for example, you never buy directly from the seller. You must always go through a brokerage firm, which, in turn, is a member in good standing of the exchange.
The brokerage firm must keep close tabs on all its customers, and the exchanges keep close track of all their member firms. So if you can’t come up with the money to pay for your shares or put up the needed collateral for broker loans, the broker is required to promptly liquidate your securities, literally kicking you out of the game.
And if the brokerage firm as a whole runs into financial trouble, it meets a similar fate with the exchange — very, very swiftly!
Here’s the key: For the most part, the global derivatives market has no brokerage, no exchange, and no equivalent enforcement mechanism.
In fact, 100% of the $630.1 trillion figure I cited is traded outside of a formal exchange. The market for other derivatives, like options and futures that are traded on organized exchanges is a much smaller — only $64.8 trillion.
Sure, after the 2008 debt crisis, there was a lot of talk about moving some of the derivatives to regulated exchanges or equivalent; and some initial steps were taken in that direction.
But the proportion of regulated derivatives has actually gone down when compared to the period prior to the debt crisis:
In the U.S., for example, U.S. Comptroller of the Currency (OCC) reports that, on June 30, 2007, 6.5% of derivatives held by U.S. banks were traded under regulated exchanges. But here we are, nearly eight years later, and only 4.5% are traded on exchanges. They have obviously not fixed the problem. It’s actually gotten worse.
Moreover, the data compiled by the OCC and BIS indicate that the bets are still so large and the gambling is still so far beyond the reach of regulators, all it would take is the bankruptcy of a relatively less important player — such as another Lehman Brothers or a small sovereign country like Greece — to throw the world’s credit markets into paralysis.
That’s why the world’s highest banking officials were so panicked when Lehman Brothers failed in the fall of 2008. And that’s also the big unspoken reason why Germany and every other country in the E.U. are rushing to bail out Greece.
Which U.S. banks are currently the most exposed? Based on first-quarter 2015 data compiled by the OCC, I can give you two very specific answers:
The first answer is in terms of which banks hold the most derivatives outside of any formal exchange. (See pdf page 26 of the OCC report.)
- Bank of America NA holds a total of $36.7 trillion in derivative bets, with 93.8% traded outside of any exchange.
- Goldman Sachs Bank USA holds a total of $46.8 trillion in derivatives, with 94.4% traded outside of an exchange.
- Citibank NA, the primary banking unit of Citigroup, has $56.3 trillion in derivative bets, with 97.5% of those bets outside the purview of any exchange — all direct, one-on-one bets with Citibank’s trading partners.
- JPMorgan Chase is, by far, the biggest of them all, towering over the U.S. derivatives market with nearly double Bank of America’s book of bets — $63.7 trillion worth, with 95.6% traded outside of any exchange.
Which U.S. banks have the biggest exposure to any failures by their many gambling buddies (counterparties)? That takes me to …
The second answer — about concentration of risk. Just these top four derivatives players — B of A, Goldman, Citi and JPMorgan — control nearly $203.5 trillion, or 92% of all derivatives held in the U.S. banking system.
And the largest 25 U.S. banks control 99.8%. Can you believe that? It means that all told, the thousands of other regional, mid-sized and small banks in this country control a meager one-fifth of one percent of the derivatives.
This is an oligopoly unlike any other in the financial world — one that ties the fate of the U.S. economy to these firms’ stability far beyond anything ever witnessed in prior centuries.
Just four banks! Making bets of unknown nature and risk! Involving a notional dollar amount equivalent to nearly 14 years of the total production of the entire U.S. economy!
In contrast, Lehman Brothers, whose failure caused such a large earthquake in the global financial system, was actually smaller by comparison — with “only” $7.1 trillion in derivatives.
And if you think that’s bad, remember that the derivative exposure of European banks is even greater.
The Consequences
For now, this means that some the world’s smartest political and financial leaders will continue to make some of history’s most stupid mistakes — printing more money, bailing out more sick debtors and kicking the can down the road for as long as they can get away with it.
It also means that the debt crisis will be perpetuated, continually resurfacing and continually driving flight capital from the world’s highest risk regions to countries perceived as safer havens, especially the United States.
Most important, however, the moral of this story for investors is extreme caution. Invest only in the very best and dump the rest. Keep plenty of cash on hand. And stay alert to the dangers.
Good luck and God bless!
Martin
About Martin D. Weiss Ph.D
Martin D. Weiss is one of the nation’s leading providers of a wide range of investment information. He is chairman of The Weiss Group, Inc. which consists of four separate corporations, including Weiss Research, Inc., the publisher of the Safe Money. This investment news is brought to you by Money and Markets. Money and Markets is a free daily investment newsletter from Martin D. Weiss and Weiss Research analysts offering the latest investing news and financial insights for the stock market, including tips and advice on investing in gold, energy and oil. Dr. Weiss is a leader in the fields of investing, interest rates, financial safety and economic forecasting. To view archives or subscribe, visit http://www.moneyandmarkets.com. – See more at: http://www.swingtradingdaily.com/2015/07/20/hidden-time-bombs-behind-greece-bailout/?utm_source=feedburner&utm_medium=feed&utm_campaign=Feed%3A+swingtradingdaily%2FhfnE+%28Swing+Trading+%C2%BB+Stocks%29#sthash.OM7iCoKA.dpuf


-
I know Mike is a very solid investor and respect his opinions very much. So if he says pay attention to this or that - I will.
~ Dale G.
-
I've started managing my own investments so view Michael's site as a one-stop shop from which to get information and perspectives.
~ Dave E.
-
Michael offers easy reading, honest, common sense information that anyone can use in a practical manner.
~ der_al.
-
A sane voice in a scrambled investment world.
~ Ed R.
Inside Edge Pro Contributors

Greg Weldon

Josef Schachter

Tyler Bollhorn

Ryan Irvine

Paul Beattie

Martin Straith

Patrick Ceresna

Mark Leibovit

James Thorne

Victor Adair