
Stocks & Equities
Fed funds futures are coming around to the idea of no September rate hike, a position we long held since last December based on the argument that inflation in 2015 will move further below the Fed’s mandate, to the extent that the tightening in labour markets is inadequate to stir up inflationary pressures.
The negative trifecta of: i) slowing China; ii) strengthening US dollar; and iii) rising oil supplies has unleashed a negative feedback loop of accelerating descent in oil prices, gloomy climate for emerging market’s exports to China and broadening cuts in capex from energy gains dwarfing any savings to US consumers from lower prices at the tank.
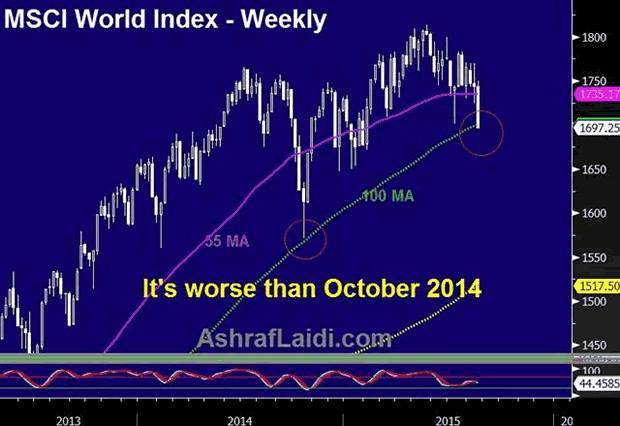
Why it’s worse than the October 2014 sell-off?
Nearing Disinflation
Most market and survey-based measures of US inflation are lower than in October 2014. Unlike survey-based inflation measures, which are provided monthly, break-even rates priced off US inflation-protected bonds are available daily, with the 2-year BE tumbling near 7-month lows at 0.24% and 5-year BE rates at 1.2%, the lowest since 2010. Is the Fed being inadequately taking notice of falling oil prices? This WILL change in the September meeting and the first hint of which will be seen in next weekend’s speech by Fed governor Stanley Fischer at the Jackson Hole conference.
Greater USD Backlash
Since October, the USD has gained an additional 12% against most major currencies, exacerbating the currency translation effect for US multinationals and increasing the price for US exports in the global market place. Surging costs of USD-denominated loans are also punishing emerging markets, especially in Asia. More than $900 bln in USD-denominated debt remain unpaid in corporate China.
No Extra BoJ, ECB Magic
Two weeks after global yields and share prices plummeted in midOctober, the Bank of Japan surprised the world with a rare split 5-4 decision in its policy board to accelerate the monthly purchases of Japanese government bonds so that its holdings increase at an annual pace of 80 trillion yen.
Two weeks later, the European Central Bank signalled to markets that quantitative easing and negative interest rates would finally be pursued.
Markets’ reaction to these events was a 2-month rally in global shares, which eventually stalled in January 2015 as the New Year gave its first hint of impending deflation.
China Devaluation = Antithesis of ECB, BoJ QEs
China today is far weaker than it has ever been over the last 15 years. Most services and manufacturing surveys indicate a contraction, while exports have declined for the 5th month over the last seven months, driving down currency reserves to two-year lows. Tying the yuan to the rising USD has worsened the situation since October.
This month’s CNY devaluation may be a stimulus for China, but its impact on the rest of the world is the antithesis of QEs from the BoC and ECB.
We raised the target on our EURUSD longs from Jul 30 (pre-NFP) as the unwinding of EUR shorts has yet to extend once a 2015 rate hike is completely shut out of the market. The euro unwinding is partly joined by further losses in the Eurostoxx and the Dax, with 9,970 and 1,830 targets cemented for the Dax-30 and S&P500.

Stock Markets
We should review the items that kept us positive on the senior indexes. Actually, they are bull-market-ending events that have a lag. We’ve called them “Friends of the bull market”, which have had a brief shelf life. Both peaked in April. One was the long uptrend in the Advance/Decline line and the other was the peak in NYSE margin debt. The high in the senior indexes would be expected a few months later. Late August to early September has been our target.
This time window is supported by Shanghai’s massive blow-out accomplished in June. Historically that suggested a NY high in early September.
Considering the mounting financial pressures, will the senior indexes reach new highs?
Doesn’t matter to much as the positive time window will come and fail. Our advice has been to sell the rallies.
The line about canaries dropping like flies is a good one. At the peak of previous bull markets we have crafted some lines:
“Every bull market carries its own china shop.”
“Every bull market climbs a wall of worry and in a rush of confidence leaps over, only to find Murphy waiting.”
“Like great civilizations, bull markets are born stoic and die epicurean.”
Conditions were very stoic in the first part of 2009. Now, a contractor in LA is building a spec house hoping to sell it for $500 million. The master bedroom is 5,000 square feet.
Precious Metals
Our July 23rd edition noted that “the plunge in gold and gold stocks was generating Daily Downside Capitulations”. This was updated in the July 27th ChartWorks and the advice was that a brief trade was possible.
Gold increased from the 1080 level to 1125. HUI has rallied from 104 to 124.
Silver rose from 14.35 to 15.95 today, as SIL (silver miners) rallied from 6.32 to 7.44.
Of interest is that silver has reached its 50-Day ma. If it can’t get through and hold it it would be concerning. The concern is that credit markets have taken a turn for the worse. Under such conditions silver usually underperforms gold.
The gold/silver ratio has declined from 77 in early July to 72 and is behind the actual widening of credit spreads. It should soon turn up.
Our focus is that as general liquidity diminishes, the investment demand for gold’s unique liquidity will increase. The price in US dollars could remain steady.
In the meantime, gold’s price relative to commodities has been rising since May and as it extends it will eventually be constructive for the sector.
The last slump drove the Weekly RSI on HUI down to 21 a couple of weeks ago, which was enough to pop the rally.
However, most gold and silver stocks will be vulnerable to extended declines in the general stock markets.
Global Blow Out Hits NY
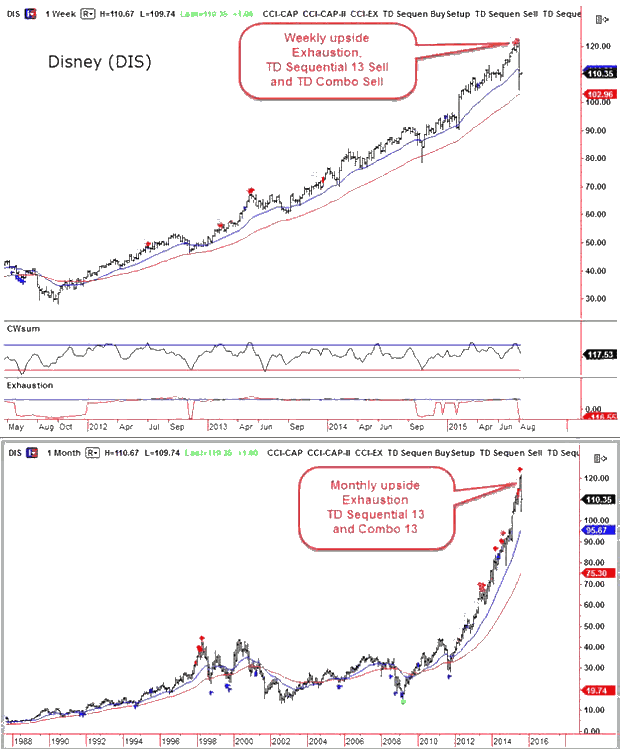
- Technical excesses seen with the completion of the Shanghai Bubble have hit Disney.
- The initial plunge ended just above the 200-Day ma. It took almost 4 weeks.
- It took Disney two days to accomplish a lesser but still dramatic break.
- Whether in Shanghai or in New York intense speculation has similar characteristics.
- Intense speculation and its conclusion is fungible.
ink to August 15, 2015 Bob Hoye interview on TalkDigitalNetwork.com:http://talkdigitalnetwork.com/2015/08/high-grade-corporate-bonds-good-short-term-bet/
Listen to the Bob Hoye Podcast every Friday afternoon at TalkDigitalNetwork.com

 On the heels of the Shanghai stock market plunging another 3.5%, today one of the greats in the business sent King World News a fantastic piece that warns about the chaos in China, oil and the currency markets. Also included is a fascinating chart of gold and oil.
King World News: One of the legends in the business has a key note below, but first let’s take a look at an extremely important chart. The chart below shows that the gold vs crude oil ratio has now broken out to nearly a 30-year high! (see chart and more analysis HERE)
Many have written about the devaluation of the Chinese currency last week, in particular its causes and consequences.
In mainstream media, most opinions are centered around the weakness of the Chinese economy which is now growing less than 7%. Logically, they argue, China wants to stimulate exports and stabilize the currency by ‘de-pegging’ it from a strengthening dollar.
The alternative media basically is focused on a new phase in the currency war, the aim to control capital outflows, and, obviously, the wish of China to enter the IMF’s based SDR currency system (for which a free market currency is a prerequisite).
While all that could be true, we believe there is something much more important going on. Something that truly everyone is missing.
We believe there is reasonable chance that China kicked off the bull market in gold!
How? Very simple. China ‘de-pegged’ in a way its currency from the dollar. Make no mistake, this is a HUGE event. The second biggest economy in the world, which is on its way to become THE biggest economy worldwide, did say ‘goodbye’ to the dollar reserve currency. Because of that, it is now more than ever relying on its ‘real’ monetary reserve, i.e. GOLD.
To make that point, you have to look at the big picture. China is a country focused on the very long term. In order to understand their standpoint, you need to take a similar view. The chart below (courtesy of Sharelynx) illustrates the very long term plan of China when it comes to their currency. Any coincidence their gold reserves started to grow exponentially since the great financial crash?

You can look at it from another point of view as well. September 2011 was the top of the gold price. Coincidentally, it was also the month in which the Swiss National Bank pegged its currency (the Swiss Franc) to the Euro. The Swiss Franc, being a safe haven currency, was rising too much too fast … until the monetary planners of this world decided to stop that trend. Gold stopped rising in the same month.

Last week, China did the exactly opposite of what Switzerland did in September 2011. And we believe gold will not be immune to this event in currency land.
It is clear that China is working towards a gold standard, although they are taking it very slowly.
These are important signals for secular investors. In our mind, it is another confirmation that precious metals are here to stay, contrary to the mainstream thought at present. In other words, a contrarian dream.
Meantime, we observe a significant decrease in selling pressure in the precious metals complex lately.
The gold market is giving us enough signals that it is bottoming, and that the 4-year decline which started in 2011 is a cyclical correction in its secular uptrend.
We have looked at plenty enough evidence in recent weeks that a crash is looming for US markets, and now we are going to take a look at another important piece of evidence that we haven’t previously considered – the Junk Bond market.
When confidence deteriorates Junk Bonds get sold off. A reason for this is that Junk Bond Holders are low on the list of creditors who can expect to be paid off in the event of corporate default, hence the name. They yield more because they carry more risk, so when risk threatens to rise or rises, savvy holders want out.
Thus it is interesting to see that Junk Bonds have just fallen to a 3-year low. This is a leading indicator for the market and it means trouble. We can see what has happened on the charts for the SPDR Barclays High Yield Bond ETF, code JNK, shown below. If you can’t tell that this is a Junk Bond ETF from the name, you sure can from the code. They have gone into a persistent downtrend from the start of June as we can see on the 1-year chart, which has already taken them to a 3-year low, as can be seen on the 8-year chart. We are using Bigcharts charts here because Stockcharts appear to be carrying inaccurate data, and two 1-year charts are shown, with one showing volume and On-balance Volume, and the other showing a comparison with the S&P500 index, and two 8-year charts.


-
I know Mike is a very solid investor and respect his opinions very much. So if he says pay attention to this or that - I will.
~ Dale G.
-
I've started managing my own investments so view Michael's site as a one-stop shop from which to get information and perspectives.
~ Dave E.
-
Michael offers easy reading, honest, common sense information that anyone can use in a practical manner.
~ der_al.
-
A sane voice in a scrambled investment world.
~ Ed R.
Inside Edge Pro Contributors

Greg Weldon

Josef Schachter

Tyler Bollhorn

Ryan Irvine

Paul Beattie

Martin Straith

Patrick Ceresna

Mark Leibovit

James Thorne

Victor Adair