
Energy & Commodities

Crude oil closed at $45.20 per barrel on Friday, showing that there’s an important recovery under way.
Looking at the chart, we can see that after its latest rally, crude has been left in a bullish trend.
To confirm these bullish signals, we have to see hikes above $46.00-$47.00, surpassing last week’s highs and the 38.2% of fibonacci signal of the entire last selloff. With a break above that resistance level, we will see a further progress toward $50-$53, attacking medium-term resistance.
Overcoming such obstacles is required to confirm a further recovery, pointing toward higher areas of $62.60.
If there is a bearish attempt, we will see crude oil find support at $ 42.50, or potentially at $ 40.80.
With a direct fall to below $37.75, the mentioned bullish signals can be disregarded and we will see a continuation of the bearish movement toward $36, and even more depressed values in the coming weeks.
below is a 30 minute price chart, both courtesy of Futures Charts


For the past 15 – 40 years, debt and prices in most markets have moved upward, broadly speaking, in exponential trends. See the following log-scale graphs.
US T-Bonds: T-Bonds have been rallying in their bull market since the early 1980’s. Will they continue, correct, or crash? Doug Noland says it is “The Beginning of the Great Global Unwind.” See chart.
“I really fear for the unwind of the ‘global government finance Bubble’ – the grand finale of a multi-decade period of serial bubbles. It’s history’s first systemic global Bubble, encompassing the world’s Credit systems, securities markets and monetary systems more generally.”

Corn: Since the late 1990s corn prices have increased in an erratic exponential pattern. Corn prices are currently way below trend. Deflationary forces push it downward but devaluation of currencies will push it upward.

Dr. Copper: It has the same basic pattern as corn and sugar (not shown).

Silver: Silver prices increased exponentially since 2001, peaked in April 2011 at more than double the exponential trend price (as drawn), and crashed to about half the exponential trend price.

The Message from the Markets:
Paper markets such as T-Bonds and the S&P 500 have been levitated by central bank “money printing,” government support, and the inevitable devaluation of fiat currencies built into the structure of the financial system. Paper markets move higher – exponentially – as currencies devalue and reset or crash to lower levels, and then repeat.
“Buy for the long term” works if you buy the lows and lighten up at the highs. Few people succeed. NOW is NOT the time to buy most stocks, while NOW is the time to buy silver and gold. However, few people will transfer their digital currencies into physical metal, and most will regret not doing so.
Commodity markets increase in price due to the same devaluation of currencies that propels paper markets higher. They also fall when global economies weaken, or when countries manipulate commodity prices lower (e.g. crude oil) to damage the economies of enemies. These tactics have been used for decades – and will continue to be used by global governments.
But people and economies need commodities such as silver, copper, crude oil, and sugar. Devaluations, manipulations, supply, demand, taxes, HFTers, and government legislation can push prices far higher and lower for years. Perhaps some commodity prices will stay low for a while longer, but remember:
- Central banks heavily influence the supply of money and will inflate their currencies. The exponential increases in prices will continue unless we devolve into a deflationary depression that overwhelms the considerable efforts of central banks to inflate.
- Central banks fear deflationary forces and will inflate and devalue their currencies to avoid deflation.
- Politicians will spend and borrow, and create exponentially increasing debt which increases the money supply and devalues their currencies.
- Silver and gold act like commodities but also as monetary metals. When economies, stock markets, and bond markets become unstable due to excess leverage and overly optimistic valuations (like now), when people, hedge funds, and institutions become fearful, they want real assets, like gold and silver, not debt based paper that can devalue rapidly. A trickle of demand for silver and gold can quickly become a flood based on fear and worry.
GENERAL CONCLUSIONS:
Economic policies that devalue currencies and create inflation … will create inflation. Yes, it is stupid but central banks and governments everywhere use the same flawed thinking. How are those policies working for people in Venezuela, Argentina, and Ukraine today? Is it conceptually different in Greece, Russia, the UK, Japan, or the US?
Silver prices are currently low compared to global debt, CEO bonuses, government spending, official US national debt, the S&P 500 Index, silver prices in 2011, money in circulation, gold prices, military spending, pension underfunding, and the prices of college tuition and health care. Silver prices will increase substantially in the next five years.
If a government subsidizes butter, it will get more butter. The US government, and many others, currently subsidize social welfare spending, food stamps (SNAP), poverty, disability income, corporate welfare, military adventures, dependence upon government, media propaganda, financial corruption, medical expenses, Medicare, congressional corruption, and so much more. Expect more of the same. The consequences of most of the above will directly or indirectly increase silver prices over the next five years.
Thought Experiment: Place a few assets in a virtual time capsule that you will open in the year 2020. Do you want gold coins, silver bars, paper dollar bills, a stock index ETF certificate, a junk bond issued by an insolvent “fracking” company, Apple stock certificates, Venezuela Bolivars, Russian Rubles, junk silver coins, or Hillary 2016 campaign buttons? In 2020 we will recognize that the value of silver coins, silver bars, and gold coins has increased substantially compared to the other options.
Invest and purchase financial insurance, such as silver and gold, accordingly.
Read: Steve St. Angelo: When the Global Silver Shortage Arrives
Deviant Investor: Gold and Exponential Markets Warning
Chris Martinson: Making Sense of the Plunge

 Today a legend in the business cautioned King World News that people should expect even greater chaos and fireworks in world markets in September and October. This piece also warns that this global collapse will be unlike anything in recorded history.
Sorry goldbugs, it is not the gold chart.
There are a lot of opinions out there on the US Dollar. Many of them are bearish in the short medium and long term time frames.
So lets see what the Charts are whispering.
With all the volatility this week in markets around the world the US dollar made an interesting move. The long term daily chart below shows the five point rectangle, at the bottom left hand side of the chart, that launched the big breakout and impulse move higher in May of 2014. If you look at reversal point #5 with a question mark on it you’ll see the comment I made at the time which I noted, this could be a false breakout to the downside and we might see a big move in the opposite direction, which was up. Keep in mind the chart was much bigger back then and the false breakout also looked much bigger. As you can see that indeed was a false breakout to the downside which led to the impulse move up we found ourselves in until the US dollar topped out earlier this year and has been building out the next consolidation pattern.
It’s still not completed yet but the consolidation pattern is taking on the formation of a triangle consolidation pattern. Right now I’m looking at the last dip below the bottom rail of the black triangle consolidation pattern as a possible false breakout which if that turns out to be the case then this triangle consolidation should be finishing up and we should expect a big move in the opposite direction of the false breakout, which would be up. Until the top rail is touched tho this possible fourth reversal point is still under construction with no confirmation yet that the triangle has completed its job of giving the US dollar time to consolidate that big impulse move up.

Below is a daily line chart which shows the three smaller consolidation patterns that made up the last impulse move higher to our most
recent high. Many times you will see at least three smaller consolation patterns form that make up a strong impulse leg. After you see the third small consolidation pattern form you generally know the end is getting near. The daily line chart shows the US dollar has some overhead resistance to contend with in the near term. If the bull’s are really in charge the US dollar will need to take out all the above overhead resistance, moving averages, small neckline and the top rail of the black triangle.

The monthly candlestick chart for the US dollar shows it massive base it broke out of. Note the string of white candlesticks all in a row which shows us how strong that first impulse leg up was. Now look at the candlesticks since the US dollar topped out earlier this year. You can see there are some white and back candles with the price action going nowhere which tells us the US dollar is still consolidating. Remember a big base leads to a big move which the US dollar has.

I have been watching the 40 year monthly chart for the US dollar , since we opened the doors here at Rambus Chartology, http://rambus1.com/?p=11237
This all important chart shows a massive falling wedge with the two big fractal bases, base #1 and base #2. The breakout from big base #1 shows a backtest to the the big base trendline well over a year later but it didn’t alter the inevitable outcome to its bull market top in 2000. Now note the current breakout from big base #2 which was more vertical than big base #1. Instead of getting a backtest to the big base #2 trendline we are getting the backtest to the top rail of the bullish falling wedge which we’ve been following ever since the US dollar broke out above it. The backtest to the top rail of the blue bullish falling wedge has been picture perfect which includes this months bar with a long tail. So far the breakout and backtest is exactly what we wanted to see. Sorry or the late Friday Night Charts. All the best…Rambus


 Most people don’t think about profiting directly from a market decline.
They don’t understand the concept. They don’t know how.
That’s a shame. Because, to help get you through uncertain times, one of the key things you’ll need is money. And to make money, just running for the hills doesn’t work. Your best defense is to go on the offense.
There are also some people who miss this opportunity because they think there’s something cynical or sinister about making good money in bad times.
But the fact is, the more you and others can build wealth … keep it safe … and later reinvest it in worthy enterprises, the better it will be for everyone.
Back in the 1930s, only a very small handful of investors understood this. Only a tiny minority turned the tables on Wall Street and actually transformed the big, three-year market decline into a profit opportunity.
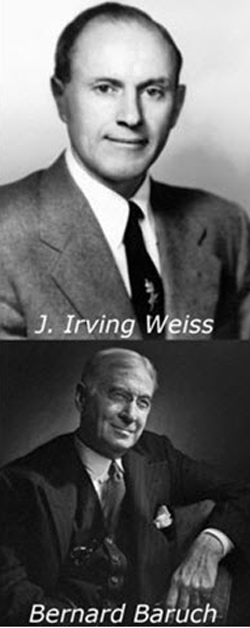
 Bernard Baruch, an adviser to several American presidents, was one of them.
My father, J. Irving Weiss, who later advised Baruch, was another. Initially, the two men didn’t know each other. Yet their approach to the market was remarkably similar.
In our many conversations Dad and I had over the years, here’s how he described his experiences:
“I had gone to work on Wall Street as a typist at the age of 16. I knew very little about the stock market then. But I found it so exciting that I went back in 1929 as a customer’s man (stock broker).
“I traded some stocks for myself and a few clients. When the crash hit, I was as surprised as everyone else by the utter fury of the decline. But my portfolio was clean. Neither I nor any of my clients had one share of stock.
“My good fortune was due to a combination of my family’s poverty and my healthy dose of skepticism. Everywhere, I saw commodities falling. Yet, all around me, investors were going wild over stocks.
“If people bought stocks with their own money, it might have been okay. But they were doing it on margin, with broker loans. These loans, which were normally around a half a billion or a billion dollars, surged to a total of $8 billion in 1929. That was huge in those days. The entire economy was only a bit over $100 billion.
“Overseas, most economies were sinking. Why should Wall Street be any different? I couldn’t understand the discrepancy. I wasn’t about to risk my family’s meager savings on something as uncertain as a surging stock market.
“Then I learned that you can actually profit from a falling market. Instead of buying low and then selling high, you just reverse the transaction. You borrow the stock and sell it. Then, you wait for it to go down and buy it back at lower prices. The more it falls, the bigger your profits. This fascinated me. I wanted to learn more.
 “I also studied the trading strategies of other great traders –men like Jesse Livermore, who built up a fortune trading the market, and Bernard Baruch, who was also making money in the market’s decline.
“Baruch was a quintessential contrarian. He recommended watching the crowd and then doing exactly the opposite. If good news about the stock market shows up on the front page of the paper, sell. That was my approach as well.
“I learned everything I could about selling short. So when the market rallied from November 1929 into early 1930, I was ready.
“With this rally, almost everyone on Wall Street thought we were in a ‘new bull market.’ But I was skeptical. The volume just wasn’t there. Deflation was spreading from commodities to other assets.
“The European markets had not recovered very much, and England was especially weak. When I saw nearly everyone turning bullish again, I just shook my head. I shorted every stock I could lay my hands on that had anything to do with England.
“President Hoover tried to rally businessmen and failed to do so. Still, no one on Wall Street was paying much attention to the sinking business picture. They said the ’29 crash had been a ‘temporary lapse.’
“They believed Hoover. I didn’t. I borrowed $500 from my mother and started to go short the stock market — 100 shares, 200, 300, building it up slowly at first.
“To me, $500 was a lot of money. I grew up in a poor and tough immigrant neighborhood on the Upper East Side of Manhattan. I’d worked two jobs to help support my parents and family ever since I was a teenager. But I was confident because of my indicators.
“The main indicator I watched was the Federal Reserve’s figures on the broker loans of the large New York banks that issued their data weekly. I noticed that, instead of broker loans going up, as they normally would in a recovery, they were going down. This tipped me off that the banks were liquidating stocks.
“I figured the banks represented the smart money in those days, so I followed them. They didn’t have any faith in stocks, so neither did I. As long as they sold, I sold. When they stopped selling, I stopped selling. The other brokers and analysts at the office laughed at me. They thought I was crazy to sell stocks short. But that only made me more confident.
“My other benchmark was foreign currencies, especially the British pound. Britain was still the financial capital of the world. So when the pound fell, it had a direct impact. My brother and I charted the pound daily, and as soon as it broke a key low, we sold short more stocks that were closely tied to the pound’s fate.
“By the time the crash was nearing bottom, I had transformed my mother’s $500 into six figures. She was overjoyed, and so was I.
“But not every trade was a success. Each time the market surged, I lost money, and whenever my losses began to mount, I sweated bullets. With short selling, there’s no limit to how much money you can lose. And when you use margin and borrowed money, like I did, the losses can pile up just as fast as the profits.
“That’s one reason why an even better opportunity is buying the bottom. At the end of the big bear market, we bought GM, AT&T, GE, and Sears for pennies on the dollar.
“The tape barely moved. No more than 350,000 to 400,000 shares of stock were traded that day. That’s less volume than what typically trades in just one large transaction in modern times. Some people thought it was the eye before the next storm. We didn’t. We just kept right on buying.
“The broker looked at us as if we were from another world. ‘How come you guys are buying?’ he asked. ‘You’re the only ones!’
“We didn’t tell him. It was none of his business. By the time the day was out, we had bought thousands of shares of stock for ourselves and for our clients at bargain basement prices. As a matter of fact, they were just about the lowest they had fallen in the entire century.”
Back to the Present
Let me summarize some of the lessons to be learned from my father’s experience:
Lesson #1. There’s a lot of money to be made in falling markets.
Lesson #2. The best time to start doing so is typically (a) after a big drop that breaks the back of the bull market and (b) when you get sharp market rallies, possibly triggered by desperate government efforts to turn the tide.
Lesson #3. Traditional short-selling is too risky for most investors.
Fortunately, however, you can profit from a market decline without selling stocks short and without risking a penny more than you invest.
You can simply buy exchange-traded funds that are specifically designed to profit from falling markets — inverse ETFs.
In fact, with these special-purpose ETFs, you could have the opportunity to earn as much money in a bear market as you’d make in a bull market.
You don’t need a special brokerage account. You can buy them like any stock or other kind of ETF. Your goal is simply to buy low and sell high.
Lesson #4. From an early age, we are taught that “up” is good and “down” is bad. So most people don’t like declines. But that kind of bias has no place in investing strategies. Especially in today’s topsy-turvy world, serious investors should learn how to invest in both up and down markets.
Lesson #5. Bernard Baruch’s axiom to never follow the crowd is especially critical. If you follow the crowd, you could end up buying stocks when investors are the most enthusiastic (at the market’s top) and selling when they are the most downtrodden (at the bottom).
Avoid that trap. Even if Wall Street experts or your own friends deride your approach, don’t let that stop you from making rational, prudent decisions.
Lesson #6. You don’t have to be a seasoned expert to make money in the market. In fact, sometimes, those who are new to the world of investing can see the big picture more clearly than veterans who have been cocooned on Wall Street.
You see that the country is not going down the right path. You see foreign markets sinking. In your heart and mind, all that simply does not jibe with the image of a nonstop bull market.
You feel that major corrections, or worse, are still very possible — even needed to restore reason and a sober recognition of reality.
Lesson #7. Whenever a supposedly “powerful” central bank or government agency — in Washington, London, Brussels, Tokyo or Beijing — makes a new announcement to prop up their stock markets or rescue their economy, you can typically expect bursts of optimism in their stock markets.
But especially in the current environment, that could be very deceptive — one of the worst times to buy stocks or regular ETFs and one of the best times to buy inverse ETFs.
Lesson #8. An excellent indicator that many people ignore is foreign currencies. Back in the 1930s, my father tracked the British pound because it represented the world’s dominant economic empire. When it fell, it signaled continuing trouble for the entire world.
This time, a similar indicator is the U.S. dollar against the Japanese yen. When the U.S. dollar falls against the Japanese yen (expressed as fewer yen needed to buy each dollar), that could be a signal of a decline in the U.S. market.
The reason: As we’ve told you repeatedly, the U.S. market has greatly benefited — and may continue to benefit — from a global flight to quality.
We call it the Global Money Tsunami. And as long as that money continues rushing into U.S. markets, it can boost U.S. share prices.
But when it’s diverted to markets like Japan, considered a competing safe haven, it can have the opposite effect — at least temporarily.
Lesson #9. Do not expect profits all the time. In any kind of investing — in rising or falling markets — losses can and do happen. So be sure to keep plenty of cash in reserve.
Lesson #10. Whether it turns out to be just a correction or a lot more, the more durable profit opportunity comes after the market’s decline.
That’s when you can reinvest the profits you make on inverse ETFS — or just use the cash you’ve stashed away — to pick up the highest quality investments at the lowest prices.
Good luck and God bless!
Martin

-
I know Mike is a very solid investor and respect his opinions very much. So if he says pay attention to this or that - I will.
~ Dale G.
-
I've started managing my own investments so view Michael's site as a one-stop shop from which to get information and perspectives.
~ Dave E.
-
Michael offers easy reading, honest, common sense information that anyone can use in a practical manner.
~ der_al.
-
A sane voice in a scrambled investment world.
~ Ed R.
Inside Edge Pro Contributors

Greg Weldon

Josef Schachter

Tyler Bollhorn

Ryan Irvine

Paul Beattie

Martin Straith

Patrick Ceresna

Mark Leibovit

James Thorne

Victor Adair