
Stocks & Equities
The Fed Has Tried Both Sides
Last Thursday, the Federal Reserve did not raise interest rates. While the “no rate increase” scenario is typically favorable for stocks, the S&P 500 was unable to hold onto the post Fed statement gains. In fact, rather than rising after the Fed statement, the S&P 500 has seen a big drop in recent sessions (see chart below).

Let’s See How The Other Side Looks
In what appears to be a bit of a panic response from the Fed, after Friday’s big selloff in stocks, several Fed officials came forward making the case for increasing interest rates. Did the market cheer the Fed flip? No, the initial reaction was positive, but like last week, the gains were quickly given back (see below).

How Does The Bigger Picture Look?
While markets can begin to improve at any time, the facts we have in hand are not particularly encouraging for stock market bulls. This week’s video shows why stocks may be set up for another big leg down.
Have Things Improved This Week?
After Tuesday’s session, the S&P 500 was down 15 points this week, meaning it is difficult for improvement to occur on weekly charts. If we use the image below to compare the end of the 2011 correction and the 2009 bear market low to the present day, we can see the stock market bulls have some work to do.

If you want to get some insight into the three “looks” above, see Comparing 2015 To Past Market Bottoms
Improvement Can Begin At Anytime
2011 is an excellent example of a vulnerable market that began to improve quickly after a low was made. The charts looked ugly on October 3, 2011, but improved dramatically in the weeks that followed the October 4 intraday reversal. With Janet Yellen speaking Thursday, it is important for us to monitor the charts with a flexible, unbiased, and open mind.

Charles Hugh Smith and Gordon T Long discuss the US Equity Market Technicals. They position the technical charts which they go through in the context of the following primary sources of system risk to the markets:
1. Too much debt globally; public and private debt has skyrocketed since 2008.
2. Mal-investment due to perverse incentives: borrow money for stock buybacks rather than invest in new productive capacity, etc.
3. Stagnant income/revenues: households, companies and nations cannot support more debt
4. The rise of high-frequency trading (HFT) has increased the odds of flash crashes and instability
5. Rising U.S. dollar has triggered capital flight from emerging markets and China
6. China’s economy is grinding to a halt, crushing demand for commodities and commodity-dependent economies
7. Opaque banking: shadow banking in China, dark pools in offshore banking centers, etc. True totals of debt, leverage and quality of collateral are all unknown
8. Deteriorating collateral globally. How many of the 60 million empty “investment” flats in China can be sold for the purchase price? This is just one example of illiquid, impaired assets that are grossly overvalued.

It’s happening again. The amount of margin debt balances at New York Stock Exchange member firms fell to $473,412 billion in August, down 2.9% from September. It is the 2nd consecutive monthly decline and the first back-to-back monthly drop since December-January.
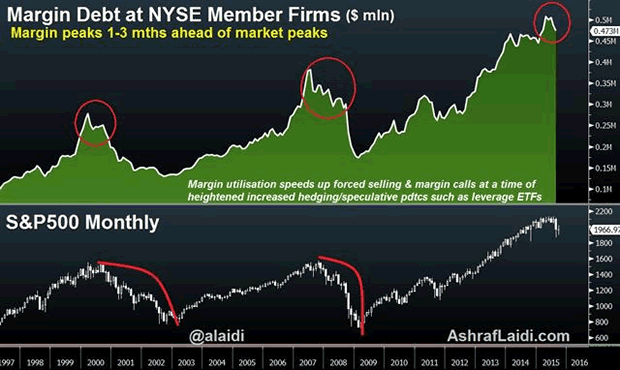
The importance of these figures is highlighted by the historical relationship between peaks in margin debt, and tops in the stock market, typically measured by the S&P500.
Margin calls & forced selling
As markets enter the early stages of a rally, smart money (hedge funds, index funds) usually leads the ascent until it is joined by retail
players to trigger the next buying wave. As the rally sustains itself to higher levels, existing and new payers add on to positons with varying use of leverage (buying on margin). Once markets peak out and/or start to pull back, buyers on margin are obliged to close or pare long positions as margin calls creep in. Clients’ losses at member firms escalate especially as soaring volatility triggers the cascading of stops, prompting further market downside.
The high correlation between margin debt and equities reflects the increasing use of debt in purchasing stocks by institutional and retail investors, shedding important light on the circular loop between price performance and the use of margin debt.
1-3 month lags
July 1998 – The stock market top of July 1998 coincided with the peak in margin debt before the decline was propagated by the EM fallout & LTCM collapse.
March 2000 – The peak in margin debt of March 2000 coincided with the market high in the S&P500 right before the burst of the dotcom bubble, which was intensified by a new generation of margined trading, made easy by online trading.
July 2007 – The peak in margin debt of July 2007 occurred three months prior to the pre-crisis top in the market.
The 1-month lag has reappeared as the latest margin debt figures show leverage has fallen 7% from its April peak — one month prior to the record high in the S&P500 and the Dow.
Margin buying & forced selling
The escalation and subsequent decline in margin debt highlights the risks of speculative stock buying at a time when equities are increasingly vulnerable to contracting earnings growth, slowing global trade, deepening China macro retreat, plunging commodities, falling capex and +$1.5 trillion in cancelled oil projects. The other risk to equities is the back-up of bond yields in an increasingly thin global bond market.
This will not help stock valuations, especially as chest-thumping reminders from Fed hawks fuel the risk of higher yields. And the last thing that’s needed is a bout of forced redemptions from hedge funds and margin calls by retail investors.
How I used margin debt in January 2008 and October 2008 to forecast further damage in equities
Margin debt can best be utilized for continuation patterns during selloffs rather than timing of turning points. On January 2008, margin balance helped me make the case for an additional 25% decline after equities had already fallen by 14% from their peak.
Then in October 2008, as stocks had plunged 25% from their 2007 peak, we remained negative on stocks to the extent of predicting further Fed easing against the prevailing market consensus, which leaned towards US rates reaching a bottom at 2.0%.

Federal Reserve Chair Janet Yellen last week blinked in the face of—as she described it—global uncertainty, low inflation, and a still-low U.S. labor force participation rate. I’ve written on the emerging markets slowdown numerous times in recent months, so her reasoning is not at all surprising.
Although interest rates could still be hiked in one of the two remaining times the Federal Open Market Committee (FOMC) meets this year, 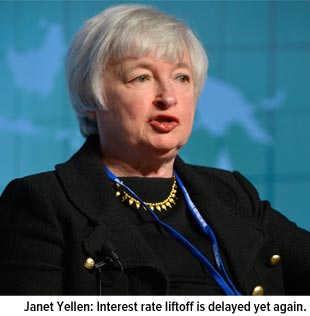 I’m inclined to think they’ll stay near zero until at least 2016.
The decision is a welcome one for both gold demand and new home purchases. When rates rise, gold becomes less attractive for some investors, who are encouraged to exchange their no-yielding gold for income-producing assets.
As for loans on new or existing homes, they don’t necessarily rise and fall in perfect correlation with interest rates—they’re more directly related to the 10-year Treasury bond yield—but there’s a strong psychological connection in many potential homebuyers’ minds.
An interest rate reprieve, then, might encourage borrowers to act before it’s “too late,” helping home sales. This could speed up the multiplier effect, or what occurs when there’s an increase in spending that increases income and consumption greater than the initial amount spent. When people buy a home, they also put carpenters to work, purchase new furniture, hire landscaping companies and more.
The same is true when taxes are lower. It creates less friction in the flow of money.
A Record-Setting Year for Chinese and Indian Gold Demand?
Following Yellen’s announcement, I told JT Long of the Gold Report that the Fed’s decision is a wash for precious metals, oil and gas prices. A rate hike would have likely caused the U.S. dollar to strengthen even further, which in turn would have put additional pressure on commodities.
I’ll be watching China’s purchasing managers’ index (PMI) numbers very closely in October and November to see if manufacturing activity will start to turn up. Since China is such an important consumer of metals and other raw materials, it’s crucial that its manufacturing sector break out of the recent slowdown.
A recent article by Oxford Club Resource Strategist Sean Brodrick points out that China’s gold demand, as tracked by deliveries out of the Shanghai Gold Exchange (SGE), is much healthier than many people believe. So far this year, demand has been 36 percent higher than around the same time in 2014, and 13.5 percent higher than in 2013—which was a record year.

Chinese gold demand also tends to increase near the end of the year as the Chinese New Year approaches, so it’s possible 2015 could hit a new record.
Demand out of India is likewise surging, reaching 120 tonnes in August, compared to 50 tonnes this time last year. With important Indian fall festivals quickly approaching such as Diwali, the gold Love Trade is in full swing.
Homebuilders Feeling Good About the Future

Speaking of love, U.S. homebuilders generally seem to have a rosy feeling about the housing market. According to a new survey by the National Association of Home Builders (NAHB), builder confidence in the market for new single-family homes rose to 62 in September, its highest level since November 2005. A reading over 50 means that builders have a positive attitude about economic conditions.
Driving this sentiment are historically low interest rates, low unemployment and steadily rising rents, which makes purchasing a home more appealing.

Housing starts in August fell for a second straight month, but they remain above the one million-unit mark—1.13 million, to be exact—so demand is still on solid footing. This week, Evercore ISI wrote:
Housing starts have already more than doubled and are clearly improving here in 2015. But they still have lots of room to increase.
What this means is there’s a lot of upside opportunity.

A better indicator of the market might be the number of permits filed for new homes, which ticked up 3.5 percent in August.

We own Masco Corporation, which manufactures products for home improvement and new home construction markets. It’s up more than 23 percent year-to-date, while the S&P Homebuilders Select Industry Index is up nearly 30 percent during the same period.
Big Data: October Is the Best Time to Close on a New Home
The reason for a rise in permits is likely because the fall and winter months have traditionally been perceived as the best time of year to buy a new home, due to less competition from other buyers because of the colder weather.
Real estate information company RealtyTrac wanted to check the validity of this longstanding theory and found it be to mostly accurate. After analyzing 32 million home and condo sales since 2000, the group found that buyers tend to get the best deals during October—just next month—when sales prices were 2.6 percent below market value. And if you want to get really precise, October 8 was the absolute best day to close on a home, “when on average buyers have purchased 10.8 percent below estimated market value at the time of the sale,” according to RealtyTrac.
The worst month to buy a home in was April, when prices were at a 1.2 percent premium.
So the takeaway here is that homebuyers who have been sitting on the fence now have a double-incentive to act: historically low mortgage rates and a possible chance at killer bargains.
Government Policy Is a Precursor to Change
Last week, I discussed how homebuilding is important to money velocity, or the rate at which money is exchanged from one transaction to another. The multiplier effect of the housing market, according to the National Association of Realtors (NAR), is between 1.34 and 1.62 in the first year or two of the initial home purchase. What this means is that for every dollar spent on housing, the overall GDP increases by $1.34 and $1.62.
That’s huge. Not just for GDP growth but also job growth.
Global Construction magazine estimates that an average of 22 subcontractors are involved in the building of a single American home, from carpeting specialists to electricians to plumbers. These are just the subcontractors. The count doesn’t include full-time employees of the homebuilder.
All told, then, many more than 22 people are employed in the construction of each home in the U.S., on average. These professionals create wealth not just for themselves but for others as well.
According to Reuters, construction spending by the U.S. government increased 0.7 percent to a huge $1.08 trillion, the highest level since May 2008. Construction spending has increased for eight straight months, in fact.
This is why we always study government policies, because they’re precursors to change.
It’s why government bond yields spiked in anticipation of the Fed decision. The spike lowered the prices of bonds substantially. Based on our models, the drop in bond prices gave our portfolio managers a buy signal in our Near-Term Tax Free Fund (NEARX), allowing us to pick up some nice bargains in short-term municipal bonds attractive at that level.
While Americans are in the early stages of the presidential election cycle, and the debate stage is still crowded, Canadians will head to the polls in a month to decide the direction of their federal leadership.
I was in Toronto last week where the mood was tense as the effect of falling commodity prices hit the resource-based Canadian economy especially hard and the Canadian dollar was at its lowest level against the almighty American dollar since 2004.
If the Conservative Party remains in power, Prime Minister Stephen Harper will be the first person in more than a century to win four consecutive elections in Canada. It’s also the first three-way toss up in the nation’s history of Parliamentary elections.
Harper has been a reliable champion of commodity investments, small government and lower taxes—policies that I believe contribute to global growth and prosperity over the long term.
Please consider carefully a fund’s investment objectives, risks, charges and expenses. For this and other important information, obtain a fund prospectus by visiting www.usfunds.com or by calling 1-800-US-FUNDS (1-800-873-8637). Read it carefully before investing. Distributed by U.S. Global Brokerage, Inc.
Bond funds are subject to interest-rate risk; their value declines as interest rates rise. Though the Near-Term Tax Free Fund seeks minimal fluctuations in share price, it is subject to the risk that the credit quality of a portfolio holding could decline, as well as risk related to changes in the economic conditions of a state, region or issuer. These risks could cause the fund’s share price to decline. Tax-exempt income is federal income tax free. A portion of this income may be subject to state and local taxes and at times the alternative minimum tax. The Near-Term Tax Free Fund may invest up to 20% of its assets in securities that pay taxable interest. Income or fund distributions attributable to capital gains are usually subject to both state and federal income taxes.
The Purchasing Manager’s Index is an indicator of the economic health of the manufacturing sector. The PMI index is based on five major indicators: new orders, inventory levels, production, supplier deliveries and the employment environment.
The S&P Homebuilders Select Industry Index is a modified equal weight index that represents the homebuilding sub-industry portion of the S&P Total Markets Index.
Fund portfolios are actively managed, and holdings may change daily. Holdings are reported as of the most recent quarter-end. Holdings in the Near-Term Tax Free Fund as a percentage of net assets as of 6/30/2015: Masco Corporation 0.00%.
All opinions expressed and data provided are subject to change without notice. Some of these opinions may not be appropriate to every investor. By clicking the link(s) above, you will be directed to a third-party website(s). U.S. Global Investors does not endorse all information supplied by this/these website(s) and is not responsible for its/their content.


-
I know Mike is a very solid investor and respect his opinions very much. So if he says pay attention to this or that - I will.
~ Dale G.
-
I've started managing my own investments so view Michael's site as a one-stop shop from which to get information and perspectives.
~ Dave E.
-
Michael offers easy reading, honest, common sense information that anyone can use in a practical manner.
~ der_al.
-
A sane voice in a scrambled investment world.
~ Ed R.
Inside Edge Pro Contributors

Greg Weldon

Josef Schachter

Tyler Bollhorn

Ryan Irvine

Paul Beattie

Martin Straith

Patrick Ceresna

Mark Leibovit

James Thorne

Victor Adair