
Bonds & Interest Rates
 Every dictator knows that a continuous state of emergency is the best means to justify tyrannical policies. The trick is to keep the fictitious emergency from breeding so much paranoia that routine activities come to a halt. Many have discovered that its best to make the threat external, intangible and ultimately, unverifiable. In Orwell’s 1984 the preferred mantra was “We’ve always been at war with Eurasia,” even though everyone knew it wasn’t true. In its rate decision this week the Federal Reserve, adopted a similar approach and conjured up an external threat to maintain a policy that is becoming increasingly absurd.

Martin Armstrong’s pivotal September 30, 2015 inflection point is fast approaching. Make sure you watch the powerful documentary The Forecaster – The Martin Armstrong Story beforehand. Use the MoneyTalks special code – MONEYTALKS to get 50% off the streaming video rental price at https://vimeo.com/ondemand/theforecaster

USDCAD Range 1.3015-1.3182
A series of Fed speakers today and over the weekend made hawkish noises and since they were all from the hawkish camp, the noises shouldn’t be unexpected. Nevertheless, they managed to give the US dollar a lift across the board with their suggestions that a 2015 rate hike remained a strong possibility.
USDCAD climbed off Friday’s roller-coaster ride and traded sideways throughout the Asia session before edging lower in Europe. Part of the Loonies modest gains can be attributed to a report that Opec is forecasting oil to be at $80.00/bbl by 2020, which is a grasping at straws type of move on a sketchy forecast. But that was Europe. In North America, USDCAD has rallied, despite the WTI bump higher due to general US dollar strength vs. the majors.
Japan is closed until Thursday for various holidays sucking out a ton of liquidity during the Asian time zone. Since the FOMC members pointed to China growth concerns as a recent for standing pat, Chinese PMI data on Wednesday may be a bigger factor for FX
Bank of Canada governor, Stephen Poloz gives a speech in Calgary today which may provide clues as to how the BoC views the risks to the Canadian economy from a global economic slowdown. The text is available at 2:30 pm EDT
Technical Outlook
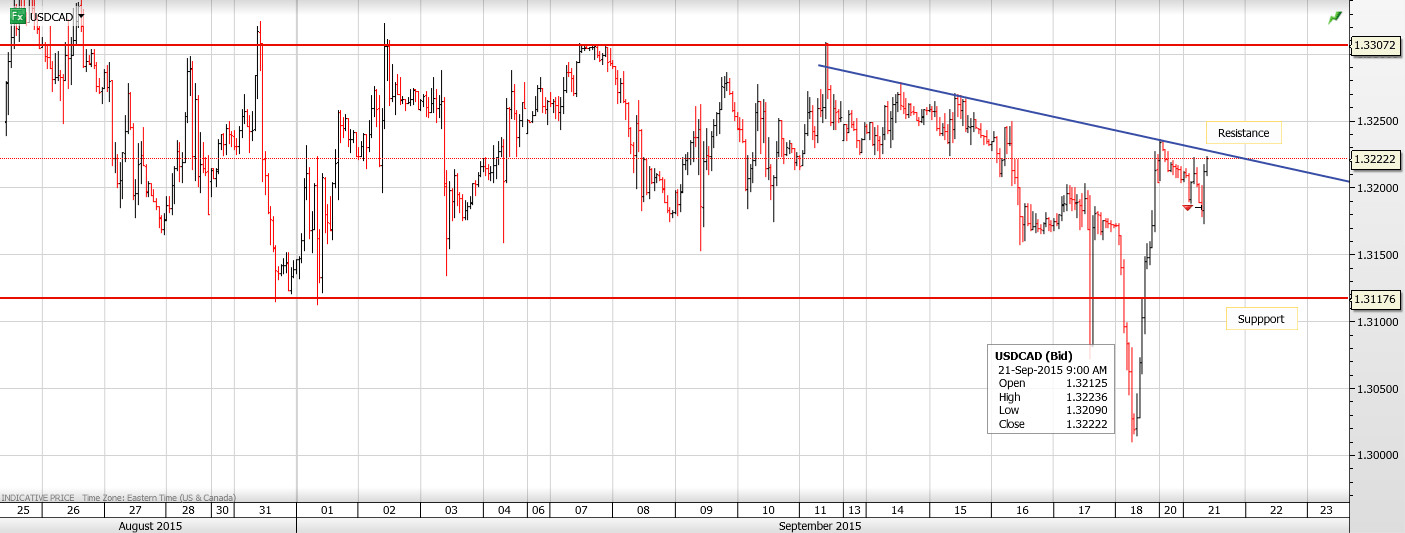
USDCAD continues to churn within the well-defined 1.3000-1.3350 range. There is a minor intraday downtrend which remains intact while trading below 1.3250 that will extend losses to 1.3110 on a break of 1.3180. The post rate cut rally from July ended with a break below 1.3200 last week which should limit the top to 1.3250-70 this week.
Today’s Range 1.3180-1.3250
Chart: USDCAD hourly Larger Chart

Originally published September 19th, 2015.
The market didn’t waste any time “getting on with it” yesterday after the bearish action on the day of the Fed announcement. It fell, and hard. We are going to look at this carefully because what appears to be starting is a devastating “end run around the line” smash – if so a brutal plunge is just around the corner.
A few days back we were a little too accommodating in adjusting the upper boundary of the Pennant shown on the 3-month chart below when the index pushed out of the top of it. We shouldn’t have and on this chart we are going back to our original Pennant boundaries, which is important as it enables us to define where the support is at the apex of the Pennant. As you will recall the upside breakout from the Pennant, on the basis of its original boundaries, was regarded with deep suspicion, and it appears to have been the product of manipulation – Fed buying to “paint the tape”, especially as there was no such breakout in other markets like the London FTSE and Tokyo Nikkei, where a parallel Pennant had formed. If so then they may soon end up with egg on their faces.

Other world market indices such as the Europe STOXX600 shown here, and the London FTSE and the Tokio Nikkei, which have similar bear Flags or Pennants completing, did not confirm the false upside breakout from the Pennant on the US S&P500 index before the Fed announcement…
 Meanwhile, the Transports, which had a surprisingly big recovery rally after the August plunge, are perfectly positioned to drop away hard after failing at downtrend line resistance with a bearish “Shooting Star” and then breaking down from their recovery uptrend…

The market is at a critical juncture because yesterday it dropped to the support at the apex of the Pennant. If this fails – and it is expected to perhaps after a minor bounce – then we will quickly find ourselves in an “end run” smash situation, which is what happens when a Pennant or Triangle breakout fails in this manner. The market should drop away fast, perhaps like a rock, and the downside target for this move is 1730, which it could easily exceed. However, if it doesn’t slice through the support at the August lows in the 1870 area and sticks there we may ditch half of our Puts there for a good profit, and let the rest ride. We’ll see how it looks when it gets there. With respect to nailing the get out point for Puts, the Transports chart shown above is helpful as it gives us a potential downside target at the lower boundary of its expanding downtrend channel.

With the gold and silver markets surging since the Fed’s decision to keep interest rates unchanged, today King World News is pleased to share a piece that illustrates commercial hedgers have become even more bullish on the price of gold. This piece also includes a key illustrations that all KWN readers around the world must see.
Jason Goepfert at SentimenTrader: “The latest Commitments of Traders report showed that large hedgers added the most aggressively to gold…

-
I know Mike is a very solid investor and respect his opinions very much. So if he says pay attention to this or that - I will.
~ Dale G.
-
I've started managing my own investments so view Michael's site as a one-stop shop from which to get information and perspectives.
~ Dave E.
-
Michael offers easy reading, honest, common sense information that anyone can use in a practical manner.
~ der_al.
-
A sane voice in a scrambled investment world.
~ Ed R.
Inside Edge Pro Contributors

Greg Weldon

Josef Schachter

Tyler Bollhorn

Ryan Irvine

Paul Beattie

Martin Straith

Patrick Ceresna

Mark Leibovit

James Thorne

Victor Adair