
Timing & trends
 A lot is being made of remarks from Federal Reserve Chair Janet Yellen earlier this week and the likelihood of the Federal Reserve raising rates as early as December. This is because, all else being equal, the US economy no longer warrants emergency level interest rates. Fridays US jobs report added further evidence to this, and that in fact the lame payroll numbers of August and September look more to be anomalies than a slowdown of the US economy, which was immediately impacted by economic instability in Asia. With the anticipation of action from the US Fed in December, it seems likely to expect a second phase of US dollar strength.
For starters, the global economy is shifting back to a precedent where US financial markets remain the most attractive home for capital on a relative basis. Over the previous couple of months anticipation was that like the Federal Reserve in the US, the Bank of England was ready to adjust rates higher, but policy uncertainty there in the last week has led forecasters to look to the latter half of 2016 for a rate rise. Furthermore, during this current period the global economy finds itself in a similar situation where the US sits alone as the only western central bank with a tightening bias, and is almost akin to September 2014 when the first wave of dollar strength began.
Another cautious sign was revealed in a research note by Bank of America Meryl Lynch earlier last week that money is fleeing
out of Canada at the fastest rate of the 10 major developed economies. The author examines two main factors, and the first is that Canadian investors and money managers are looking to US financial markets for better opportunity. The second is perhaps a more troubling sign that Canadian businesses are merging with or acquiring firms abroad as apart of 73 billion dollar outflow in acquisitions so far this year. Very simply this is money leaving the country because there are better prospects elsewhere. And it is without a doubt that there was anticipated to be a flight of capital from a decrepit energy sector, and it’s resoundingly clear that opportunities domestically are few and far between.
Bank of Nova Scotia estimates the Canadian dollar could go as low as 72 cents by the first quarter of 2016, and that forecast sounds bullish compared to some of the independent forecasters for the loonie. The reality though is that it fits into a scenario where we are about to embark on another phase of weak commodity prices and US dollar strength. That is why in turn Bank of Nova Scotia doesn’t see oil prices recovering until at least the end of 2016. Further to this, CIBC Economics Department wrote a very important note a few months back directed at firms that hedge their foreign exchange risk, and their message was clear. The downside is limited with a loonie that is ‘fair value’ around 78 cents, and it’s not likely we’ll overshoot back into the 80-cent range. Albeit, there’s always reason to be wary of a consensus call, but the evidence for another wave of US dollar strength seems overwhelming.
A final thought is how this theme encompasses precious metals. Gold is currently retesting the August low of 1,085 US per ounce. Further downside would almost be anticipated with a hike in interest rates, but the shallow liquidity of the gold market and its quick readjustments encourage that this news has already been priced in. In less than two weeks the price of gold has given back 90 dollars. Whether support at the 1080 level holds will be the ultimate question, but with the next phase of conversation around the US Fed will not be when they raise rates, but when can they do it again and to what level. My call is for eventually lower gold prices, but the downside will be short-lived.

Premium Snippets:
The CoT’s continue to be a major problem for bulls. In other words, too many speculators remain long Gold and Silver. The chart below shows a breakdown of Gold’s CoT with the positions as a percentage of open interest. Gross longs less gross shorts equals the net position.
While the gross long position should decline quickly, it remains fairly high at 28%. Ultimately, we could see it go below zero. That would entail more spec shorts than spec longs. Gross longs are at 53%. They need to go below 39% (the 14-year low) to signal capitulation. If gross shorts go above the recent high of 47% then spec longs will be net short for the first time in nearly 15 years. (Note that the current figures are as of Tuesday). 
Moving on, here is a look at the weekly candle charts of GDXJ and GDX. The rally of the past few months appears to be a “retest” of the July breakdown. We sketched out how this price action could play out. This looks really bad for bulls. The miners are likely headed to lower lows.

I thought the final decline had begun a few times over the past few years. At present there is far more evidence that it has begun. Precious metals investors need to get their portfolios in order and be extremely careful in the weeks and months to come. The technicals are terrible, sentiment is far from bearish extremes and there is more downside in metals and miners before they reach support or downside targets. This is looking like a dangerous and hazardous environment.
Last week we wrote: This is a time to be very defensive and very careful. It could get a lot worse for Gold and gold stocks before it gets a lot better.
I think our update yesterday (TDG #438) and last week (TDG #437) clarified this for subscribers. That is roughly 60 pages of charts, data and analysis. In TDG #438 we answered some subscriber questions and discussed what fundamentals are driving Gold lower right now and what needs to happen (one of two things) for Gold to turn around in 2016.
Read more about subscription to our premium service

Quotable
What’s past, and what’s to come is strewed with husks
And formless ruin of oblivion
William Shakespeare, Troilus and Cressida
Commentary & Analysis
Latest China export news likely not good for commodity currencies
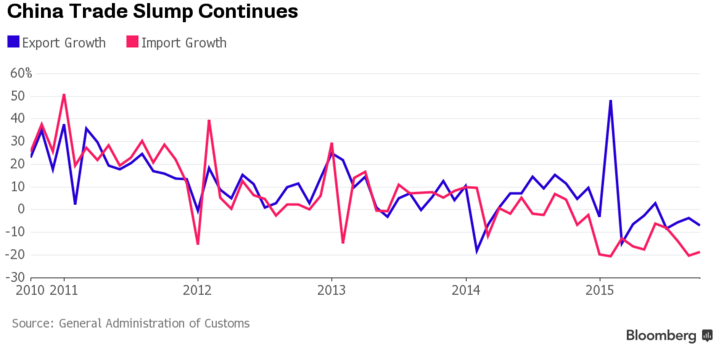
News today of slower than expected exports from and imports into China likely doesn’t bode well for commodities, or commodity currencies. From The Wall Street Journal, my emphasis:
BEIJING—China’s exports fell in October for the fourth consecutive month, as a once-powerful engine of the country’s growth continued to sputter in the face of weak global demand.
The world’s appetite for China’s goods—the world’s second-largest economy accounts for nearly one-fifth of global factory exports — has been lower than expected this year. Meanwhile, weak domestic demand continues to reduce imports. Both are contributing to China’s growth slowdown. (Please click here to view larger charts in the PDF version)
“The mix of the data is again not encouraging,” said Commerzbank economist Zhou Hou. “Trade momentum is unlikely to turn around in the near term.”
Sunday’s results suggest the export scene is worsening. China’s General Administration of Customs said October exports fell 6.9% year-over-year in dollar terms, after a drop of 3.7% in September. The October figure was worse than the
median 4.1% decline forecast by 11 economists in a survey by The Wall Street Journal.
Imports in October fell by a sharper-than-expected 18.8% from a year earlier, following a 20.4% decline in September. China’s trade surplus widened in October to $61.64 billion from $60.3 billion in September.
China’s Commerce Ministry said Thursday in a report that exports are likely to see little increase in 2015, while imports will likely report a “relatively big” decline as falling commodity prices continue to weigh on trade flows.
Well, last Friday’s strong US jobs number (and this China export/import news) has put a big dent in our thought oil prices would rally again—targeting to $55. We did manage to sneak out of our long CAD (short USD/CAD) position with a small gain; which was partially predicated on its correlation with oil price, i.e. stronger oil and stronger Canadian dollar.
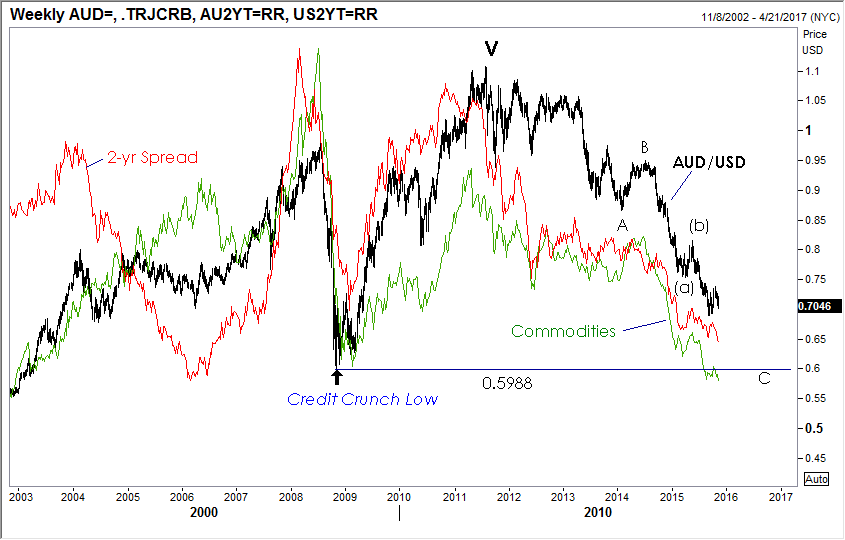
On Friday we went short AUD/USD. Maybe selling into the jobs data didn’t make sense and maybe the moves will be retraced on the open in Asia. But today’s Chinese export data may help the Aussie short trade. Despite commodities being hammered viciously for reasons known, I think some people, including me, expected the latest Chinese stimulus would provide a reprieve. It doesn’t seem it has.
Here is a look at the AUD/USD weekly chart, with commodities prices and the 2-year yield spread Australia-United States overlaid…note both the commodities index and yield spread have pierced below their credit crunch lows—but AUD/USD has not (that comes in at 0.5988; 10+ cents below Friday’s close):
Though the real stuff hasn’t been helped by central bank largess (or maybe it would be much worse without it), the financial stuff has—evidenced being bond and stock prices.
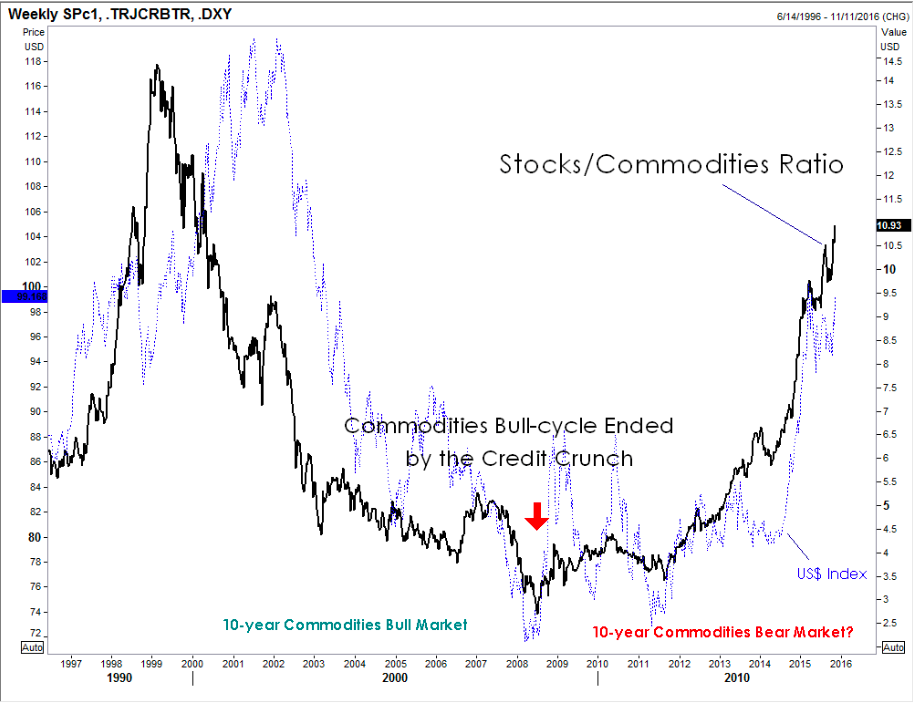
Will there be another knee-jerk assumption the latest weak Chinese data means “more stimulus” or will we finally witness what so many have argued about, with good reason, for so long—a closing of the gaping gap between the real and financial economy (aka stocks coming down)? But will commodities come down even faster if stocks fade? Begs the question of where to hide if so…and begs for an answer that would further impact currencies: US Treasuries would be a place to hide and if that proves true, the dollar gets yet another risk bid.
Ratio: Stocks (S&P 500) divided by Commodities (Thomson Reuters CRB) versus US Dollar Index: Stocks are crushing commodities ever since the credit crunch, boosting the Stocks/Commodities Ratio. And the not so long ago hated greenback is moving right along with it.
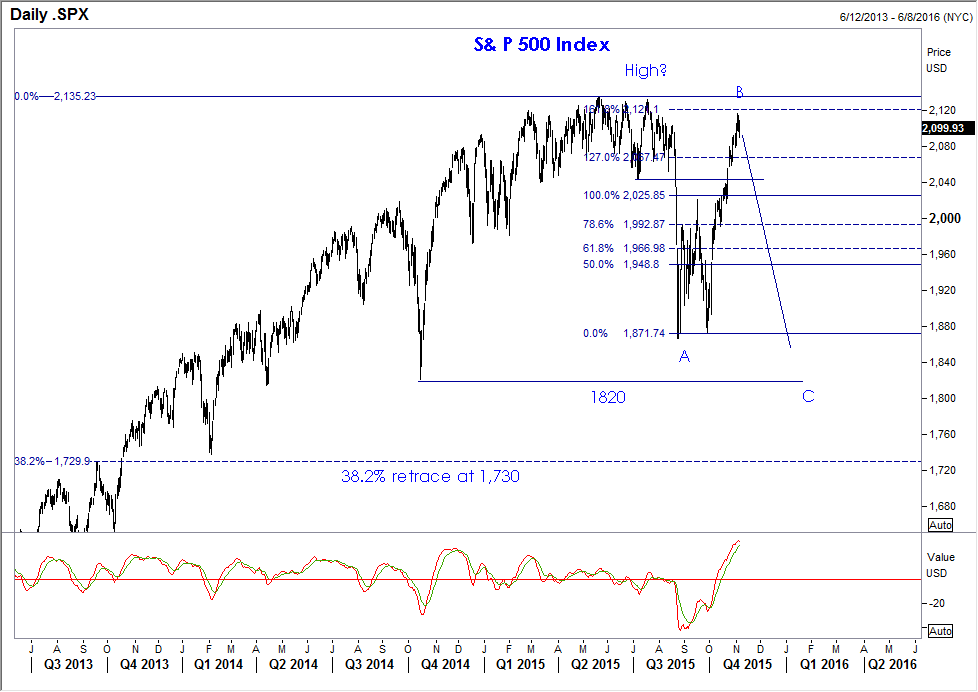
As indicated in my chart posted on Friday—what a great time for Mr. Market to do his thing…
Once again, if I could predict stock prices I wouldn’t be trading currencies. But I do believe as George Soros (the great macro investor version of GS; not the political hack version) said back in 1987—“…stocks are the largest single repository of collateral value for the real economy.” Thus, a break in stocks can be a powerful negative feedback loop to the real economy depending on where we are in the cycle; thus, it’s more potential deflationary raw material in the pound materials. That can’t be good for commodity currencies.
Regards,
Jack Crooks
President, Black Swan Capital
Twitter: @bswanca
Subscription Offer to Black Swan Forex Service [Expires on Today]
If you are interesting in becoming a subscriber to our Black Swan Forex service (which also includes our Current Options Strategist in the price) we are offering a special price.
Special One-term One Year Discounted Price: Only $695—that is over 30% off the normal yearly price of $995 (that includes a one-year subscription to Currency Options Strategist).

Over the last couple of weeks, I have discussed the entrance of the markets into the seasonally strong period of the year and the potential to increase equity exposure in portfolios on a “short-term” basis. To wit:
“With the markets EXTREMELY overbought short-term, the setup for putting money into the market currently is not ideal.
However, as shown in the chart below, the markets have registered a short-term BUY signal that suggests that we remain alert for a pullback that generates a short-term oversold condition without violating any important supports.”
The chart below updates that analysis from last week.

…for larger charts and more analysis (make sure to scroll down to Lance’s Sector Analysis) all can be found HERE

1. Sickly stock market internals, plus gold update …
by Larry Edelson
“If you’re heavily invested, just get out now. It’s that simple.”
2. Is This 80/20 Portfolio the Best Plan for Your Money?
“If you want to do well with your investments, you will buy stocks… and buy them now“
“…a long-term investor who wants an easy life should keep 80% of their money in stocks and 20% in short-term bonds or cash”
3. Silver Stocks Look Spectacular


-
I know Mike is a very solid investor and respect his opinions very much. So if he says pay attention to this or that - I will.
~ Dale G.
-
I've started managing my own investments so view Michael's site as a one-stop shop from which to get information and perspectives.
~ Dave E.
-
Michael offers easy reading, honest, common sense information that anyone can use in a practical manner.
~ der_al.
-
A sane voice in a scrambled investment world.
~ Ed R.
Inside Edge Pro Contributors

Greg Weldon

Josef Schachter

Tyler Bollhorn

Ryan Irvine

Paul Beattie

Martin Straith

Patrick Ceresna

Mark Leibovit

James Thorne

Victor Adair