
Stocks & Equities
Long-Term Trend
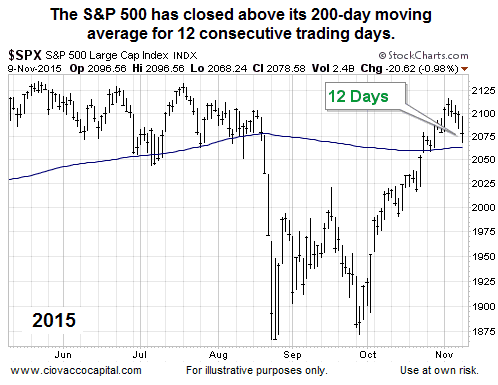
The S&P 500’s 200-day moving average is commonly used to track long-term trends. All things being equal, the stock market bulls prefer the S&P 500 to remain above the 200-day. The bears are more content when price drops and stays below the 200-day. As shown in the 2015 chart below, the S&P 500 has printed twelve consecutive daily closes above its 200-day moving average. From a historical perspective, do rallies typically fail or succeed after twelve consecutive closes above the 200-day?
1990 – The Rally Continued
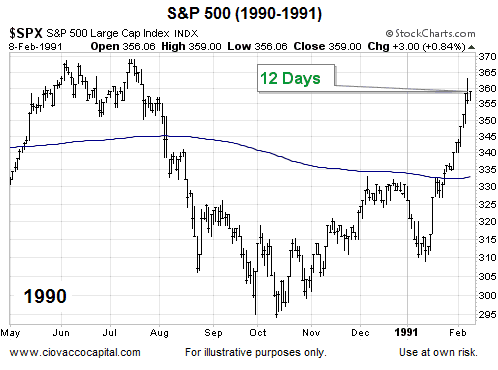
There are not too many historical cases in the last 30 years that featured a significant drop below the 200-day (7% to 19%) followed by a rally back above the 200-day. One case that fits the profile is 1990.
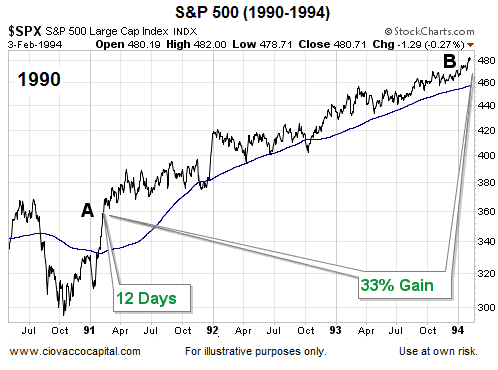
What happened after the twelfth consecutive close? Stocks tacked on an additional 33% between point A and point B.
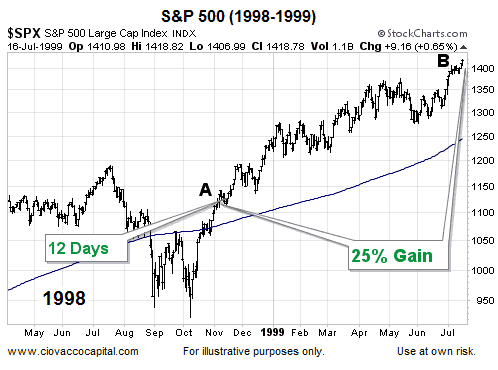
1998 – The Rally Continued
In 1998, the S&P 500 slashed through its 200-day moving average, formed a double bottom, and then rallied back above its 200-day moving average for twelve consecutive sessions, which is similar to what we have seen in 2015.
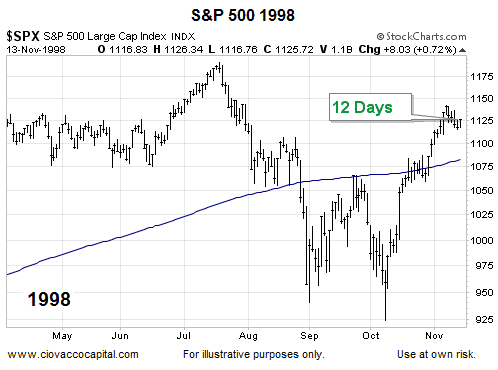
What happened after the twelfth consecutive close in 1998? Stocks tacked on an additional 25% between point A and point B.
Does The Bigger Picture Have Bullish Characteristics?
This week’s stock market video takes a broader look at the market’s risk-reward profile.
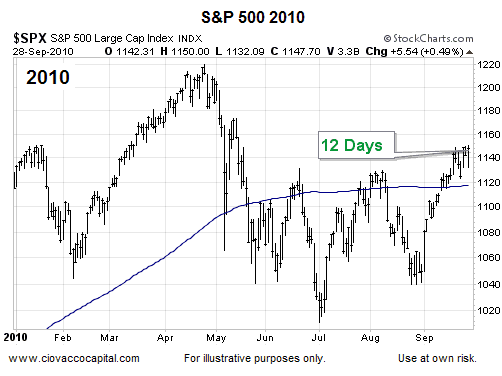
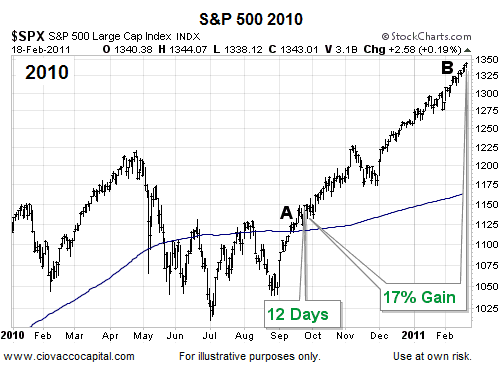
After the 2010 “flash crash” correction, the S&P 500 was unable to post twelve consecutive daily closes above its 200-day moving average until mid-September.
What happened after the twelfth consecutive close in 2010? Stocks tacked on an additional 17% between point A and point B.
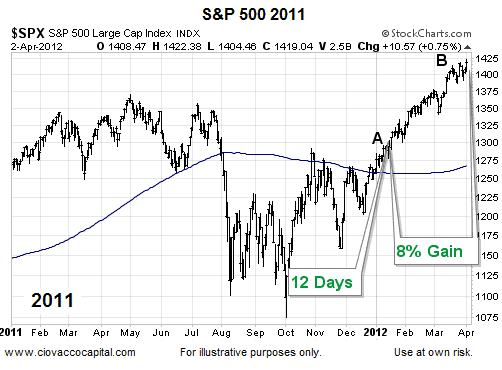
2011 – The Rally Continued
Calendar year 2011 saw numerous events that were similar to 2015; a consolidation period, a sharp plunge, a double bottom, and a rally back above the 200-day moving average. The twelfth consecutive daily close above the 200-day did not occur until early 2012.
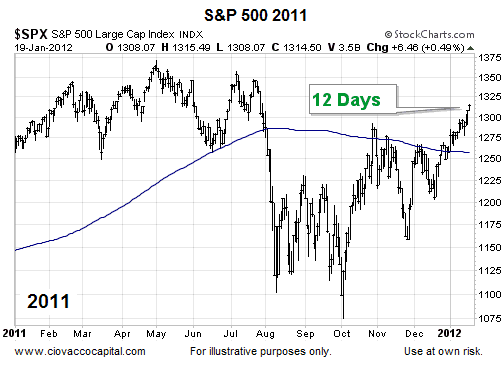
What happened after the twelfth consecutive close in 2012? Stocks tacked on an additional 8% between point A and point B.
How Can We Use This?
Does history tell us what is going to happen in late 2015/early 2016? No, history can only speak to probabilities. In each of the historical cases above, once the S&P 500 posted twelve consecutive daily closes above its 200-day moving average, the rally continued and tacked on significant gains.
What About 1987?
1987 has some similarities and could be included in this analysis. We decided to omit it for two reasons: (1) the S&P 500 stayed below its 200-day moving average for seven months, which is quite a bit different than 2015 (two months), and (2) the negative slope of the 200-day was significantly steeper (more bearish) in 1987.

| Mon. | Tue. | Wed. | Thu. | Fri. | Mon. | Evaluation | |
| Monetary conditions | 0 | 0 | 0 | 0 | 0 | 0 | 0 |
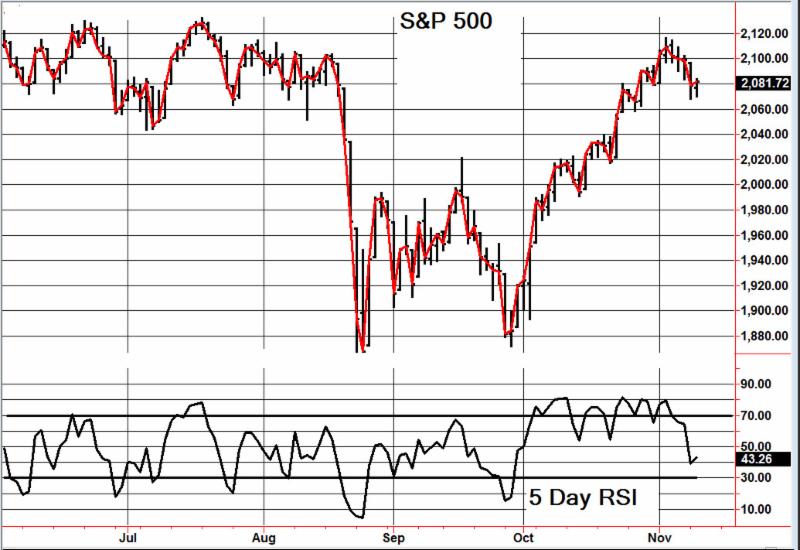
| 5 day RSI S&P 500 | 77 | 79 | 69 | 66 | 75 | 50 | 0 |
| 5 day RSI NASDAQ | 78 | 80 | 79 | 71 | 65 | 39 | 0 |
|
McCl-
lAN OSC.
|
+103 | +103 | +52 | +31 | -18 | -114 |
+
|
| Composite Gauge | 5 | 8 | 12 | 11 | 10 | 15 | + |
| Comp. Gauge, 5 day m.a. | 9.0 | 8.0 | 9.6 | 9.6 | 9.2 | 11.2 | 0 |
| CBOE Put Call Ratio | .90 | .95 | .99 | 1.05 | 1.02 | 1.11 |
+
|
| VIX | 14.15 | 14.54 | 15.51 | 15.05 | 14.33 | 16.52 | 0 |
| VIX % change | -6 | +3 | +7 | -3 | -5 | +15 | + |
| VIX % change 5 day m.a. | -1.40 | -1.0 | +1.8 | +0.8 | -0.8 | +3.4 | + |
| Adv – Dec 3 day m.a. | +458 | +857 | +575 | -89 | -506 | -915 | + |
| Supply Demand 5 day m.a. | .64 | 65 | .51 | .48 | .65 | .54 | 0 |
| Trading Index (TRIN) | .78 | .67 | 1.70 | 1.13 | .72 | 1.21 |
0
|
|
S&P 500
|
2104 | 2110 | 2102 | 2100 | 2100 | 2079 | Plurality+6 |

 While OPEC continues to talk tough about oil production, the International Energy Agency (IEA) is warning that its strategy may backfire on them. This comes the day after the United Arab Emirates (UAE) Energy Minister Suhail Mohamed al-Mazrouei is saying the UAE plans to double down in the OPEC price war by raising production in the next few years to 3.5 million barrels a day, up from 2.9 million barrels per day. He is predicting that the drop in oil prices is almost over and soon prices will start to rise.
The IEA on the hand is not so sure, saying that the OPEC strategy to keep market share may hurt other OPEC members and keep oil prices low for a sustained period. The IEA says that oil is unlikely to return to $80 a barrel before the end of the next decade, despite unprecedented declines in investment, as yearly demand growth struggles to top 1.0 million barrels per day. While OPEC may gain market share in the long run, they will have to deal with the pain of low oil prices in the short run. The IEA is predicting that demand growth under its central scenario will rise annually by some 900,000 barrels per day to 2020, gradually reaching demand of 103.5 million bpd by 2040. Of that OPEC’s market share will remain at 41% until 2020 then rise to 44% by 2025, which is just two percentage points higher than the IEA forecast a year ago.
The International Energy Agency also predicts an end to production growth from outside of OPEC saying it will halt over the next five years. The IEA says that U.S. shale output will peak in 2020. They said that U.S. production with, “its ability to respond quickly to price signals is changing the way the oil market operates.” But its rise will be constrained because of the nature of pumping from shale formations, short-term projects in which oil wells are depleted quickly.
The IEA’s gloomy outlook is being lost on some OPEC members who believe a price turnaround is just around the corner. In fact, OPEC is not even worrying about the return of Iranian oil. OPEC Secretary General Abdalla El-Badri is saying that OPEC can do anything to accommodate new Iranian oil output.
Bloomberg News reports that global demand for crude will bring more balance to the oil market as soon as next year, according to Pulitzer Prize-winning author and energy consultant Daniel Yergin and OPEC Secretary General Abdalla El-Badri. The oil market will rebalance in 2016 or 2017, as demand grows between 1.2 million barrels per day and 1.5 million barrel per day through 2020, Yergin, vice chairman of consultants IHS, said in a speech in Abu Dhabi.
Demand will rise by about 17 million barrels a day to almost 110 million barrels a day by 2040, with 70% of the growth to come from Asia, the head of the Organization of Petroleum Exporting Countries said at an event in Doha. Yergin added: “The next few quarters are going to continue to be tough as Iranian oil comes back into the market. We really see 2016 as the year of transition.”
I agree more with Yergin than the IEA’s more gloomy outlook! Long term it is time to buy when there is blood in the streets!
About the Author

Senior energy analyst at The PRICE Futures Group and a Fox Business Network contributor. He is one of the world’s leading market analysts, providing individual investors, professional traders, and institutions with up-to-the-minute investment and risk management insight into global petroleum, gasoline, and energy markets. His precise and timely forecasts have come to be in great demand by industry and media worldwide and his impressive career goes back almost three decades, gaining attention with his market calls and energetic personality as writer of The Energy Report. You can contact Phil by phone at (888) 264-5665 or by email at pflynn@pricegroup.com. Learn even more on our website at www.pricegroup.com.


Has Wikipedia nailed it or do we need a better, more all-encompassing definition?
This Financial Independence column at MoneySense (online and in the physical magazine) has been running a few years now. Since it also spawned November’s launch of the Financial Independence Hub, I thought it would be appropriate to look at the formal definitions of financial independence (which of course I like to shorten to Findependence).
Usually, I just point readers to the Wikipedia definition, since it’s at the top of the Google search engine when you enter the phrase. The key part is “the state of having sufficient personal wealth to live, without having to work actively for basic necessities.” I’ve written about this before and you can go to the above link for the full definition, but for this particular blog, I wanted to explore other definitions.
 “government’s abrogation of free markets will ultimately result in economic chaos and entropy”
The October ISM Manufacturing Index, which has been the official barometer of the U.S. manufacturing sector since 1915, came in with a reading of just 50.1. This was a level barely above contraction.
Of the 18 industries surveyed in the Regional Manufacturing Survey, 9 reported contraction in October: Apparel, Leather & Allied Products; Primary Metals; Petroleum & Coal Products; Plastics & Rubber Products; Electrical Equipment, Appliances & Components; Machinery; Transportation Equipment; Wood Products; and Computer & Electronic Products.
And of those nine, the energy market in particular continues to struggle the most. One respondent in the survey noted that the effects of the weak energy market are now beginning to bleed into other areas of the economy.
In addition to this, new orders for U.S. factory goods fell for a second straight month in September (down 1.0 %), confirming the manufacturing sector in the United States has hit a downturn.
In fact, U.S. Factory Orders have fallen y/y for 11 of last 14 months; and contracted 6.9% from September 2014.
Furthermore, demand for durable goods fell 1.2% in September. While demand for nondurable goods (goods not expected to last more than three years) fell 0.8%. This placed downward pressure on GDP in the third quarter leading to a disappointing 1.5% GDP read.
During the month of September a majority of U.S. states reported jobs losses, as the slowing manufacturing sector weighed on hiring nationwide. The Labor Department recently announced that 27 states actually lost jobs in the month of September. This data belies the rosy headline 271k Non-Farm Payroll report issued for October: the Labor Department releases individual state data a month in arrears.
All this bad news begs the question: Has the former manufacturing renaissance in the United States officially turned back into the dark ages?
Despite huge kudo’s to U.S. ingenuity for inventing fracking and horizontal drilling technologies, the viability of these innovations depends upon an unsustainable bubble in oil prices. Fracking is just one example of the misallocation of capital resulting from faulty price signals derived from central banks’ manipulation of interest rates.
And this failure isn’t limited to our Federal Reserve. The strategies of central banks all over the world are failing.
The European Central Bank (ECB) to date is in the process of printing the equivalent of $67 billion of QE per month, which will amount to a total of $1.2 trillion (or 1.1 trillion euros) by the time Mario Draghi’s QE program is slated to end in September of 2016.
Considering all that money printing, GDP in the Eurozone was only a pathetic 1.2% larger than it was one year ago.
Once the star of the Eurozone economy, German GDP disappointed with growth of 0.4% for the second quarter instead of the 0.5% analysts had been expecting. The French figure came in completely flat, and Italy, the Eurozone’s third biggest economy, disappointed with growth of just 0.2%.
Italy’s unemployment rate managed to fall in September, even as its economy lost 36,000 jobs during the month. This was because more discouraged workers left the workforce. As growth rates languish and economies lose jobs, central banks are getting more and more desperate to create inflation, which they like to masquerade as growth.
But the sad truth is even with over a trillion Euros of new money printed, governments are not achieving the inflation rates or the GDP growth they are seeking.
And then we have Japan, which is entering into its 3rd recession since the Abenomics regime took control in December 2012. The BOJ has been in the habit of printing 80 trillion yen each year! Nevertheless, its debt to GDP is approaching 250%, and annual deficits are 8% of GDP. The BOJ is buying 90% of all the bonds issued, and now owns half of all Japanese ETF’s. Yet despite a train wreck of an economy and horrific debt and deficits the 10 year note-in a perfect example of a central bank distorting economic reality–is yielding just 0.3%.
Our Fed has printed $3.5 trillion since 2008 in a futile attempt to get the economy growing at what Keynesians term as escape velocity. However, we have only averaged 2% growth since 2010. And growth in 2015 appears to be even less, as the all-important manufacturing sector is now clearly in a recession, and is now dragging down the rest of the economy.
Today, there are no free markets left anywhere in the world. Governments control the fixed income, equity and real estate sectors; and therefore control the entire economy. And what was once touted as the U.S. manufacturing renaissance has morphed into another example of how government’s abrogation of free markets will ultimately result in economic chaos and entropy.
Michael Pento produces the weekly podcast “The Mid-week Reality Check”, is the President and Founder of Pento Portfolio Strategies and Author of the book “The Coming Bond Market Collapse.”

-
I know Mike is a very solid investor and respect his opinions very much. So if he says pay attention to this or that - I will.
~ Dale G.
-
I've started managing my own investments so view Michael's site as a one-stop shop from which to get information and perspectives.
~ Dave E.
-
Michael offers easy reading, honest, common sense information that anyone can use in a practical manner.
~ der_al.
-
A sane voice in a scrambled investment world.
~ Ed R.
Inside Edge Pro Contributors

Greg Weldon

Josef Schachter

Tyler Bollhorn

Ryan Irvine

Paul Beattie

Martin Straith

Patrick Ceresna

Mark Leibovit

James Thorne

Victor Adair