

Available Mon- Friday after 6:00 P.M. Eastern, 3:00 Pacific.
DOW + 28 on 250 net advances
NASDAQ COMP – 12 on 200 net declines
SHORT TERM TREND Bearish
INTERMEDIATE TERM TREND Bullish
STOCKS : Very lackluster day. Investors seemed to be in a waiting mood. Waiting for what? Perhaps retail sales on Friday. Perhaps Janet Yellen’s speech on Thursday. (Does she speak every day?)
Whatever the reason, volume was the lowest since last May. The floor of the Exchange must have looked like a wax museum.
GOLD: Gold was basically flat. Not much to comment on here.
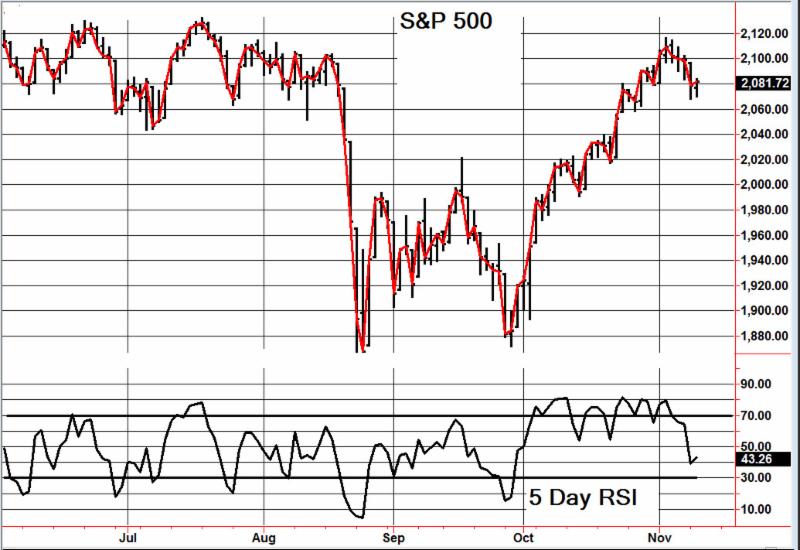
CHART: The S&P had an anemic rebound today on low volume. It’s not yet oversold so near term advances aside, I would look for more downside on the short term.
BOTTOM LINE: (Trading)
Our intermediate term system is on a buy as of August 26.
System 7 We are in cash. Stay there.
System 8 We are in cash. Stay there.
GOLD We are in cash. Stay there.
News and fundamentals: There were no important releases on Tuesday and there are none on Wednesday. Light week for news.
Interesting Stuff : “In order to avoid being called a flirt, she always yielded easily.”—– Charles, Count Talleyrand
TORONTO EXCHANGE: Toronto lost 71. S&P/TSX VENTURE COMP: The TSX also lost 1.
BONDS: Bonds lost more ground.
THE REST: The dollar pulled back slightly. Silver and crude oil were again lower.
Bonds –Bearish since October 29.
U.S. dollar –Bullish since October 22.
Euro — Bearish since October 22.
Gold —-Bearish since October 19.
Silver—- Bearish since October 21.
Crude oil —- Bullish since October 28.
Toronto Stock Exchange—- Bullish since August 27.
S&P\ TSX Venture Fund — Bullish since August 27.
We are on a long term buy signal for the markets of the U.S., Canada, Britain, Germany and France.
| Mon. | Tue. | Wed. | Thu. | Fri. | Mon. | Evaluation | |
| Monetary conditions | 0 | 0 | 0 | 0 | 0 | 0 | 0 |
| 5 day RSI S&P 500 | 77 | 79 | 69 | 66 | 75 | 50 | 0 |
| 5 day RSI NASDAQ | 78 | 80 | 79 | 71 | 65 | 39 | 0 |
|
McCl-
lAN OSC.
|
+103 | +103 | +52 | +31 | -18 | -114 |
+
|
| Composite Gauge | 5 | 8 | 12 | 11 | 10 | 15 | + |
| Comp. Gauge, 5 day m.a. | 9.0 | 8.0 | 9.6 | 9.6 | 9.2 | 11.2 | 0 |
| CBOE Put Call Ratio | .90 | .95 | .99 | 1.05 | 1.02 | 1.11 |
+
|
| VIX | 14.15 | 14.54 | 15.51 | 15.05 | 14.33 | 16.52 | 0 |
| VIX % change | -6 | +3 | +7 | -3 | -5 | +15 | + |
| VIX % change 5 day m.a. | -1.40 | -1.0 | +1.8 | +0.8 | -0.8 | +3.4 | + |
| Adv – Dec 3 day m.a. | +458 | +857 | +575 | -89 | -506 | -915 | + |
| Supply Demand 5 day m.a. | .64 | 65 | .51 | .48 | .65 | .54 | 0 |
| Trading Index (TRIN) | .78 | .67 | 1.70 | 1.13 | .72 | 1.21 |
0
|
|
S&P 500
|
2104 | 2110 | 2102 | 2100 | 2100 | 2079 | Plurality+6 |
INDICATOR PARAMETERS
Monetary conditions (+2 means the Fed is actively dropping rates; +1 means a bias toward easing. 0 means neutral, -1 means a bias toward tightening, -2 means actively raising rates). RSI (30 or below is oversold, 80 or above is overbought). McClellan Oscillator ( minus 100 is oversold. Plus 100 is overbought). Composite Gauge (5 or below is negative, 13 or above is positive). Composite Gauge five day m.a. (8.0 or below is overbought. 13.0 or above is oversold). CBOE Put Call Ratio ( .80 or below is a negative. 1.00 or above is a positive). Volatility Index, VIX (low teens bearish, high twenties bullish), VIX % single day change. + 5 or greater bullish. -5 or less, bearish. VIX % change 5 day m.a. +3.0 or above bullish, -3.0 or below, bearish. Advances minus declines three day m.a.( +500 is bearish. – 500 is bullish). Supply Demand 5 day m.a. (.45 or below is a positive. .80 or above is a negative). Trading Index (TRIN) 1.40 or above bullish. No level for bearish.
No guarantees are made. Traders can and do lose money. The publisher may take positions in recommended securities.


