
Energy & Commodities
 The oil price crash continues to claim victims…and many of them are in Canada.
The price of oil hovered around $100 for most of last summer. Today, it’s trading for less than $45.
Weak oil prices have pummeled huge oil companies. The SPDR S&P Oil & Gas Exploration & Production ETF (XOP), which tracks the performance of major U.S. oil producers, has declined 36% over the past year. The Market Vectors Oil Services ETF (OIH), which tracks U.S. oil services companies, has declined 30% since last November.
Weak oil prices have even pushed entire countries to the brink. Saudi Arabia, which produces more oil than any country in the world, is on track to post its first budget deficit since 2009 this year. If oil prices stay low, the country could burn through its massive $650 million pile of foreign reserves within five years.
• Oil’s collapse is also creating big problems for Canada’s economy…
Canada is the world’s sixth largest oil producer. Oil makes up 25% of its exports.
Last month, The Conference Board of Canada said it expects sales for Canada’s energy sector to fall 22% this year. It also expects the industry to record a net loss of about C$2.1 billion ($1.6 billion) in 2015. That’s a drastic change from last year, when the industry booked a C$6 billion ($4.5 billion) profit.
Major oil firms are slashing spending to cope with low prices. Last month, oil giant Royal Dutch Shell plc (RDS.A) said it would stop construction on an 80,000 barrels per day (bpd) project in western Canada. The company had already abandoned another 200,000 bpd project in northern Canada earlier this year.
The Canadian Association of Petroleum Producers estimates that Canadian oil and gas companies have laid off 36,000 workers since last summer. Most of these layoffs happened in the province of Alberta…
• For the past decade, Alberta was Canada’s fastest growing province…
Its economy exploded, thanks to the booming market for Canadian tar sands.
Tar sand is a gooey sand and oil mixture that melts down with heat from burning natural gas. More than half of Canada’s oil production comes from tar sands. In Alberta, they account for 75% of oil production.
Tar sand is generally more expensive to produce than conventional crude oil. Canadian tar sand projects made sense when oil hovered around $100. But many of these projects can’t make money when oil trades for $45/barrel. Last year, Scotiabank (BNS) said the average breakeven point for new Canadian oil sand projects was around $65/barrel.
This is why giant oil companies are walking away from projects they’ve spent years and billions of dollars developing.
• All these cancelled oil projects are making Alberta’s economy unravel…
Alberta lost 63,500 jobs from the start of year through August. It hasn’t lost that many jobs during the first eight months of the year since the Great Recession.
The decline in oil production is also draining government resources. Last month, Reuters reported that Alberta was on track to post a $4.6 billion budget deficit this year. Economists say it could be another five years before Alberta runs a budget surplus.
The crisis isn’t confined to the oil patches either…
• A real estate crisis is unfolding in Calgary…
Calgary is home to 1.2 million people. It’s the largest city in Alberta and the third largest in Canada.
On Tuesday, Bloomberg Business reported that Calgary’s property market is starting to crack:
Vacancy is already at a five-year high in Calgary and rents are the lowest since 2006 after thousands of office jobs were cut.
In downtown Calgary, the vacancy rate jumped to 14 percent in the third quarter, the highest since 2010 and compared with 5 percent for downtown Toronto, according to CBRE Group Inc. …. That doesn’t include as much as 2 million square feet of so-called “shadow vacancy” or space leased but sitting empty, which would push vacancy to 16 percent, the most since the mid-1980s.
Demand for office space is falling because of massive layoffs in the oil industry. That’s because oil companies didn’t just lay off roughnecks. They also laid off oil traders and middle managers, which means they need a lot less office space.
According to Bloomberg Business, a principal at one Calgary real estate office called the situation “a bloodbath” and said “we’re at the highest point of fear and uncertainty now.”
• Time to buy is when there’s blood in the streets…
But it looks like Calgary’s property crisis is just getting started.
Bloomberg Business reports that the city has five new office towers in the works. These projects will add about 3.8 million square feet to Calgary’s office market over the next three years. More office space will only put more pressure on rents and occupancy rates.
Real estate developers likely planned these projects because they thought Canada’s oil boom would last. It’s that same thinking that made oil companies invest billions of dollars in projects that can’t make money when oil trades for less than $100/barrel.
• Doug Casey saw this coming…
In September, Doug went to Alberta to assess the damage first-hand. E.B. Tucker, editor of The Casey Report, joined Doug on the trip.
Doug and E.B. spoke with the locals. They even tried to buy a Ferrari. They shared their experience in the October issue of The Casey Report…
E.B. went on record saying Canada was in for “a major wakeup call.” He still thinks that’s the case. In fact, he thinks the situation is going to get a lot worse.
When we were in Alberta, we heard over and over again “It’ll come right back…it always does.” It’s not coming back.
I expect the situation to get worse. And I see the Canadian dollar going much lower.
When that happens, E.B. thinks Canada’s central bank might do something it’s never done before:
Vacancy rates are rising in Canada’s heartland cities. Jobs in Alberta are disappearing. Unemployment is climbing. And there’s still a global oversupply in oil. None of this bodes well for Canada’s economy.
Canada’s economy is in a midair stall. The locals certainly didn’t grasp this when we visited Alberta last month. That’s usually the case when things are going from bad to a lot worse.
If you’re a central banker in Canada looking at the data, there’s only one decision: print…
• E.B. says Canada’s central bank will launch its own quantitative easing (QE) program…
QE is when a central bank creates money and pumps it into the financial system. It’s basically another term for money printing.
Since 2008, the Fed has used QE to inject $3.5 trillion into the U.S. financial system. If the Fed’s experience with QE is any indication, money printing wouldn’t help Canada’s “real” economy much. But it would inflate asset prices. That, in turn, would only make Canada’s economy even more fragile.
E.B. is confident the situation in Canada will get worse. And he can’t wait to go back to Canada to collect on bets he made during his last visit:
Doug and I made a lot of side bets with business owners during our visit. One of them promised to sell us a Ferrari if things got worse…that’s how sure he was that we were wrong. Looks like we’ll be headed back to collect on that one…
You can read all about Doug and E.B.’s visit to Alberta by signing up for a risk-free trial of The Casey Report.You’ll even discover how to make money off the oil industry, despite the collapse in the price of oil. Click here to learn more.

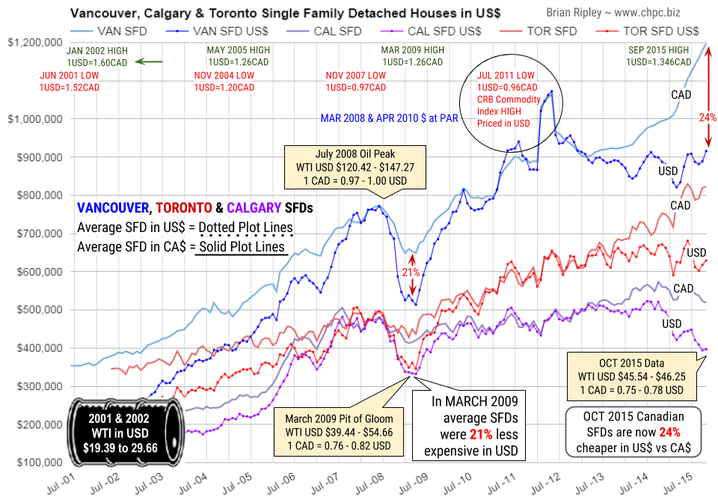
The chart above shows the average price comparison of Vancouver, Toronto & Calgary Single Family Dwellings denominated in CAD and USD along with notations of significant changes in the spot price of WTI crude oil and the currency spread.
….for larger chart and more comment go HERE
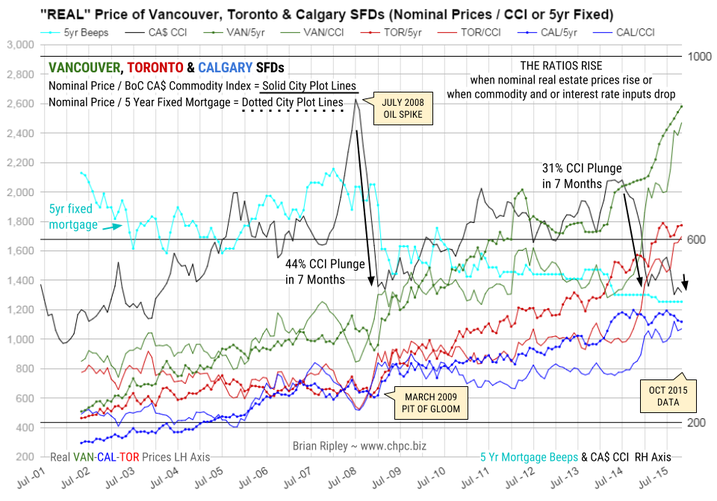
The chart above shows the “real price” of Vancouver, Toronto & Calgary SFDs when looked at from the point of view of the BoC Canadian Commodity Index (CCI) and Borrowing Costs (retail 5yr Mortgage) which are the main input costs apart from operating expenses and tax.
…for larger chart and more comment go HERE

 Making money entails a lot more than predicting which way the stock or bond markets are heading or trying to figure which stock or fund will double over the next few years. For the great majority of investors, making money requires a plan, self-discipline and desire. I say, “for the great majority of people” because if you’re a Steven Spielberg or a Bill Gates you don’t have to know about the Dow or the markets or about yields or price/earnings ratios. You’re a phenomenon in your own field, and you’re going to make big money as a by-product of your talent and ability. But this kind of genius is rare.
For the average investor, you and me, we’re not geniuses so we have to have a financial plan. In view of this, I offer below a few items that we must be aware of if we are serious about making money.
Rule 1: Compounding: One of the most important lessons for living in the modern world is that to survive you’ve got to have money. But to live (survive) happily, you must have love, health (mental and physical), freedom, intellectual stimulation — and money. When I taught my kids about money, the first thing I taught them was the use of the “money bible.” What’s the money bible? Simple, it’s a volume of the compounding interest tables.
Compounding is the royal road to riches. Compounding is the safe road, the sure road, and fortunately, anybody can do it. To compound
successfully you need the following:perseverance in order to keep you firmly on the savings path. You need intelligence in order to understand what you are doing and why. And you need a knowledge of the mathematics tables in order to comprehend the amazing rewards that will come to you if you faithfully follow the compounding road. And, of course, you need time, time to allow the power of compounding to work for you. Remember, compounding only works through time.
But there are two catches in the compounding process. The first is obvious — compounding may involve sacrifice (you can’t spend it and still save it). Second, compoundingis boring — b-o-r-i-n-g. Or I should say it’s boring until (after seven or eight years) the money starts to pour in. Then, believe me, compounding becomes very interesting. In fact, it becomes downright fascinating!
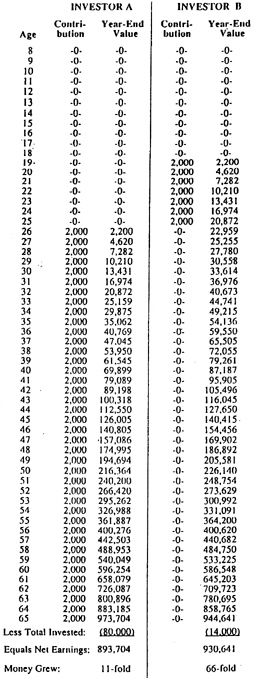
In order to emphasize the power of compounding, I am including this extraordinary study, courtesy of Market Logic, of Ft. Lauderdale, FL 33306. In this study we assume that investor (B) opens an IRA at age 19. For seven consecutive periods he puts $2,000 in his IRA at an average growth rate of 10% (7% interest plus growth). After seven years this fellow makes NO MORE contributions — he’s finished.
A second investor (A) makes no contributions until age 26 (this is the age when investor B was finished with his contributions). Then A continues faithfully to contribute $2,000 every year until he’s 65 (at the same theoretical 10% rate).
Now study the incredible results. B, who made his contributions earlier and who made only seven contributions, ends up with MORE money than A, who made 40 contributions but at a LATER TIME. The difference in the two is that B had seven more early years of compounding than A. Those seven early years were worth more than all of A’s 33 additional contributions.
This is a study that I suggest you show to your kids. It’s a study I’ve lived by, and I can tell you, “It works.” You can work your compounding with muni-bonds, with a good money market fund, with T-bills or say with five-year T-notes.
Rule 2: DON’T LOSE MONEY: This may sound naive, but believe me it isn’t. If you want to be wealthy, you must not lose money, or I should say must not lose BIG money. Absurd rule, silly rule? Maybe, but MOST PEOPLE LOSE MONEY in disastrous investments, gambling, rotten business deals, greed, poor timing. Yes, after almost five decades of investing and talking to investors, I can tell you that most people definitely DO lose money, lose big time — in the stock market, in options and futures, in real estate, in bad loans, in mindless gambling, and in their own business.
RULE 3: RICH MAN, POOR MAN: In the investment world the wealthy investor has one major advantage over the little guy, the stock market amateur and the neophyte trader. The advantage that the wealthy investor enjoys is that HE DOESN’T NEED THE MARKETS. I can’t begin to tell you what a difference that makes, both in one’s mental attitude and in the way one actually handles one’s money.
The wealthy investor doesn’t need the markets, because he already has all the income he needs. He has money coming in via bonds, T-bills, money market funds, stocks and real estate. In other words, the wealthy investor never feels pressuredto “make money” in the market.
The wealthy investor tends to be an expert on values. When bonds are cheap and bond yields are irresistibly high, he buys bonds. When stocks are on the bargain table and stock yields are attractive, he buys stocks. When real estate is a great value, he buys real estate. When great art or fine jewelry or gold is on the “give away” table, he buys art or diamonds or gold. In other words, the wealthy investor puts his money where the greatvalues are.
And if no outstanding values are available, the wealthy investors waits. He can afford to wait. He has money coming in daily, weekly, monthly. The wealthy investor knows what he is looking for, and he doesn’t mind waiting months or even years for his next investment (they call that patience).
But what about the little guy? This fellow always feels pressured to “make money.” And in return he’s always pressuring the market to “do something” for him. But sadly, the market isn’t interested. When the little guy isn’t buying stocks offering 1% or 2% yields, he’s off to Las Vegas or Atlantic City trying to beat the house at roulette. Or he’s spending 20 bucks a week on lottery tickets, or he’s “investing” in some crackpot scheme that his neighbor told him about (in strictest confidence, of course).
And because the little guy is trying to force the market to do something for him, he’s a guaranteed loser. The little guy doesn’t understand values so he constantly overpays. He doesn’t comprehend the power of compounding, and he doesn’t understand money. He’s never heard the adage, “He who understands interest — earns it. He who doesn’t understand interest — pays it.“The little guy is the typical American, and he’s deeply in debt.
The little guy is in hock up to his ears. As a result, he’s always sweating — sweating to make payments on his house, his refrigerator, his car or his lawn mower. He’s impatient, and he feels perpetually put upon. He tells himself that he has to make money — fast. And he dreams of those “big, juicy mega-bucks.” In the end, the little guy wastes his money in the market, or he loses his money gambling, or he dribbles it away on senseless schemes. In short, this “money-nerd” spends his life dashing up the financial down-escalator.
But here’s the ironic part of it. If, from the beginning, the little guy had adopted a strict policy of never spending more than he made, if he had taken his extra savings and compounded it in intelligent, income-producing securities, then in due time he’d have money coming in daily, weekly, monthly, just like the rich man. The little guy would have become a financial winner, instead of a pathetic loser.
RULE 4: VALUES: The only time the average investor should stray outside the basic compounding system is when a given market offers outstanding value. I judge an investment to be a great value when it offers (a) safety; (b) an attractive return; and (c) a good chance of appreciating in price. At all other times, the compounding route is safer and probably a lot more profitable, at least in the long run.
About Richard Russell of Dow Theory Letters
Richard Russell began publishing Dow Theory Letters in 1958, and he has been writing the Letters ever since (never once having skipped a Letter). Dow Theory Letters is the oldest service continuously written by one person in the business.
Russell gained wide recognition via a series of over 30 Dow Theory and technical articles that he wrote for Barron’s during the late-’50s through the ’90s. Through Barron’s and via word of mouth, he gained a wide following. Russell was the first (in 1960) to recommend gold stocks. He called the top of the 1949-’66 bull market. And almost to the day he called the bottom of the great 1972-’74 bear market, and the beginning of the great bull market which started in December 1974.
The Letters, published every three weeks, cover the US stock market, foreign markets, bonds, precious metals, commodities, economics–plus Russell’s widely-followed comments and observations and stock market philosophy.
In 1989 Russell took over Julian Snyder’s well-known advisory service, “International Moneyline”, a service which Mr. Synder ran from Switzerland. Then, in 1998 Russell took over the Zweig Forecast from famed market analyst, Martin Zweig. Russell has written articles and been quoted in such publications as Bloomberg magazine, Barron’s, Time, Newsweek, Money Magazine, the Wall Street Journal, the New York Times, Reuters, and others. Subscribers to Dow Theory Letters number over 12,000, hailing from all 50 states and dozens of overseas counties.
A native New Yorker (born in 1924) Russell has lived through depressions and booms, through good times and bad, through war and peace. He was educated at Rutgers and received his BA at NYU. Russell flew as a combat bombardier on B-25 Mitchell Bombers with the 12th Air Force during World War II.the 12th Air Force during World War II.

The big retail chains are generally seen as pretty good barometers of the health of “the consumer.” And since — in today’s late-cycle debt-binge pseudo-capitalism — the consumer drives the economy, the numbers coming out of the aforementioned retail chains should be cause for worry.
 First Macy’s got our attention:
Macy’s Sounds a Holiday Alarm, and Retailers Brace for Heavy Discounting
(New York Times) – When Macy’s, a store closely associated with Christmas, says there is trouble brewing ahead of the holidays, it is enough to send the world of shopping into a tailspin.
The retailer of “Miracle on 34th Street” warned Wednesday that its stores were awash with merchandise after a sluggish fall season and that slow business would force it to go all-out on discounts during the holidays.
Macy’s shares plunged about 14 percent, dragging other retailers down, too. The Hudson’s Bay Company, which owns Saks Fifth Avenue and Lord & Taylor, fell 5 percent, as did Kohl’s. Burlington Stores fell about 7 percent.
Then Nordstrom dropped a bomb:
Nordstrom Shares Plunge After Profit Misses Analysts’ Estimates
(Bloomberg) – Nordstrom Inc. fell as much as 18 percent in late trading after missing third-quarter earnings estimates and cutting its annual forecast, renewing concerns about a slump in the department-store industry.
Profit amounted to 42 cents in the period ended Oct. 31, Nordstrom said in a statement Thursday. Excluding some items, the earnings came to 57 cents. Analysts had projected 72 cents on average, according to data compiled by Bloomberg.
Nordstrom follows Macy’s Inc. in reporting disappointing results, underscoring a broader slowdown for department stores. Consumers are spending less of their money on apparel and accessories, shifting their budgets to cars, homes and technology. Retailers and clothing suppliers also have struggled to pare down excess inventories, forcing them to rely more on discounts.
The results reflected “softer sales trends that were generally consistent across channels and merchandise categories,” the Seattle-based company said in the statement.
The shares tumbled as much as $11.68 to $51.79 in late trading in New York. Nordstrom already had slid 20 percent this year through the close of regular trading Thursday.
Nordstrom’s same-store sales, a closely watched benchmark, grew just 0.9 percent last quarter. Analysts had estimated 3.6 percent, according to Consensus Metrix. The Rack outlet business, a former bright spot for the business, also suffered in the period. Same-store sales fell 2.2 percent, missing a projection for growth of 2.8 percent.
What does this mean?
First, e-commerce is winning big. Amazon, eBay, et al, have eaten the big-box stores for lunch, and they’re still hungry. Unless Telsa puts a car showroom in every mall in America, most malls are toast — and mall REITS are great short sale candidates.
Second, the surge in sub-prime auto loans wasn’t such a good thing after all, since those car mortgage payments apparently leave less disposable income for whatever it is people buy at Macy’s and Nordstrom.
Third, the overall economy is, as analysts in the sound money community keep saying, way weaker than the headline government numbers imply. The jobs being created obviously don’t pay enough to enable workers to buy new clothes — even though as a waiter/bartender you do have to look sharp.
Last but not least, stock prices are more vulnerable than you might think from watching CNBC. US equities fell hard today, and though there were several explanations being tossed around (China’s slowdown, a Fed rate increase), the implications of a “profit recession” should be in the mix. Because really, has there ever been a bull market when corporate earnings were falling?
About John Rubino and dollarcollapse.com
DollarCollapse.com is managed by John Rubino, co-author, with GoldMoney’s James Turk, of The Money Bubble (DollarCollapse Press, 2014) and The Collapse of the Dollar and How to Profit From It (Doubleday, 2007), and author of Clean Money: Picking Winners in the Green-Tech Boom (Wiley, 2008), How to Profit from the Coming Real Estate Bust (Rodale, 2003) and Main Street, Not Wall Street (Morrow, 1998). After earning a Finance MBA from New York University, he spent the 1980s on Wall Street, as a Eurodollar trader, equity analyst and junk bond analyst. During the 1990s he was a featured columnist with TheStreet.com and a frequent contributor to Individual Investor, Online Investor, and Consumers Digest, among many other publications. He currently writes for CFA Magazine.
Over the last week we (NFTRH) have used market sentiment indicators and index charts to gauge the prospects of finding a high on the post-September relief ‘bounce’ rally.
During August and September market sentiment had become brutally over bearish and this was very dangerous from the bears’ perspective. We set upside bounce targets for the SPX at 2020, 2040, 2060 and 2100. The first three were resistance levels (broken support) and the last was the general measurement of the ‘W’ bottom that formed in August and September. With the extremes in bearish sentiment, it was not so surprising that SPX climbed all the way to just above 2100.
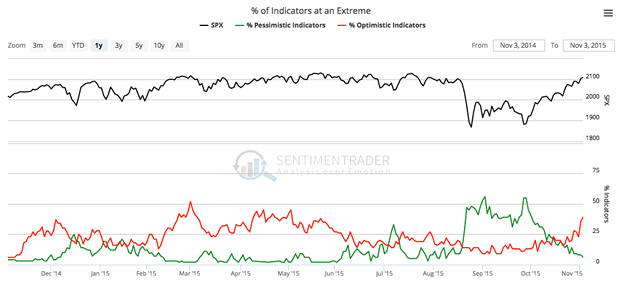
Well, as we have noted in weekly reports and in-week updates recently, that problem for the bears was methodically eliminated by the rally as bulls’ backbones firmed up very well to the point of strenuous (though not hideously extreme) over bullishness. Here is one chart (courtesy Sentimentrader.com) among many sentiment graphics and data points we used in an NFTRH update on November 4. We had been watching pessimism dissipate quite nicely, but now the other component – rapidly growing optimism – was kicking in as well. This would pave the way for a correction from a sentiment standpoint.
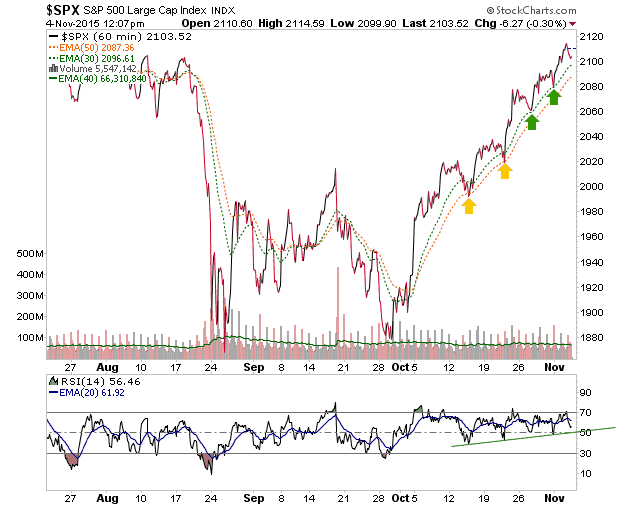
As a ‘look ahead’ we then used and continually updated this 60 minute chart of the SPX beginning with an update called What to Look for w/ Respect to the 1st Signs of a Market Breakdown in order to be prepared to view the very first inkling of what a correction might look like, now that sentiment was coming in line. The ensuing string of updates also included daily charts of SPX for viewing forward-looking support parameters in the event that the market did have an initial breakdown (per the 60 minute view).
The two 60 minute moving averages (EMA 30 & 50) had supported the entire post-September rally and as long as they were intact, there was no bear signal.
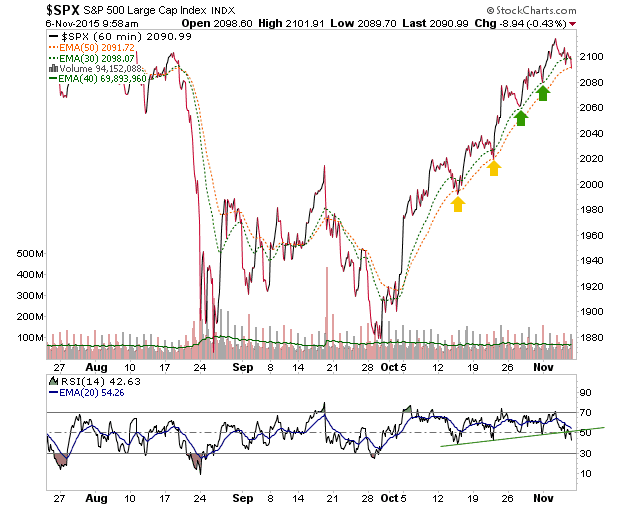
Then two days later it made its initial signal. Here is the chart from another update that went out to subscribers on the spot. We noted that SPX was “on track to begin a reaction, correction or more” as the first moving average gave way and RSI lost support.
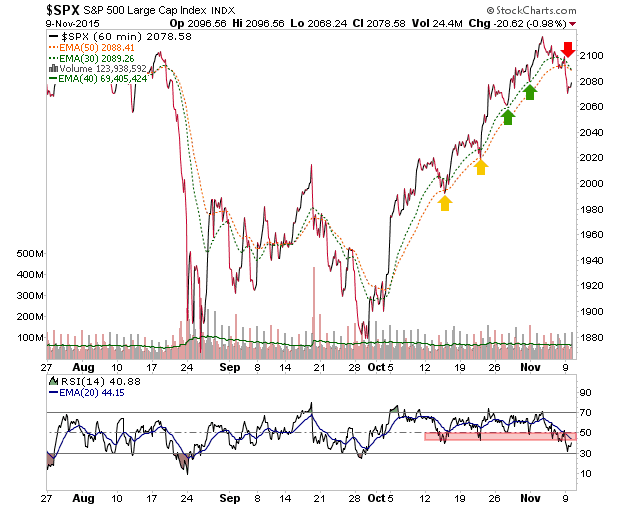
On November 9 the signal got better as the second moving average was pierced and the moving averages turned down. We noted SPX could bounce to test the breakdown.
Sure enough it did… and it failed to negate the damage. Thursday morning we had an update shortly after the open showing the next move down after the bounce failure.
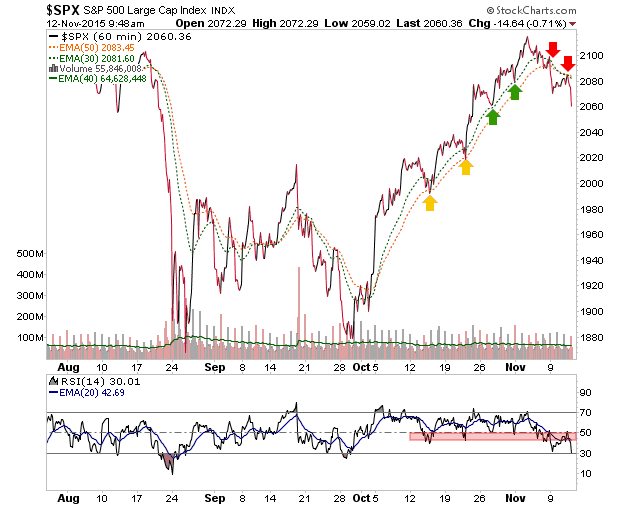
Finally, here is how it looks after the close on Thursday.
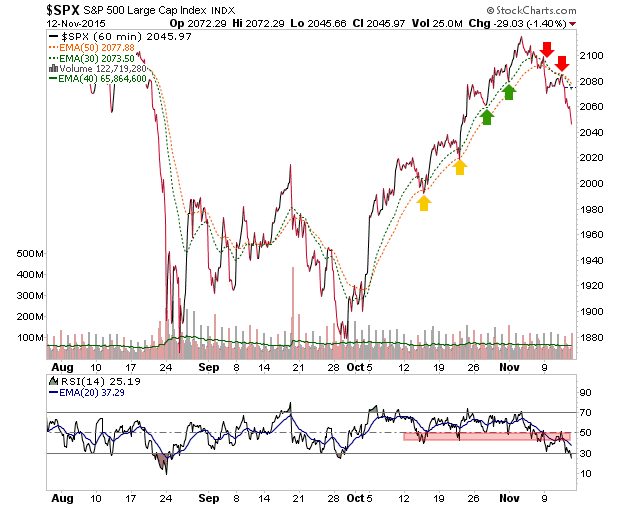
The 60 minute chart’s usefulness has been expressed and now it is on to the daily views for managing the depth of the reaction/correction and if it gets bad enough, the weeklies and monthlies, which will resume guiding the big picture.
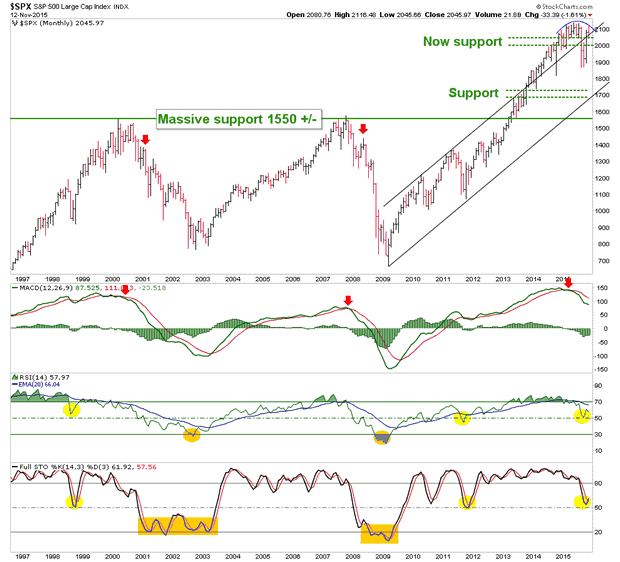
Indeed, let’s end the piece by going from one extreme (hourly) to the other (monthly). This chart included in NFTRH 368 kept me in my bearish positions, even though they had been losing me money on paper (but are now very green, I am happy to say). That dome on SPX’s head and the bearish MACD kept me in the game and not out thinking myself. But there is more work to do, because the other more sensitive momentum indicators could well be mimicking 1998 and 2011 as opposed to 2000 and 2008.
Since the market’s long flat-lining momentum drainage that finally resolved in the August decline, we have successfully gauged and managed every important turn. Down, bottom, bottom re-test, rally and now… the topping of the recovery rally.
I see no reason why people should try to predict how this situation will resolve on the big picture. Ongoing management like the ‘touchy feely’ hourly stuff we did and the daily parameters we are working now are good enough in order to be prepared at any given juncture. Eventually the weeklies and monthlies will make their signals as well. It’s a process folks. Consider joining us before NFTRH’s moderate price increase at year-end.
Subscribe to NFTRH Premium for your 25-35 page weekly report, interim updates and NFTRH+ chart and trade ideas or the free eLetter for an introduction to our work. Or simply keep up to date with plenty of public content at NFTRH.com and Biiwii.com. Also, you can follow via Twitter @BiiwiiNFTRH.


-
I know Mike is a very solid investor and respect his opinions very much. So if he says pay attention to this or that - I will.
~ Dale G.
-
I've started managing my own investments so view Michael's site as a one-stop shop from which to get information and perspectives.
~ Dave E.
-
Michael offers easy reading, honest, common sense information that anyone can use in a practical manner.
~ der_al.
-
A sane voice in a scrambled investment world.
~ Ed R.
Inside Edge Pro Contributors

Greg Weldon

Josef Schachter

Tyler Bollhorn

Ryan Irvine

Paul Beattie

Martin Straith

Patrick Ceresna

Mark Leibovit

James Thorne

Victor Adair