
Timing & trends
The following is part of Pivotal Events that was published for our subscribers March 3, 2016.
“Diminishing Liquidity”
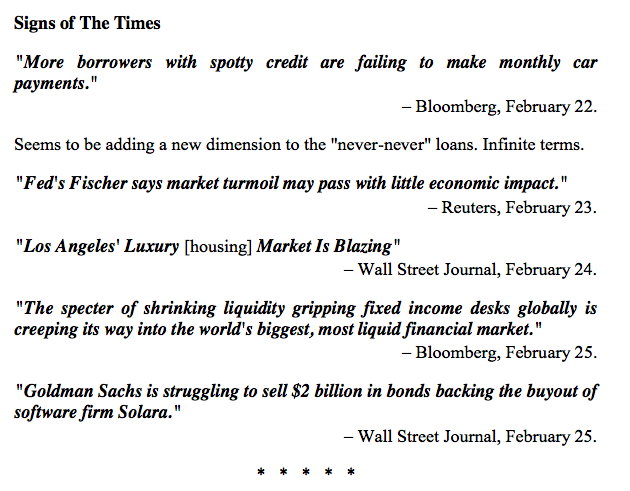
Perspective
Diminishing liquidity in what used to be the very liquid Treasury market continues concerning. Of course this is due to interventionists being able to drive nominal interest rates to exceptional lows. Real rates, as adjusted by CPI inflation, have declined on every great bubble since the first brewed up in 1720. In the 1873 extravaganza they declined to minus 9 percent. In the 1825 example it was to minus 6 percent. For consistency, these are in the senior currency.
It should be emphasized that through financial history the record has been that once speculation has been pushed far enough the senior central bank has had little influence upon the yield curve, credit spreads and real long-dated interest rates.
Flattening and spread-widening have been the feature since June and at times the moves have unsettled equity markets. Despite all the talk about changing the Fed rate, credit markets reversed to contraction mode.
This suggests that when the serious move in real rates gets underway it will overwhelm the radical experiment in nominal rates.
With the last contraction, which is a polite way of describing the 2008 Crash, real long rates increased from minus 1.5 percent to 6 percent. The rise of over 7 percent was described as the worst financial calamity since the 1930s. The Great Recession.
As that eased rates decline to minus 1 percent in 2011. At around 3 percent now, the increase amounts to 4 percentage points. Let’s call this modest distress. Beyond an 8 percentage point increase would be serious.
However, the typical increase in real rates in the severe post-mania collapses has been 12 percentage points. This is possible.
The abuse of credit markets by financial adventurers at central banks, academe and Wall Street has been without precedent.
It needs correcting.
As a wrap, if policymakers really wanted to improve liquidity in the Treasury market they could end the arbitrary standard and make the US dollar convertible.
Stock Markets
On the nearer term, our target on the S&P has been the 50-Day moving average when it was at 1949. Last week we thought that a target had been accomplished and that a setback was possible. The decline in the VIX was enough to register a Spring Board Buy. Some 20 percent of these do not work and this one did not.
So we are back to riding the rally that was likely to run into March.
Banks (BKX) have rallied from 56 in early February to 64. The 50-Day at 67 has been the target. This and a high 60 on the Daily RSI could complete the rally.
Broker-Dealers (XBD) have accomplished much the same on the rally from 135 to 155. The 50-Day is at 156, which is doable. The Daily RSI in the high 60s would be a caution.
Base metal miners (XME) have been outstanding with a rally from 11.38 in mid-January to the 18 level. This has had two constructive steps, but yesterday’s jump from 17.55 to 18.32 shows short covering. The action is getting compulsive.
There is substantial resistance at the 20 level. The 200-Day is at 18.60. And the Daily RSI clocked a huge swing from 25 in January to 77. This is the level that has stopped all rallies on a chart back to 2006.
It is a percentage blessing and it is time to take some money off the gaming table.
Action in the Oil Patch (XLE) has been modest but constructive. The low was 50 in mid- January and it has worked its way to above the 50-Day at 57. Now at 59 it needs to get above resistance at 62 to extend the rally.
The overall market (NYA) has recovered from 8937 in January to 9865. There is a tested low in and this week the index got above the 50-Day. Action is constructive and there is resistance at 10300.
Golds (HUI) have jumped from 99 to 172 and will be reviewed below.
On the bigger picture, we used NYSE margin debt and breadth to remain positive until June. In May we used the Dow Theory to conclude that the bull market was ending. In July we used the curve and spreads to conclude that the bear was starting. Also in July the Chartworks got the third set of Upside Exhaustions needed to end the Shanghai Bubble.
This is a rally within a cyclical bear market.
Precious Metals
Our February 18th Pivot noted that the action had become impetuous. Everybody suddenly wanted in. The swing in the Daily RSI on the HUI was so outstanding that it even showed up in the Weekly chart.
The HUI low was 99 on the January hit. In reaching 173 today the gains have been outstanding. The latest enthusiasm is the “Golden Cross” whereby two moving averages – well – cross. The ChartWorks has a thorough study and the results have not been consistent.
The Daily momentum high was two weeks ago, the price high could be set soon. A consolidation of some weeks would be constructive.
The gold/silver ratio is again acting as the metallic credit spread.
A key low was set at 60 in June 2014 as the key low in credit spreads was set. Both have been “widening” since with the GSR now out to 84. On the same move, the “CCC” spread has widened from 7.91 to 21.68.
Both have further to go on this credit cycle.
Our target on the gold/silver ratio has been “around 100”.
Link to March 4, 2016 Bob Hoye interview on TalkDigitalNetwork.com:
http://talkdigitalnetwork.com/2016/03/us-dollar-drop-raises-loonie/
BOB HOYE, INSTITUTIONAL ADVISORS E-MAIL bhoye.institutionaladvisors@telus.net WEBSITE: www.institutionaladvisors.com
Listen to the Bob Hoye Podcast every Friday afternoon at TalkDigitalNetwork.com

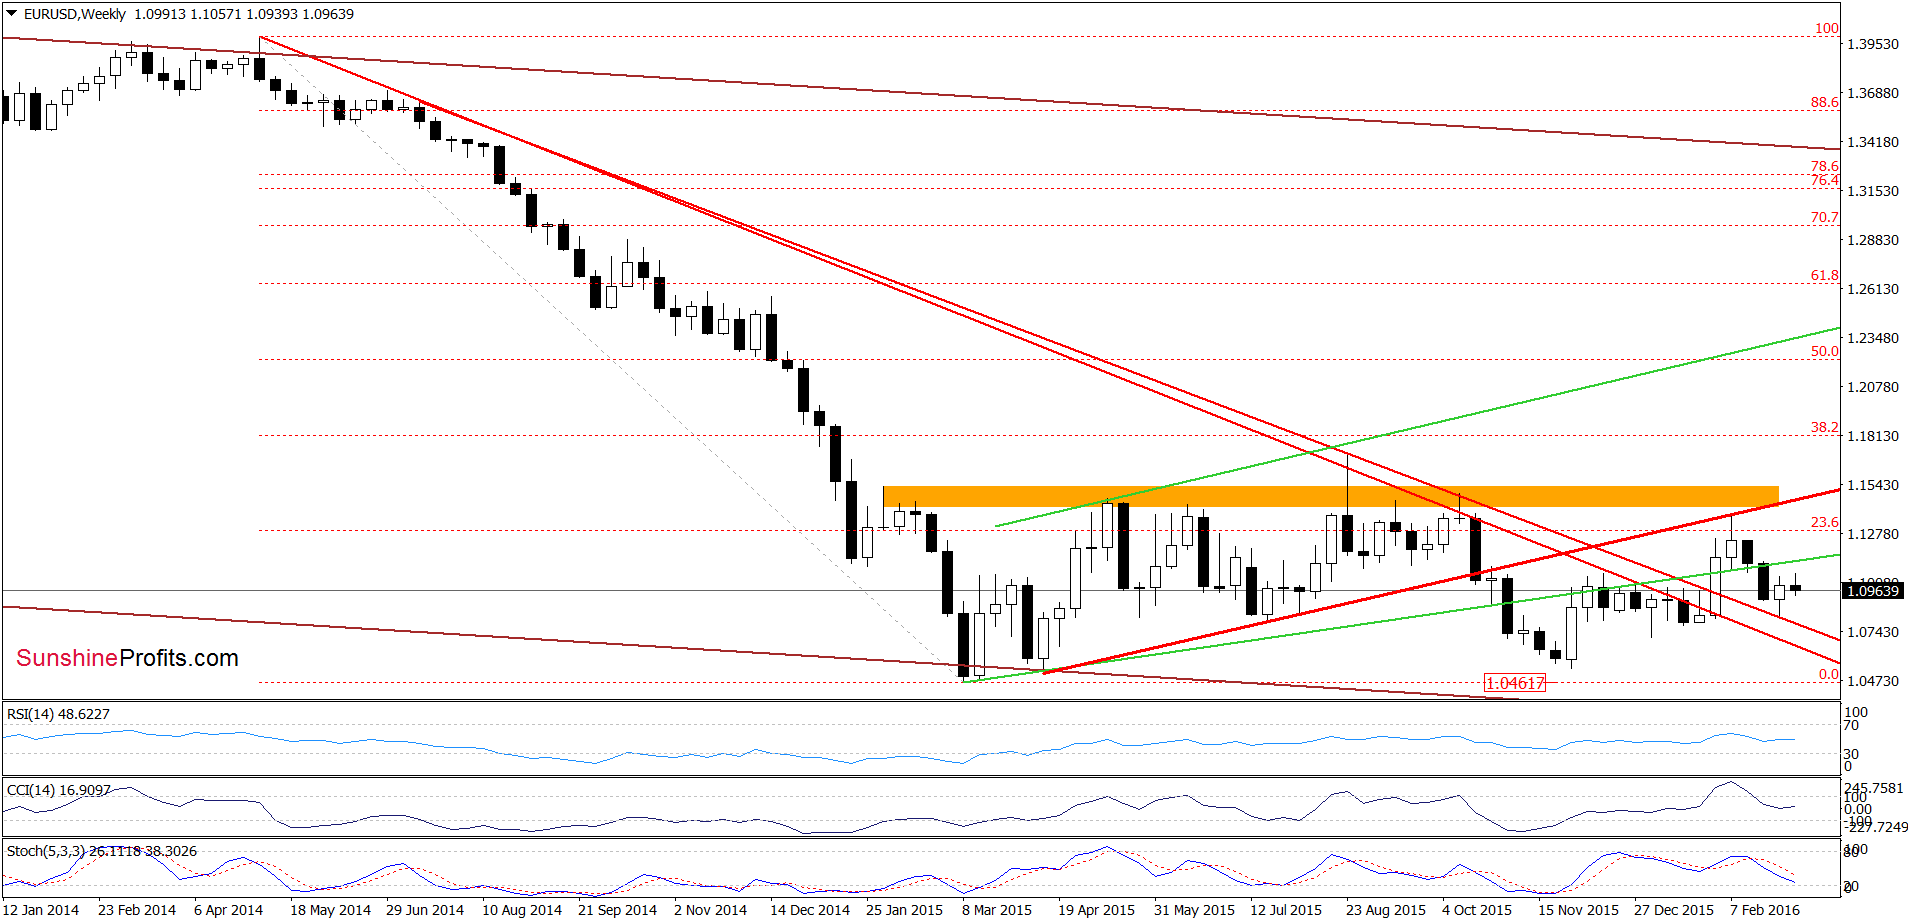
Earlier today, the euro declined against the U.S. dollar once again as uncertainty around today’s ECB decisions continues to weight on the European currency. Thanks to these circumstances, EUR/USD dropped under the barrier of 1.1000. Will we see a test of the recent lows in the coming days?
In our opinion the following forex trading positions are justified – summary:
- EUR/USD: short (stop-loss order at 1.1512; initial downside target at 1.0572)
- GBP/USD: none
- USD/JPY: none
- USD/CAD: none
- USD/CHF: none
- AUD/USD: none
EUR/USD

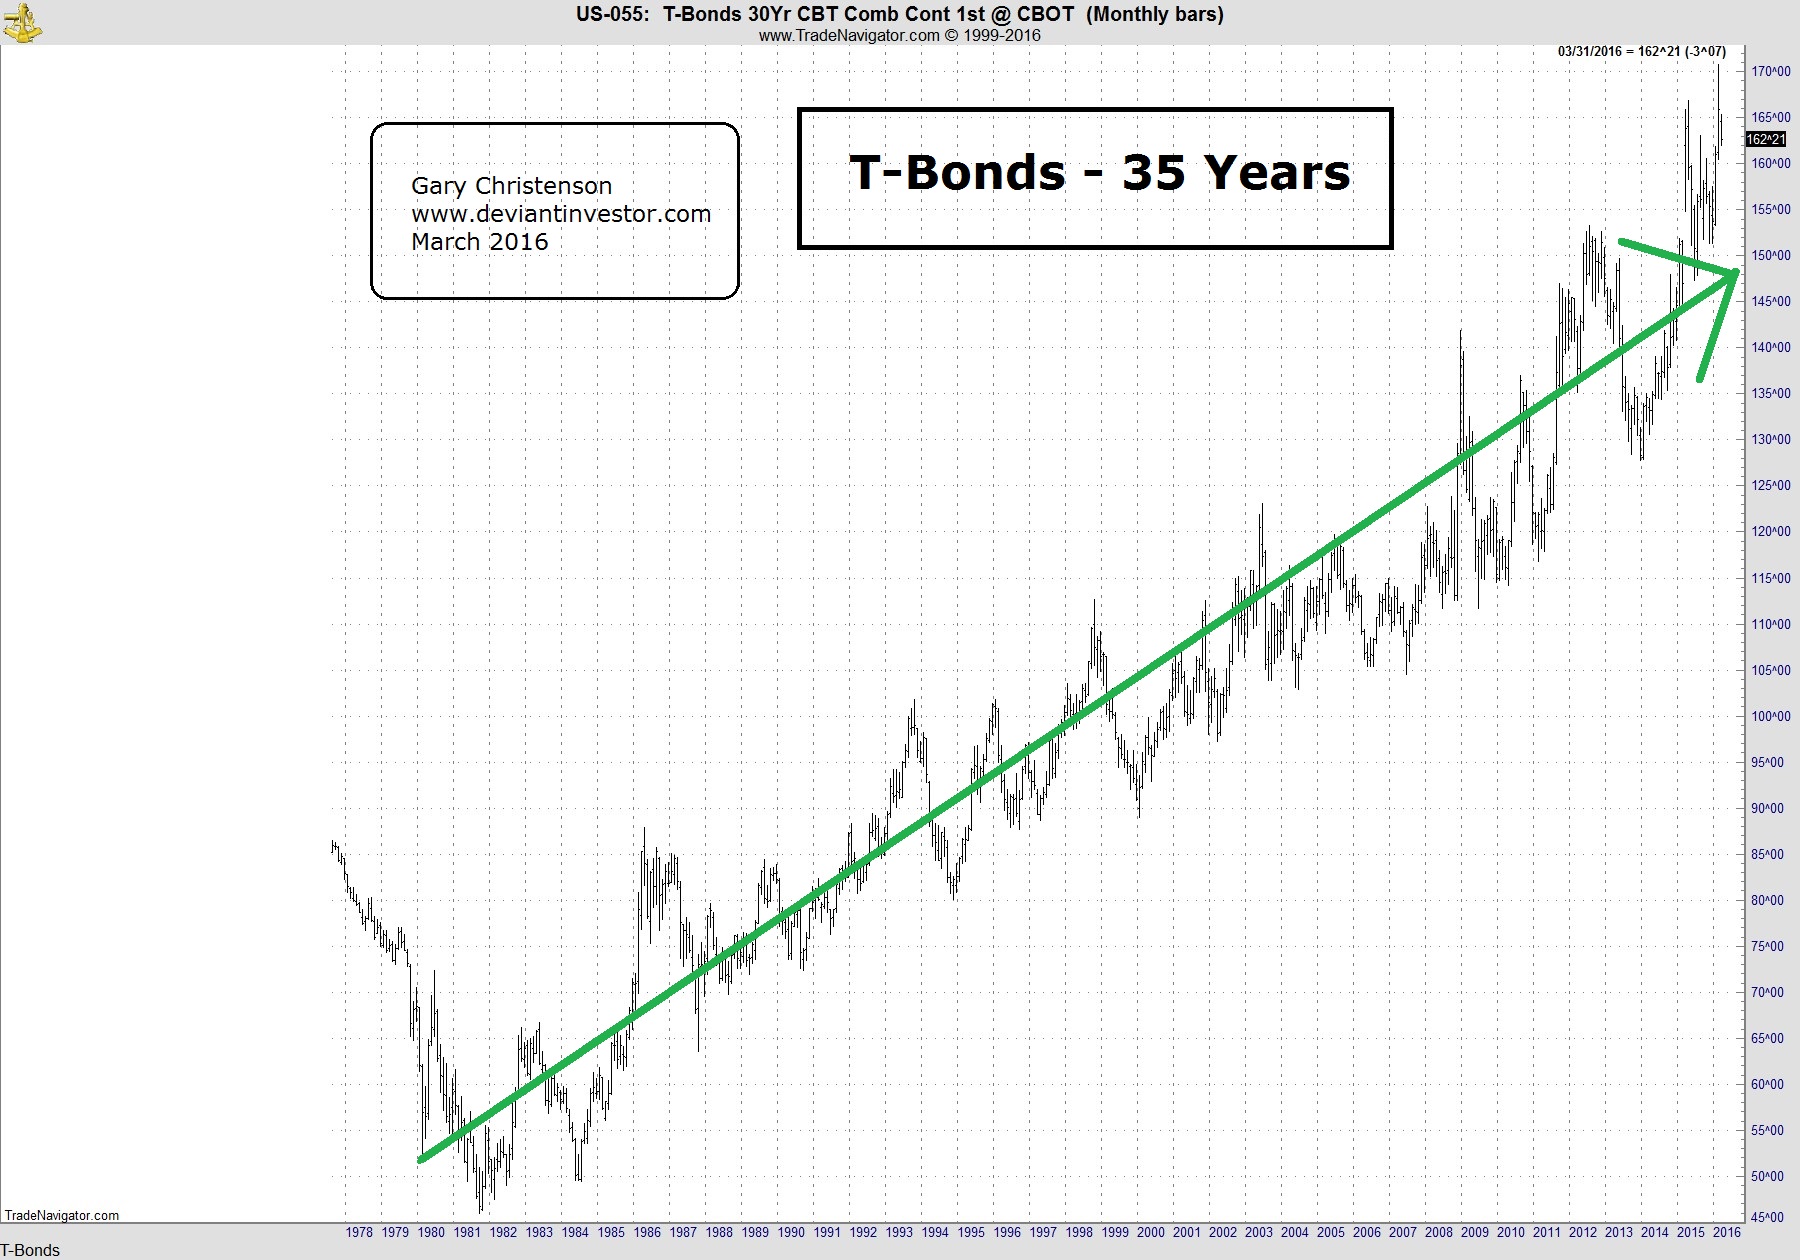
There is money to be made so the game must be played… It’s always “ShowTime” in the financial markets. What is the game plan?
Levitate the bond market. See chart below. Keep those interest rates dropping so the bond market continues its 35 year climb. Oops – $7 Trillion in bonds with negative interest rates, at last count, with more from Japan this week. Have we reached a limit? Probably not, but what could go wrong lending money to insolvent governments who guarantee they will return less than they borrowed in 10 years?
Currencies must retain some purchasing power. No Argentina or Zimbabwe devaluations will be allowed. When the dollars/euros/yen/pounds barely buy groceries the crowds will get restless and that must be avoided. So keep the currencies strong – which is code for devalue them slowly enough that people don’t riot. Remember when you could deliver a baby in a hospital in the U.S. for under $100? Really! It was a long time ago and the dollar has devalued considerably since then.
Increase debt exponentially. The bubbles must not implode and that requires continual inflating and massively more debt each year. What could go wrong with exponential debt increases? Hint: One penny invested at 6% per year for 1,000 years exponentially grows to $200,000,000,000,000,000,000,000. (Yes, really!) Exponential growth of debt mathematically cannot continue forever.

Allow gold to increase in price slowly, BECAUSE IT MUST, but fight it every step of the way. They own the media, the markets, and the High-Frequency-Traders so they use them to discourage gold purchases and promote paper debt, paper stocks, paper bonds, and digital bank accounts. Sell the paper story – HARD!

Keep the churn in play. Take your slice of every transaction, every credit card charge, every debit card transaction, and bring in the “big guns” to sell the “war on cash” so all those unbacked fiat currencies remain in digital form in a bank – easy access you know …….
The next crisis will be funded by depositors. Yup, that means us. But it can’t happen in my country …… Don’t be naïve!
Distractions are critical. Elect a president every four years, as if it matters. How about a war in Syria? A terrorist attack in some major city? Zika virus? A Kardashian scandal? Russia on the move? Chinese market crash? Don’t forget to blame someone else, and keep the money churning!
Play your own game, exit the “digital money churn,” and reduce your “financial paper footprint.”
Watch Tom Cloud’s latest market commentary – a short video.
Stack gold and silver. You can buy from Tom Cloud and Why Not Gold.
Gary Christenson
The Deviant Investor

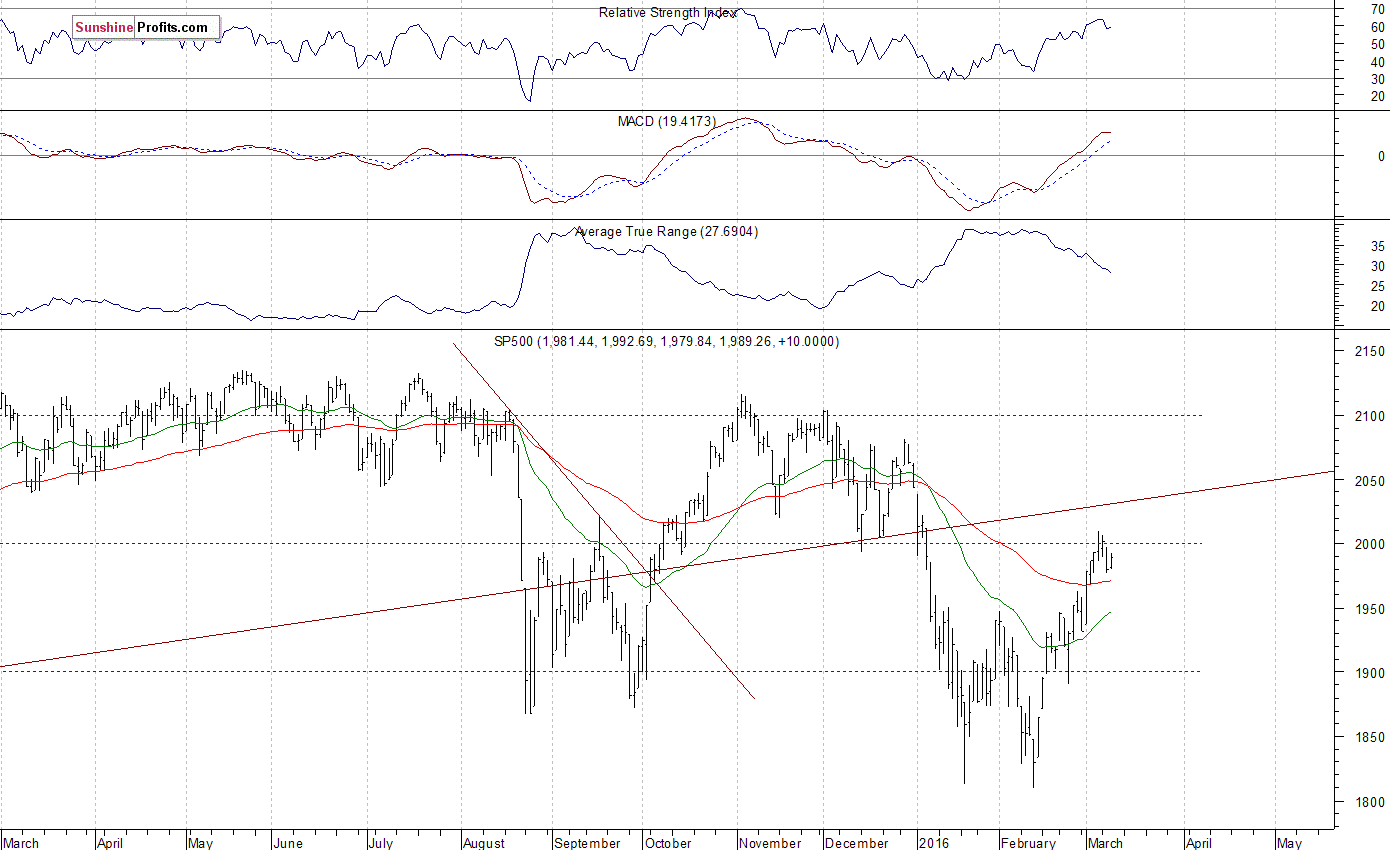
Briefly: In our opinion, speculative short positions are favored (with stop-loss at 2,050, and profit target at 1,900, S&P 500 index).
Our intraday outlook is bearish, and our short-term outlook is bearish, as we expect a downward correction or short-term uptrend’s reversal at some point. Our medium-term outlook remains bearish, as the S&P 500 index extends its lower highs, lower lows sequence. We decided to change our long-term outlook to neutral recently, following a move down below medium-term lows:
Intraday outlook (next 24 hours): bearish
Short-term outlook (next 1-2 weeks): bearish
Medium-term outlook (next 1-3 months): bearish
Long-term outlook (next year): neutral

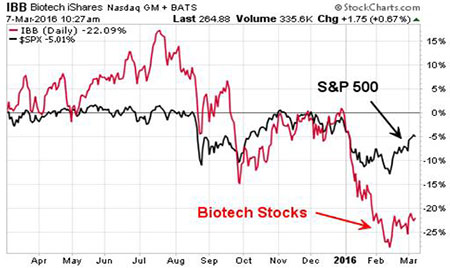
Last March, I told you to sell biotech stocks.
The sector was coming off one of its biggest bull runs in history. From March 2012 to March 2015, the biotech sector outperformed the S&P 500 by 128%.
Following this surge, the IBB biotech ETF traded at 50 times earnings. It was also trading near 10 times book value. These valuations were close to 10-year highs.
Plus, our politicians were targeting the industry because prices for most biotech drugs surged over the past few years. I knew this would lead to tons of negative headlines as we pushed into the election year.
If you followed my lead and cashed out of your biotech stocks, you likely saved a lot of money. The IBB biotech ETF plunged 22% since my call. To compare, the S&P 500 index is only down 5% in the same time frame.
Some industry professionals suggest buying biotech stocks on this dip. But my advice is to stay away. There are still plenty of headwinds that will likely push biotech stocks much lower through 2016.
Let me explain …
The run in biotech stocks was nothing short of impressive. Some say the surge in the sector from 2012 to 2015 was based on momentum. Yet, there were also fundamental catalysts that drove most stocks in the industry to all-time highs.
For example, the U.S. Food and Drug Administration was approving new drugs at its fastest pace in nearly two decades. Once a drug receives FDA approval, the company is allowed to sell its product to consumers. That means the company will begin to generate revenue and, eventually, profits.
Plus, we saw technological breakthroughs in areas like immunotherapy, life sciences and orphan drugs (used to treat rare diseases). This led to huge investments into early stage biotech companies.
Cash was also pouring into the industry from large-cap healthcare giants.

Big Pharma companies like Pfizer (PFE), Merck (MRK) and GlaxoSmithKline (GSK)were losing hundreds of billions of dollars in revenue over the past few years as the patents expired on some of their blockbuster drugs.
To stem the bleeding, they invested (through partnerships and directly) into biotechs with promising technologies. These catalysts helped push biotech stocks to all-time highs early last year.
Today, the industry is under attack.
Democratic presidential candidate Hillary Clinton recently spoke about the recent price hikes on specialty drugs. She promised to lay out a plan to help lower drug costs if elected president.
Janet Yellen also chimed in. The Fed Chair said valuations on small biotech stocks are “substantially stretched.” This followed similar comments from N.Y. Fed President William Dudley, who warned about a possible correction in the sector.
These negative comments from political figures are not expected to go away. After all, we are in an election year. And it’s much easier for our potential presidential candidates to trash the biotech industry (in an effort to gain more votes) than go on record for supporting higher drug prices for elders.
Plus, the catalysts that helped push the industry higher over the past few years are starting to wane.
For example, sales from Big Pharma companies are projected to decline sharply from past years. That could result in fewer investments into biotech companies. And the number of new biotech IPOs (initial public offerings) declined by 30% from 2014 to 2015.
Most biotech stocks, despite the recent sell-off, are also still expensive.
Sure, you could buy the best-of-breed names like Biogen (BIIB) and Amgen (AMGN)while they are trading under 20 times earnings.
But many small- and mid-cap names are trading at risky levels. This explains the massive sell-offs we’ve seen this year in names like Sarepta Therapeutics (SRPT), Alkermes (ALKS) and Celldex Therapeutics (CLDX). These companies got crushed after clinical trials fell short of expectations.
Biotech stocks are a risky sector to invest in right now. Despite the recent sell-off, most names are still not cheap. Plus, a lot of the catalysts that fueled the sector’s bull run are waning. And the negative headlines from politicians are likely to get much worse throughout the election year.
This will likely put even more pressure on biotech stocks at least over the next six months.
Good investing,
Frank Curzio

-
I know Mike is a very solid investor and respect his opinions very much. So if he says pay attention to this or that - I will.
~ Dale G.
-
I've started managing my own investments so view Michael's site as a one-stop shop from which to get information and perspectives.
~ Dave E.
-
Michael offers easy reading, honest, common sense information that anyone can use in a practical manner.
~ der_al.
-
A sane voice in a scrambled investment world.
~ Ed R.
Inside Edge Pro Contributors

Greg Weldon

Josef Schachter

Tyler Bollhorn

Ryan Irvine

Paul Beattie

Martin Straith

Patrick Ceresna

Mark Leibovit

James Thorne

Victor Adair