
Energy & Commodities
 The stubborn spot price of uranium has frustrated market watchers for the past year. But that’s not the whole story. As most long-term contracts have been made at higher prices, astute investors have been slowly moving into the stocks of uranium producers and explorers in anticipation of the delayed commodity price move expected in 2014. In this interview with The Energy Report, Cantor Fitzgerald Canada Metals and Mining Analyst Rob Chang explains what lies ahead and how the turnaround in the uranium market will benefit the companies he thinks investors should focus on for maximum profits.
The Energy Report: During your last interview in January, you, along with many analysts, were expecting that 2013 was going to be the turnaround year for the uranium market. With the current price hovering around $35 per pound ($35/lb), what’s it going to take to get this market moving?
Rob Chang: The uranium spot price has not moved as quickly as we were forecasting. However, uranium equities have shown some strength over the past year or so, as investors started buying ahead of the uranium spot price moving. Spot prices depend more on utilities and their short-term requirements, which translates into their activity in the spot market. However the spot market accounts for a small portion of the total market. Most transactions occur in the long-term prices, and the long-term contract price is at a healthier level in the $50/lb range. We believe the uranium spot price is currently below the marginal cost of production and therefore unsustainable, as half the producers around the world are losing money.
What’s really going to drive the price higher is utility demand. Most utilities will go back into the market at some point to buy more material. We expect that will happen later this year or early next year. For this year, we’re forecasting roughly flat to slightly higher prices if buying activity does heat up, and a much higher price next year, starting in Q1/14 or Q2/14, depending on how quickly utilities move. We are very bullish and forecasting an average 2014 uranium spot price of $49.50/lb. Investors primarily focus on spot prices, but they really should be looking at the long-term price instead.
TER: On August 21, the Russians made their final shipment of LEU (low enriched uranium) under the Megatons to Megawatts HEU Agreement. This was one of the milestones many were looking for as a positive market catalyst. Is this going to help the market?
RC: This eventuality has been baked in for four or five years now, but the generalist investors who don’t focus on resources may see this as an important milestone and start looking at uranium.
TER: What other market developments have you seen since we last spoke that give you hope for salvaging 2013 as a turnaround year for uranium? Or are we now looking forward to 2014?
RC: 2014 is really when we’ll start seeing some meaningful developments that would move the market, barring an earlier-than-expected announcement from the Japanese government. Since we last chatted, the Japanese government’s Nuclear Regulatory Agency (NRA) has been established and is evaluating applications for 10–12 reactors to be turned on, or at least being approved by this year. We would be surprised to see any this year and at most we think up to three might be turned on this year. We think the majority of the restarts are really going to happen next year. Our forecast is that of the 50 reactors in Japan, about two thirds, will be turned back on at some point over the next two or three years. That’s certainly going to be a positive catalyst.
I don’t see any other major catalysts on the horizon between now and then. The equity markets generally lead the fundamental supply and demand numbers, and we’ve seen some opportunistic investors start to pick away and show some interest in the space. So in the last few months of this year, we do expect the equities to start leading the way prior to the uranium spot price actually moving.
TER: How about the situation in China?
RC: China has the largest nuclear buildup program in progress right now. Russia also has very extensive plans to build more reactors. The United Arab Emirates (UAE) has plans for building nuclear reactors, which sends an important signal to the market. As one of the most oil-rich countries in the world, it could probably power itself with oil, yet is looking to diversify into nuclear. I think that’s a fantastic sign. So we certainly are looking forward to seeing developments.
TER: What do you see going on with specific companies that might create some activity in the stocks?
RC: Starting off at the top with the largest publicly traded company, Cameco Corp. (CCO:TSX; CCJ:NYSE)is putting Cigar Lake into production. Several years ago we were wondering whether Cigar Lake would even start, and now it’s in the early stages of going. Cigar Lake has a major impact on future supply. With the HEU Agreement coming off, one of the new projects that was supposed to make up the difference is Cigar Lake. How well Cameco can ramp up production will be a very key topic for us, but we are still very bullish on the company. We do cover the stock with a Buy recommendation and we use a conservative 14x forward cash flow multiple to arrive at our $26.50 target price. Historically, Cameco has traded at 15x cash flow. Once there is interest returning to the uranium space, we believe Cameco will probably trade at its historical multiple, pricing it closer to the $30 range.
Another investment that we are bullish on is Uranium Participation Corp. (U:TSX), which is more of an investment portfolio that holds physical U3O8 and UF6. This gives investors full exposure to the commodity without any of the possible operational or geopolitical risks associated with miners. So we are very positive on that and do note that it’s currently trading around par to its net asset value. Historically, it has traded at a slight premium, given that investors tend to buy the portfolio in advance of expected increases in the spot price.
Moving to the explorers, outside of Cameco and AREVA (AREVA:EPA), the next impressive land package in the Athabasca is held by Denison Mines Corp. (DML:TSX; DNN:NYSE.MKT). Its high grade Phoenix discovery at its Wheeler River project is arguably the highest grade uranium project in the world, and has every indication of becoming a world class project. On top of that, it also either owns entirely, or has significant pieces of assets surrounding Rio Tinto Plc’s (RIO:NYSE; RIO:ASX; RIO:LSE; RTPPF:OTCPK)Roughrider project, for which it acquired Hathor Exploration Ltd. in a battle with Cameco.
If Rio Tinto is going to make a go of it in the Athabasca Basin, it probably needs to expand its footprint there because Roughrider’s 70+ million pounds (7+ Mlb) is not large enough to move the needle for a company of its size. Including the mineralization and resources surrounding Hathor, you’re probably in the 100–130 Mlb range with growth potential. If Rio Tinto is to be aggressive in this space, it would probably have to buy Denison to consolidate its position in the basin. It also has valuable mill access. Cameco is already the juggernaut in the region and could opt to consolidate its land position in the Athabasca and, if it wanted to make a strategic move, push Rio Tinto out. If Roughrider is not large enough to be economic, and if Cameco ties up everything around it, Rio Tinto could decide to pack up and leave.
TER: What about some of the smaller players?
RC: Ur-Energy Inc. (URE:TSX; URG:NYSE.MKT) is a company that just started production. We visited its Lost Creek mine and were very impressed with what we saw. It has a management team from large world-class producers, bringing the best of all worlds into one project. Reaching producer status should provide a valuation bump, especially since it’s a low cost, in situ recovery (ISR) operation in the U.S. Given that the U.S. requires about 50 Mlb of uranium and only produces 5 Mlb domestically, any incremental production in the U.S. should be valued at a premium in light of domestic security-of-supply considerations. Ur Energy is a very attractive company.
Another U.S. producer we’re following is Uranium Energy Corp. (UEC:NYSE.MKT). Although we do not cover it, we do note that it is a low-cost ISR producer in Texas and believe that it should deserve a premium pricing for the same reasons as Ur-Energy.
We also cover Energy Fuels Inc. (EFR:TSX; EFRFF:OTCQX), which is the second largest producer of uranium in the U.S. and probably has the best story leveraged to the uranium price. It currently produces only about 1 Mlb/year, by design, with several mines that can be turned on relatively quickly. We estimate that it could quickly turn on anywhere between 2–5 Mlb more in annual production once prices get to attractive levels. On top of that, it also has the White Mesa mill that it acquired from Denison, located in Blanding, Utah, which is the only conventional mill in the U.S. Having mill access is extremely important because you effectively cannot produce your final product without it. Energy Fuels has a monopoly position with a conventional mill and it can even make money by processing material on a toll basis for other producers. We believe that this is a very attractive company for those who believe that the uranium price will head higher.
Moving further down the chain, we like the 50/50 Fission Uranium Corp. (FCU:TSX.V) and Alpha Minerals Inc. (AMW:TSX.V) joint venture of Patterson Lake South in the southwest corner of the Athabasca Basin. This is probably the most exciting story in the uranium space right now, in terms of news flow and stock price movements. Even though it doesn’t have a resource yet and it’s less than a year old because the initial discovery was in November, the drill results that have been produced to date point to a potentially world-class project. There are currently four zones identified. Based on drilling results and our analysis of the assays to date, our back-of-the-envelope calculation estimates about 50 Mlb at that project already, with significant upside potential. So we’re very excited about seeing the development of this likely world-class project.
Recently, Fission Uranium and Alpha Minerals announced an LOI by which Fission will acquire Alpha for 5.725 shares of Fission for 1 share of Alpha ($7.67 per share of Alpha). We believe this is an excellent outcome for shareholders of both companies as it unlocks the potential for the acquisition of Patterson Lake South by either Cameco or Denison now that the ownership structure has been cleaned up. In addition, shareholders of each company will receive shares in spincos for the respective companies. This will unlock the value of the portfolio of assets Fission and Alpha are currently holding, which the market is assigning zero value to currently.
TER: What else are you looking at and liking?
RC: We like Kivalliq Energy Corp. (KIV:TSX.V), located in Nunavut. It has the highest grade deposit outside the Athabasca Basin and an impressive land package with several highly prospective conductors. We’ve visited the property twice now and have been impressed with the area potential, although Nunavut does present some infrastructure challenges. It will probably need a large resource to be economic; however, we do believe that it does have that potential. The management team has been very cost-effective in identifying resources, which is very impressive. We believe Kivalliq is a very good value play for someone looking a little longer term.
Another notable company is U3O8 Corp. (UWE:TSX; UWEFF:OTCQX), a consolidator of South American uranium assets. It has some interesting developments in Argentina and seems to be getting things in place with the potential for a low-cost, low-grade, open pit operation. Its flagship Berlin project is located in Colombia and has the potential to be of decent size with decent grades as well. Its other asset is in Guyana, giving it three decent assets that all have the potential of being developed, once prices get better. We continue to monitor the progress of U3O8 Corp.
Circling back to Patterson Lake South, one company that catches our attention, although it’s a little too early to say much about it other than we do like where it sits, is NexGen Energy Ltd. (NXE:TSX.V). NexGen sits northeast of the Fission/Alpha Patterson Lake South project, and we believe that it probably has the best prospects for hosting similar, if not the same mineralization, that Fission and Alpha are currently drilling.
Of all the plays in that area, we’re particularly interested in NexGen’s property as well Azincourt Uranium Inc. (AAZ:TSX.V), which is a little to the north of the Patterson Lake South project, as it may host a parallel structure. So both of those seem interesting to us, though a little more speculative.
TER: What strategy do you think investors should be using at this point to try to get maximum return in the uranium space?
RC: The first movers will always be the larger companies, so investments in Cameco, Uranium Participation Corp. and Denison will probably be the most obvious and first to move. Those who are looking for a little more upside torque with a little more volatility would certainly be interested in seeing the Fission/Alpha story given that it has excellent drill results. Those looking for something in between could look to Ur-Energy or Energy Fuels, given that they’re both producers. They have slightly higher costs and should see a meaningful increase in their share prices once uranium prices go higher.
TER: We appreciate your time and thoughts today, Rob.
RC: Thanks again.
Cantor Fitzgerald Canada Metals and Mining Analyst Rob Chang has covered the metals and mining space for over eight years for the sell-side and the buy-side. Prior to Cantor, Chang served on the equity research teams at Versant Partners, Octagon Capital and BMO Capital Markets. His buy-side experience includes managing $3 billion in assets as a director of research/portfolio manager at Middlefield Capital, where his primary resource portfolio outperformed its direct peer and benchmark by over 28% and 18%, respectively. He was also on a five-person multi-strategy hedge fund team, where he specialized in equity and derivative investments. He completed his Master of Business Administration from the University of Toronto’s Rotman School of Management.

Last week, after the Fed said it would stick to its stimulus plan for now, the yellow metal gained more than 4%, leading the rally in commodities, and rose to a new one-week high. At the same time crude oil extended earlier increases and finally gained over 2% on Wednesday. However, during this euphoric rally, investors overlooked that it was fueled by a weaker economic outlook from the Fed. Therefore, the improvement didn’t last long and we saw a quick profit-taking during the last two sessions of the week. In this way, gold gave back almost 60% of the previous sessions’ gains and dropped to $1,325 an ounce on Friday. What’s interesting, at the same time light crude has declined sharply, erased all September’s gains and reached a new week low.
Taking the above into account, investors are probably wondering: which of these commodites should I choose? Which has a better upside potential in the near term? Can we find any guidance in the charts? Let‘s take a look at the charts below and try to find asnwers to these questions. We’ll start with the weekly chart of crude oil (charts courtesy by http://stockcharts.com.)
On the above weekly chart, we see that after three unsuccessful attempts to break above the strong resistance zone based on the March 2012 top and the upper border of the rising trend channel, oil bulls lost their power.
Just like in the previous week, oil bears noticed the opportunity to go short and triggered another corrective move, which pushed the price of crude oil slightly above the September low. On Monday, we saw further deterioration and light crude dropped to its lowest level since August 5.
From this point of view, the situation is somewhat mixed. On the one hand, crude oil still remains in the upper part of the rising trend channel, which is a bullish factor. On the other hand, three unsuccessful attempts to break above this level resulted in a decline to a new September‘s low, which doesn’t look so bullish. In spite of these facts we should keep in mind that the recent decline in light crude is just slightly bigger than the previous ones in the entire April-August rally.
Once we know the current medium-term outlook for crude oil, let’s take a closer look at the chart below and check the link between crude oil and gold. Will gold lead oil higher?
That’s still not likely. Looking at the above chart, we see that the connection between light crude and gold has changed in the recent days. Although, we saw a clear negative divergence earlier this month, both commodities moved pretty much in the same direction in the previous week.
They declined together in the first half of last week and then rebounded on Wednesday after the FED‘s statement. This improvement didn’t last long anyway, and in both cases we saw a downward move in the following days. At this point it’s worth mentioning that the recent decline took crude oil to a new week low, but we didn’t see such price action in gold, which means that the yellow metal was stronger in relation to light crude.
Summing up, although crude oil erased all September’s gains and reached a new month’s low, we should keep in mind that the recent decline in light crude is just slightly bigger than the previous ones in the entire April-August rally and the uptrend is not threatened at the moment. At the same time, the downtrend in gold remains in place. Consequently, at this time – and taking the short term into account – it seems that crude oil has greater upside potential than gold does.
Thank you.
Nadia Simmons
Sunshine Profits‘ Crude Oil Expert
Disclaimer
All essays, research and information found above represent analyses and opinions of Nadia Simmons and Sunshine Profits’ associates only. As such, it may prove wrong and be a subject to change without notice. Opinions and analyses were based on data available to authors of respective essays at the time of writing. Although the information provided above is based on careful research and sources that are believed to be accurate, Nadia Simmons and his associates do not guarantee the accuracy or thoroughness of the data or information reported. The opinions published above are neither an offer nor a recommendation to purchase or sell any securities. Nadia Simmons is not a Registered Securities Advisor. By reading Nadia Simmons’ reports you fully agree that he will not be held responsible or liable for any decisions you make regarding any information provided in these reports. Investing, trading and speculation in any financial markets may involve high risk of loss. Nadia Simmons, Sunshine Profits’ employees and affiliates as well as members of their families may have a short or long position in any securities, including those mentioned in any of the reports or essays, and may make additional purchases and/or sales of those securities without notice.
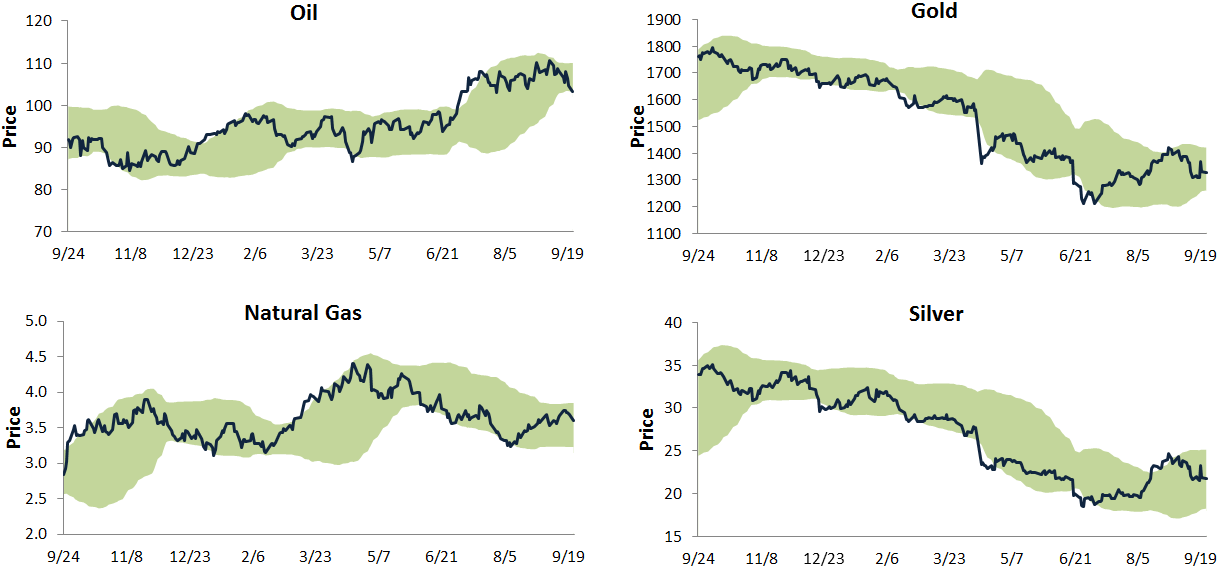
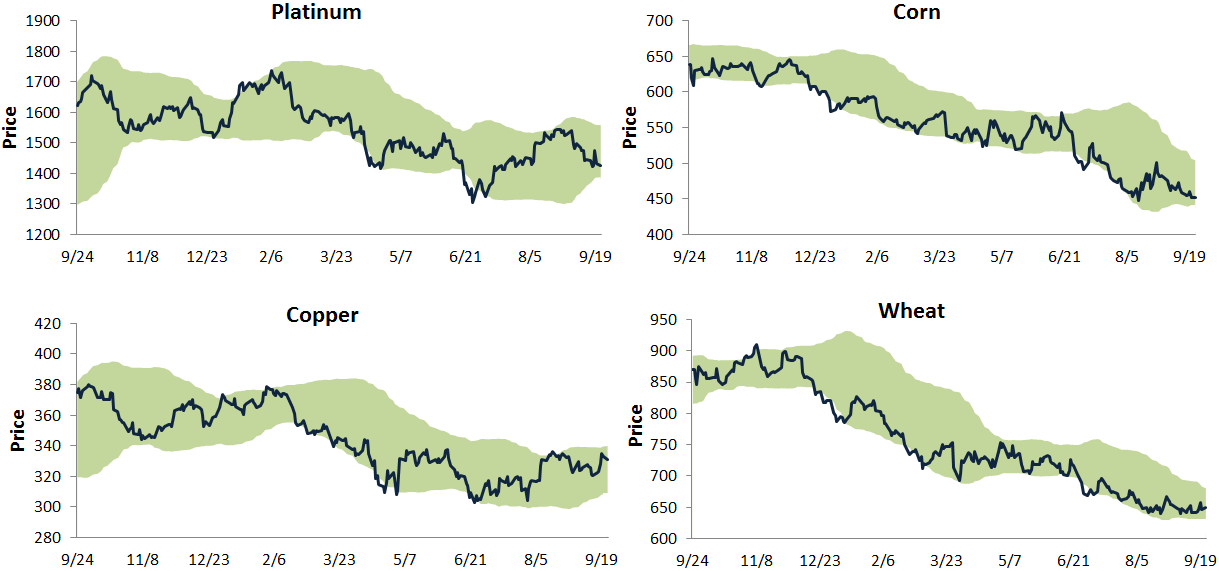
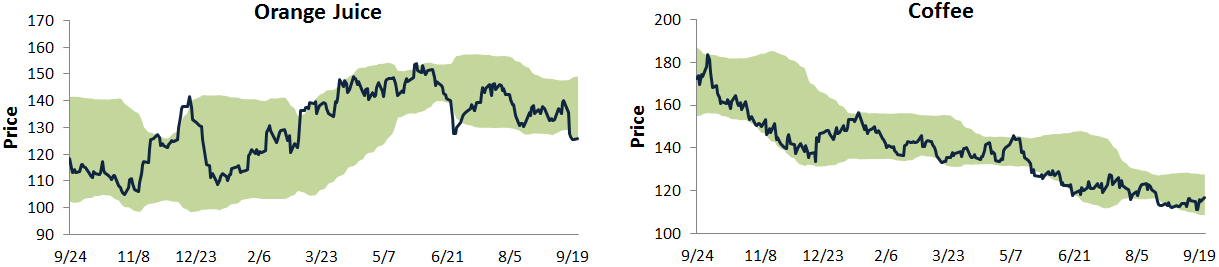
Below is an updated look at our trading range charts for ten major commodities. In each chart, the green shading represents between two standard deviations above and below the commodity’s 50-day moving average. Moves above or below the green zone are considered overbought or oversold.
Nine of the ten commodities shown have been in downtrends for quite awhile now, and oil — which had been in an uptrend — looks like it could join them soon with its most recent break down. The metals looked like they might be able to break out of their downtrends a couple of weeks ago, but they have pulled back recently. Corn, orange juice, wheat and coffee are all at the bottom of their trading ranges with not much upside in sight. It has been a rough year for the commodities asset class. Until these downtrends get convincingly broken, it’s going to be hard for portfolio managers to increase their allocations.
S&P 500 Percentage of Stocks Above 50-Day Moving Averages
The S&P 500 has pulled back about 1.5% from its all-time closing high last Wednesday. Below is a chart showing the daily percentage of stocks in the index trading above their 50-day moving averages over the last year. As shown, the reading is currently at 66%, but what’s telling is the fact that we’ve seen lower highs in the reading each successive time it has peaked so far this year. This means that participation by individual stocks has been dwindling as new market highs have been made. You’ve probably heard that this has become more and more of a “stock picker’s market,” and this chart bears this out.
….read & view more HERE
About Bespoke Investment Group


The Only Major Oil Basin Without A Horizontal Play (Yet)
If you were on the hunt for the next big horizontal oil play in the U.S., where would you be inclined to look?
Texas? That makes sense; Texas is the top oil producing state in the country.
California? That also makes sense, California has been a top oil producing state for decades.
But Illinois? Well, would you believe it has produced 4 billion barrels already, and 4 Tcf (that would be Trillion cubic feet) of natural gas?
It’s true. And now, there are rumblings of something very significant happening again in the Illinois oil patch–rumblings of a big horizontal oil play.
Companies in the region are keeping their cards close to their vest, but there is enough information in the public domain to know that some oil companies think the Illinois Basin’s New Albany Shale could hold a sizable shale prize. In fact, I’m very surprised we haven’t heard a lot more about this basin yet.
History of the Illinois Basin–It’s Right Under the Industry’s Nose
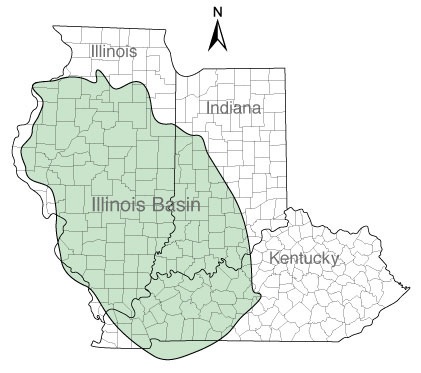
The Illinois Basin is an oval depression that’s roughly 60,000 miles in the United States Mid-Continent—southern Illinois, southwest Indiana and northwest Kentucky.
Drilling in the Illinois Basin goes back to 1853—and like many things, it was discovered accidentally; by drilling that was being done in a search for saltwater. (Early settlers needed saltwater for preserving food and agriculture.)
But it wasn’t until the early 1900s that the first Illinois basin oil boom truly occurred when well casings were used to manage all the water. (Most retail investors have no idea how much water the oil industry produces—it’s huge.)
In the 1930s a second boom started when seismic technology became available and helped to pinpoint oil pools.
This made oil a lot easier to find, and this oil boom lasted through the 1940s and 1950s. Production peaked in 1940 at 147.6 million barrels.
After World War II, production rates fell because all of the easy targets had been drilled. During the boom the Illinois basin was the third largest producing oil basin in the United States.
Since then production has declined with no new oil targets to drill.
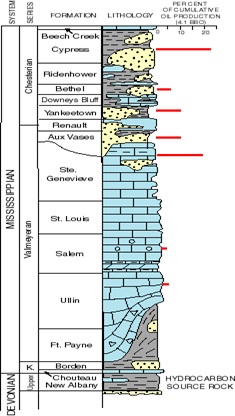
That historical production of 4 billion barrels of oil and 4 trillion cubic feet of natural gas was all done with vertical wells in old-style, “conventional” oil pools; not today’s shale or “unconventional” plays.
All that oil had to come from somewhere. Underneath all those conventional oil pools is the New Albany Shale—and oil and source rock analysis indicates that’s where the oil came from. Given the success of all these other shale plays in the US under very similar geology, those source rocks could provide a re-birth for oil production in a region that has been in decline for more than half a century.
The New Albany Shale Looks Just Like The Bakken
The New Albany Shale is Devonian age and was formed roughly 350 million years ago in a shallow sea that once covered the eastern half of the United States.
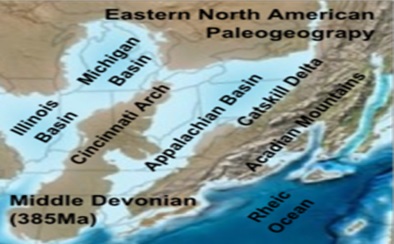
The New Albany Shale was formed at the same time as four other major U.S. oil resource plays that include:
-
The Williston Basin / Bakken Shale
-
The Anadarko Basin / Woodford Shale
-
The Appalachian Basin / Marcellus Shale
-
The Michigan Basin / Antrim Shale
So it was deposited at the same time as some of the most prolific source rocks in North America—that’s certainly a great pedigree! If the other source rocks have borne major horizontal resource plays why wouldn’t the New Albany Shale?
A 2002 study estimated that the New Albany Shale was deep enough to have generated up to 300 billion barrels of oil—that’s what the industry calls OOIP—Original Oil In Place.
With that much oil in place, the New Albany shale has the potential to be another big—very big—horizontal oil play–even if only a small percentage can be recovered.
That conventional production has come from 140,000 wells that were drilled into the Illinois Basin. 32,000 of those wells are still producing! The drilling and production from these wells have allowed oil companies sniffing around the New Albany Shale to gather a lot of evidence. The industry calls that “well control.”
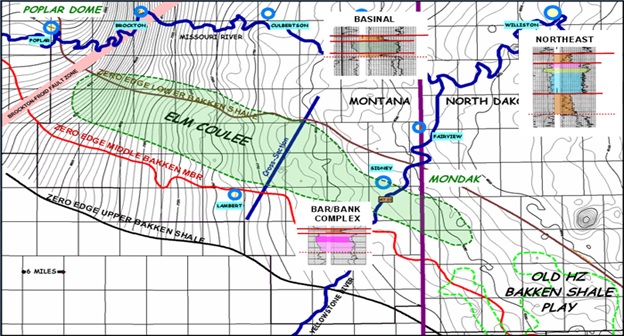
What these companies and their geologists have found has been encouraging as it has led them to conclude that the best analog for the New Albany Shale appears to be the Elm Coulee Bakken of Montana—which has produced 123 million barrels of oil from horizontal wells so far.
The New Albany and Elm Coulee are similar in age, porosity and size. No two shale plays are exactly alike, but there is good reason to believe that a short learning curve with horizontal wells could move the New Albany Shale from being a potential shale oil play to the real deal.
How The Play Gets Proved Up
The New Albany Shale is developing the same as the Bakken, Eagle Ford and other horizontal plays.
First you find a basin that has produced a lot of oil already. Step two: identify the source rock that still contains huge quantities of oil; usually a bit deeper. Step three then is to “crack the geological nut” and figure out how to get enough of that huge amount of oil left in those source rocks out at profitable rates—that requires fracking.
Step one and step two are already complete for the New Albany Shale. How close we are to step three is hard to tell.
The companies operating in the region have drilled a few wells, but the results have been kept very quiet to date.
Companies don’t promote bad results, and good results are kept even quieter since letting that information would immediately drive acreage prices through the roof.
What we know for sure is that the oil is in the ground in the New Albany Shale. Decades of conventional production tells us that.
What we also know is that enormous tracts of land have been leased over the past couple of years in the basin and we know that prices per acre have already at least quintupled over that time.
Someone wants to lock down that land.
Horizontal drilling combined with multi-stage fracturing may again be the miracle that releases the oil trapped in the New Albany Shale.
The potential of this play is exciting, and still quite early stage. And I just found the one junior explorer that has some incredible leverage to this new play.
Stand by for the details in my next article.
– Keith
P.S. Another new play with incredible leverage is an offshore producer I’ve been tracking for two years. It has the best growth profile of any junior in the world—because no other junior will have a bigger jump in production this year. Find out the full story on my #1 offshore oil pick, and how you can profit, here in my new research.
“I have started buying some sugar. I am not sure of how I got my timing right, I am never very good at it, but I am more bullish on agriculture. Some agriculture prices are very depressed. Sugar, for instance, in the western market is down over 75% from its all-time high
You are going to need to protect yourselves from currency debasement and currency decline. So think of real assets.”
Jim Rogers Blog HERE

-
I know Mike is a very solid investor and respect his opinions very much. So if he says pay attention to this or that - I will.
~ Dale G.
-
I've started managing my own investments so view Michael's site as a one-stop shop from which to get information and perspectives.
~ Dave E.
-
Michael offers easy reading, honest, common sense information that anyone can use in a practical manner.
~ der_al.
-
A sane voice in a scrambled investment world.
~ Ed R.
Inside Edge Pro Contributors

Greg Weldon

Josef Schachter

Tyler Bollhorn

Ryan Irvine

Paul Beattie

Martin Straith

Patrick Ceresna

Mark Leibovit

James Thorne

Victor Adair