Energy & Commodities

Scientific Breakthrough: In Nuclear Fusion

imagesNuclear fusion is rather different from nuclear fission. Fission, is the reaction currently used in nuclear power plants, and produces dangerously radioactive elements; fusion is the currently being researched by various laboratories around the world, and produces no radioactive waste and far more energy.

For years nuclear fusion has eluded scientists, yet very recently the researchers at the National Ignition Facility (NIF) in the US have managed to pass a milestone that brings fully sustainable nuclear fusion closer realisation.

The NIF, at the Lawrence Livermore National Laboratory in California, uses 192 beams of the world’s most powerful lasers to deliver a pulse of energy 1000 times the capacity of the entire generating capacity of all power plants in the US combined. The pulse hits a tiny capsule of hydrogen which is then instantly compressed and heated up, creating a small nuclear fusion reaction.

The BBC reports that in September the amount of energy released from the fusion reaction at the NIF was recorded as higher than the energy that was absorbed by the hydrogen fuel pellet. The first time that this has been achieved anywhere in the world.

….read more HERE


These Scream Profit Opportunity!

Candlestick, head-and-shoulders, ascending triangle: If these phrases aren’t familiar to you, you’re missing out on major profit opportunities. Clive Maund, technical trader and editor of CliveMaund.com, shares the tricks of his trade in this interview with The Energy Report. Find out how to recognize potential price swings in commodities and stocks, and discover junior energy companies and ETFs with charts that scream “upside!”

COMPANIES MENTIONED: ANDERSON ENERGY LTD. : ARCAN RESOURCES LTD. : ARTEK EXPLORATION LTD. : CEQUENCE ENERGY LTD. : TORC OIL & GAS LTD.

The Energy Report: Energy prices are very sensitive to international events, especially conflicts in the Middle East. Do your charts factor in the periodic crises that impact oil and gas prices as buy and sell moments? How do you factor in inflation and interest rate movements into your calculations about which energy juniors look like good buys at any given time?

Clive Maund: The charts do factor in periodic crises that impact oil and gas prices as buy and sell moments, but often in a contrary way. The trick is to gauge when a crisis is at its moment of greatest tension, and while this is not at all easy, the charts can often be a great help in defining such a moment. I will give you an example using a recent call on CliveMaund.com, where the top in oil was pinpointed a day after its occurrence. Some readers may remember an old saying used on the London market many years ago, “Buy on a strike.” This refers to a strike by labor, not an oil strike. The underlying psychology of this was that the time of maximum tension and uncertainty, which was when labor unions called the workers out on strike, was the best time to buy stocks, because they would have been falling in anticipation of this, and as tensions later eased as the situation headed to resolution, they would rise again. So it is with conflict and tension situations in the Middle East and their impact on the oil markets.

Some weeks ago, before the surprise announcement by Putin and Syria that chemical weapons would be turned over to international regulatory bodies, the oil price suddenly put in a large prominent “shooting star” candlestick as it made a new high for its uptrend, which we read correctly as a topping signal and a sign that the crisis was about to ease. Once it did, as we know, the oil price dropped away. The fact that it put in such a signal before the announcement is an indication that powerful, well-connected people knew that such an announcement was imminent, and traded on it to their advantage, as is so often the case. We observed their boot prints in the sand and judged the situation accordingly—and correctly, as it turned out.

Inflation is not much of a consideration, as it is built into the prices of just about everything. It really only needs to be taken into account when you are looking at long-term charts. For example, if a stock is priced at $30, and it was at the same price 10 years ago, it is clearly worth less in real terms now than it was back then. With regard to junior energy stocks, I do not pay much attention to inflation in making picks, because as I said above, it is a background factor that is already built into their prices. What matters with interest rates is not so much their actual level but their direction—their trend, and their rate of change. Right now we are at a dangerous juncture, with the Fed fumbling its way forward, trying to keep interest rates low and retain what shreds of credibility it has left.

TER: Please explain how quants like yourself use chart patterns to analyze a stock’s trajectory over time. Can you talk about the meaning of some of the basic chart movement metaphors, such as “head and shoulders” and “candlestick”?

CM: Most of the technical indicators that we use to identify good entry or exit points for stocks are based on plain common sense. Thus, a stock that has been sold into the ground, and has then formed a base pattern, is likely to start a new uptrend and recover as the company’s fundamental situation improves. On the other hand, an overvalued stock that is racing away to the upside and way ahead of its moving averages is much more risky and prone to correct.

Support and resistance zones on a chart are related to “congestion zones” where a large amount of stock has traded close to a particular price in the past. The way it works is this: After a run-up in a stock, a large number of traders take profits, believing the stock has done its thing and could reverse. Then, to their chagrin, it breaks out and rallies to a new high. Having missed the move, they resolve to buy it back if it should come back near to the price at which they sold. Their buying potential puts a floor under the price on the next dip, providing support, which can be identified on charts in advance and utilized for timing purchases. It works the same in the other direction: Traders buy a stock in a trading range, expecting it to break out upside and continue higher, but it does the opposite and breaks down. Rattled by this, they resolve to “get out even” if it should rally near the price at which they bought it. Their selling potential caps the next rally, creating resistance, which again can be identified and used for timing purposes by the technical trader.

It usually takes time for a major uptrend in a stock to reverse into a major downtrend. Think of a stock as a heavy locomotive that needs time to stop and reverse direction. This is why after major uptrends, top areas form, which allow time for the so-called smart money to offload their holdings to the “dumb money.” The duration of the top area is of course also related to the fact that a company’s fortune does not usually change from improving to deteriorating overnight; it is generally a slow process. The smart money uses the cover of glowing news reports and company statements to offload their holdings at top dollar, aware that the good times are going to come to an end.

Such large top patterns can take various forms. One classic form is the dome, where the uptrend decelerates steadily, finally peaks and then starts down again, slowly at first but then accelerating to the downside. These domes are generally parabolic, reflecting the ebb and flow of sentiment. The head-and-shoulders, which is very common, is actually an irregular form of dome top. The rising wedge can be very treacherous for novice traders, who do not recognize that an uptrend channel that is converging is actually petering out—losing upside momentum as buying power fizzles out. When these patterns break down, the result is often a vicious plunge that can devastate investors who don’t see it coming. We spotted this pattern before silver crashed in September 2011 and positioned ourselves accordingly.

Triangles can take three forms: symmetrical, ascending or descending. With a symmetrical triangle, the top line is falling and the bottom line is rising, usually at about the same rate. The symmetrical triangle indicates a market in a state of indecision, and while it is impossible to accurately predict the direction of breakout, it is usually in the direction of the trend preceding the triangle. The “fish head,” a term I invented, is a type of symmetrical triangle, where the oscillations decrease more rapidly than usual, resulting in a curved top and bottom line—its meaning is similar to the normal symmetrical triangle, the chief difference being that the point of indecision is arrived at more quickly, leading to a more rapid breakout.

[Below: Symmetrical triangle formation]

rtksymmtriangle300913

An ascending triangle has a flat top line, with the bottom line rising. [See chart below] A flat bottom linewith the top line falling characterizes a descending triangle. The ascending triangle is bullish as it indicates a situation where buyers are raising their bids. The descending triangle is bearish as is shows that sellers are dropping the price at which they are willing to bail out.

Below: Ascending triangle formation.

AscendingTriangle

Candlestick charting is a fascinating and rewarding aspect of technical analysis, which is based on the fact that price action during an individual day, or a small number of days together, can provide valuable insight into the probable impending direction of a stock. As I said earlier, we used candlestick charting to predict the direction of the oil price before the chemical weapons announcement a few weeks back [see below chart]. In candlestick charting, the relative positions of the open, close and intraday highs and lows of a stock or security on a given day or cluster of days are important factors in determining what is likely to happen next.

[Below: Candlestick formation indicated likely oil price topping point in late September of this year.]

SyriaOil

All these charting techniques enable careful investors to stack the odds in their favor and assist investors in determining when a commodity or stock is at or close to the extreme end of a move and likely to reverse direction or embark on a new trend.

Chart interpretation is an art, not a science, and partly subjective, being based on experience. The emphasis is on being right most of the time, not all of the time (that is impossible), and on limiting damage where judgement proves to be incorrect. The effective use of charts involves determining the probability of envisaged scenarios coming to pass. This does not, however, prevent it from being highly efficacious in many instances. A good example is shown below, where it was determined in July 2008 that oil was set up for a brutal take down, as subsequently proved to be the case:

[Below: Before and after charts of the July 2008 oil price drop, which Maund foresaw through his analysis of 50- and 200-day moving averages.]

post2008oilsmash

pre2008oilsmash

TER: How does the domination of the Middle East by a handful of countries and corporations affect the movement of energy prices?

CM: While big energy companies may be behind wars of acquisition so that they can gain control of oil-rich regions, once they are in and established they generally want stability so that they can get on and pump the oil without interruption to maximize their profits. While price spikes caused by the threats of unrest and war may produce a welcome boost to profits, actual wars that cause destruction of their facilities and disruption of production are not beneficial.

The control of large areas by the majors results in stability, the sort that we have seen in Saudi Arabia for many decades, for example. But the danger with these mega corporations controlling countries and regions, often in bi-lateral arrangements with local governments, is that giant cartels are created that result in price fixing. So we can say that the advantage of the Middle East being in effect controlled by a handful of western mega corporations is price stability and a tendency to political stability, while the disadvantage is the potential for these stable prices to be on the high side, which is of benefit to the junior companies as well. The junior companies might find it hard to get a foothold in such areas, however, because of the dominance of the majors, and are probably better off exploring elsewhere, the exception perhaps being newly opened-up areas like Iraq.

TER: What has been the effect this year of large investment firms covering shorts in the energy markets? Do you have any picks of junior energy firms that might be rebounding?

CM: This has caused a sizeable spike in the price of oil relative to other commodities, and there can be no doubt that Syria had an important role to play in this. However, with Syria apparently cooling, this has opened up downside risk for the sector, because a lot of these large investment firms are now all on one side of the boat. On the other side are the commercials, which are now heavily shorting crude—and they are not renowned for being on the wrong side of the trade. The latest Commitments of Traders (COT) charts for natural gas, on the other hand, look bullish.

There are a few junior energy stocks that look attractive to me at this time, based on their technical picture. The charts indicate that there’s something going on in Anderson Energy Ltd. (AXL:TSX). This stock has been pulverized, dropping from a high at about CA$9 eight years ago to the current very low price of CA$0.15. Aggressive buying caused the price to spike in the middle of the month, but it has since drifted right back again almost to where the spike started. A large bull hammer appeared on September 27, suggesting that it will now start up again. The number of shares in issue is rather large but this is well-factored into the price.

Arcan Resources Ltd. (ARN:TSX.V) staged a powerful, high-volume breakout earlier this month but has since drifted back on declining volume to an attractive entry point, although it could drift a few cents more before turning up. It will need to get above its 200-day moving average before an uptrend can get established, but this could happen quite quickly now. Arcan was trading at more than CA$13/share less than eight years ago, so it’s picking up from a very low level now. The number of shares in issue is an acceptable 97 million (97M).

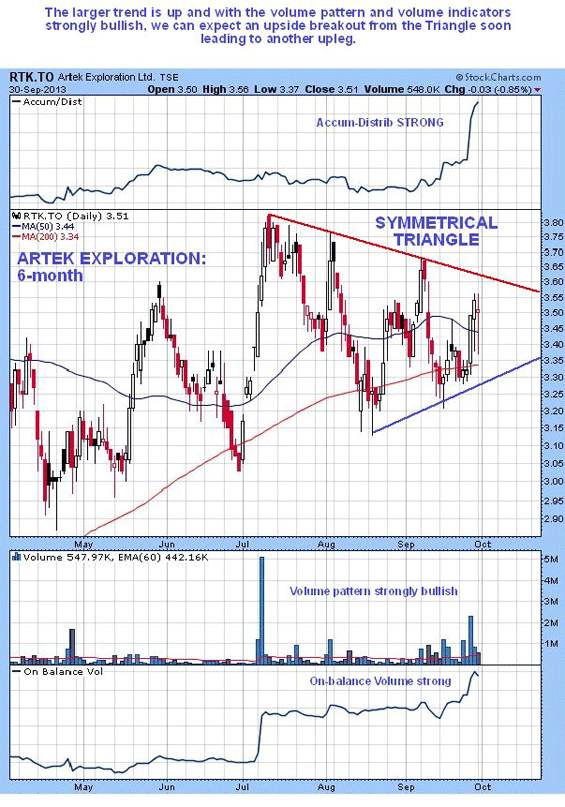
There’s strong upside volume in Artek Exploration Ltd. (RTK:TSX), which appears to have been consolidating for the past year to date. This strong upside volume has already driven volume indicators sharply to new highs, suggesting that an upside breakout is approaching, which will lead to another significant upleg. Shares in issue are a relatively modest 62M.

Cequence Energy Ltd. (CQE:TSX) appears to be bubbling under before making a move higher. We saw aggressive and persistent buying of the stock during the first half of September on high volume, which drove volume indicators sharply higher, but it has since obligingly drifted back to a very good entry point at the support level on much lighter volume. It has been pretty much downhill all the way for Cequence since it started life back in 2007 at the lofty price of CA$14, but the latest technicals show that it is firing up for a significant rally. The number of shares is on the high side at 210M, but again this is already built into the price

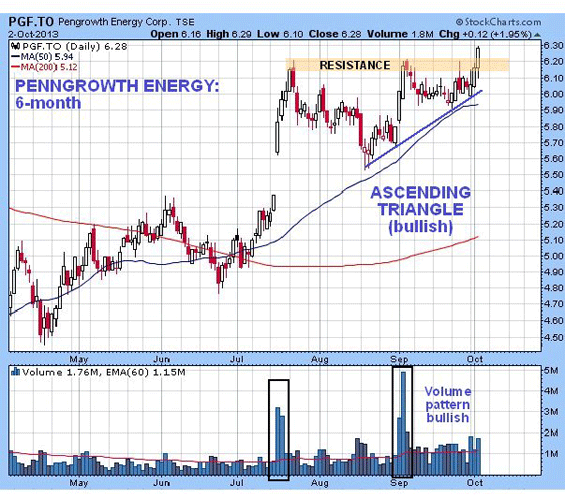
TORC Oil & Gas Ltd. (TOG:TSX) is at a good price here, especially as the volume pattern and volume indicators suggest that it is likely to start an uptrend before much longer. The price has been depressed for several years after falling back from a high over CA$56 in 2008, but recent heavy volume, most of which is upside volume, is a sign that interest is building in this stock. It looks like there is good value here, and the number of shares in issue is an acceptable 91M.

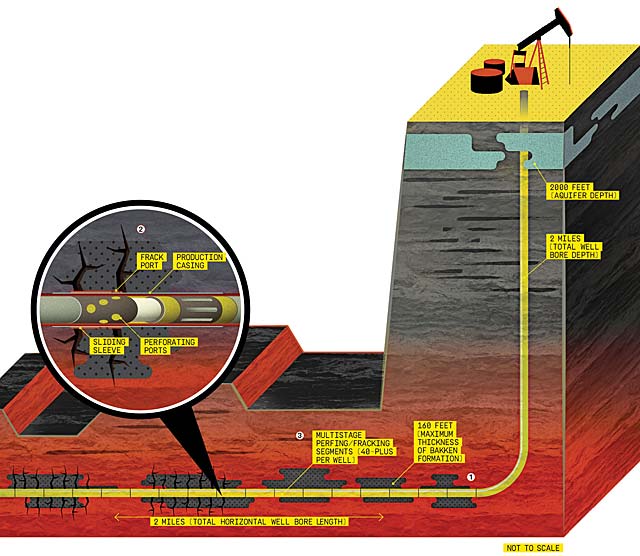
TER: How is the short-term life span of fracked wells affecting stock prices? What is the overall situation for supply and demand in energy markets, worldwide?

CM: We would expect the short-term life span of fracked wells to create a more rapid boom and bust cycle in junior energy stocks, unless a more or less continuous stream of producing wells can be maintained.

The overall supply and demand situation for oil and gas appears to be pretty much in balance, which is why the oil price has been in a trading range for the past two years. We have seen peak oil and the depletion of existing oilfields, but, necessity being the mother of invention as they say, we have also seen ingenious responses to the situation in new ways of looking for oil—for example, a massive field has been found in the Gulf of Mexico using special deep drilling techniques, and we have the polar ice cap melting at the perfect time for exploration to expand there in a big way, although this is not such good news for polar bears, of course.

Oil found in more difficult-to-access places is more expensive, and this is what has encouraged the search for cheaper supplies, resulting in massive discoveries in the U.S. These new supplies look set to take the U.S. toward energy self-sufficiency, which would have been unthinkable just a few short years ago. However, this may also lead to a supply shock that drives prices lower. This is another reason that the bearish-looking oil COT charts are thought to presage a lower price trend, and it is thought that the oil price was given a reprieve in recent months by the Syria crisis. Over a shorter time horizon, traders need to watch out for a slump engendered by rapid economic contraction due to rising interest rates. As we saw in 2008, sometimes macro factors render the fundamentals of the oil industry irrelevant. This might be what the COTs are warning of.

TER: Are energy ETFs a good bet? If so, what kinds?

CM: Energy ETFs are an excellent way to play the energy market. They have three great advantages. One is that the ordinary investor can avoid the possibly cumbersome details involved in trading the actual commodity. The second is that you can also avoid the risk inherent in individual stocks, and the third is that you can make money on the downside, too, by using the inverse ETFs available.

Investors have a choice of leverage with these ETFs. There are straight unleveraged ETFs, which move one-to-one with the underlying commodity or index; twice leveraged, which double your gains if you get the move you are expecting (these are the ones we generally go for); and triple leveraged, which have a high decay factor, due to being “juiced” by options, etc., and therefore should generally only be used by professionals, and even then mainly for hedging, or in rare situations where investors are expecting a big move in a short timeframe.

The following (long) ETFs and ETNs provide a broad choice: First Trust Energy AlphaDEX Fund (FXN:NYSE)Vanguard Energy ETF (VDE:NYSE)iShares S&P Global Energy ETF (IXC:NYSE),iShares Dow Jones U.S. Energy ETF (IYE:NYSE)SPDR S&P Oil & Gas ETF (XOP:NYSE) andPowerShares Dynamic Energy ETF (PXI:NYSE).

In addition, we have the First Trust ISE Revere Natural Gas ETF (FCG:NYSE) and iShares Dow Jones US Oil Equipment & Services ETF (IEZ:NYSE).

Short ETFs and ETNs of note include PowerShares DB Crude Oil Short ETN (SZO:NYSE),PowerShares DB Crude Oil Double Short ETN (DTO:NYSE)ProShares Short Oil & Gas (DDG:NYSE),United States Short Oil Fund (DNO:NYSE) and ProShares Ultrashort DJ-AIG Crude Oil (SCO:NYSE).

TER: Is there an optimum entry point for energy stocks in the foreseeable future?

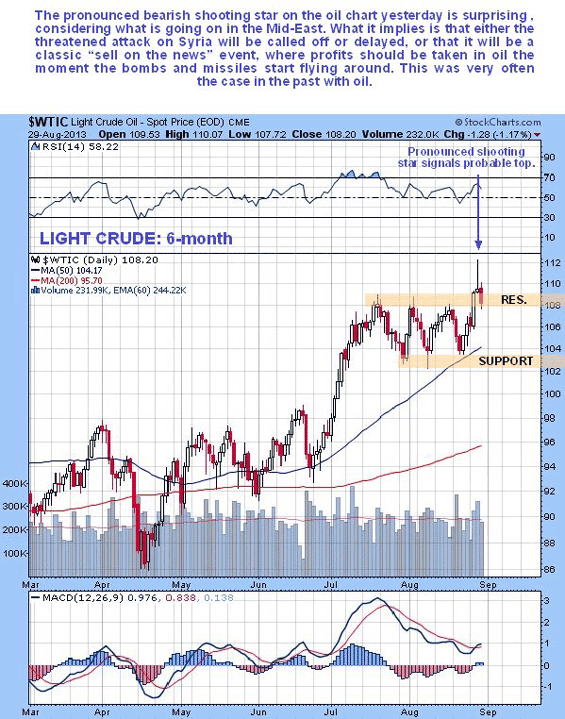
CM: Although technically still in an uptrend, oil stocks as a group have just stalled at resistance and look vulnerable to reversing to the downside soon, especially if the key support for Texas Light at $102 breaks soon, as looks likely. Light crude looks set to drop further back to the high $90-range soon, especially as its latest COT charts look bearish. Military action against Syria looks to have been put on the back burner for now. While there is some support in the 1350 area on the Amex Oil Index, there exists the risk of a deeper reaction back to the 1200–1230 area, where there is significant support, and this reaction could carry considerably further if we see a sharp rise in interest rates. Here we should note that rising rates would likely be accompanied by rising gold and silver prices, as in the late 1970s.

Having said this, many junior energy plays look strong here and set to rise on their own merits, pretty much regardless of what happens to the sector indices and larger oil stocks.

TER: How do currency fluctuations affect oil and gas prices?

CM: Because oil is priced in petrodollars, the key currency to watch in energy pricing is of course the U.S. dollar. Countries that have threatened to cease selling oil and gas in petrodollars, like Iraq and Libya, have paid a heavy price, so we can assume that the U.S. dollar will remain dominant into the foreseeable future, although some countries, like China, are looking for ways to circumvent it. With the Fed maintaining quantitative easing, the dollar is under increasing threat of losing its value, which means that oil and gas prices must move to compensate for a falling dollar.

TER: Thanks you for speaking with us today, Clive.

CM: My pleasure.

Clive Maund has been president of www.clivemaund.com, a successful resource sector website, since its inception in 2003. He has 30 years’ experience in technical analysis and has worked for banks, commodity brokers and stockbrokers in the City of London. He holds a Diploma in Technical Analysis from the UK Society of Technical Analysts. He lives in southern Chile.

Find out how Maund has used technical analysis to make successful precious metals trades in hisinterview with The Gold Report.

Want to read more Energy Report interviews like this? Sign up for our free e-newsletter, and you’ll learn when new articles have been published. To see a list of recent interviews with industry analysts and commentators, visit our Interviews page.

Related Articles


DISCLOSURE: 
1) The following companies mentioned in the interview are sponsors of The Energy Report: None. Streetwise Reports does not accept stock in exchange for its services or as sponsorship payment.
2) Clive Maund: I or my family own shares of the following companies mentioned in this interview: None. I personally or my family am paid by the following companies mentioned in this interview: None. My company has a financial relationship with the following companies mentioned in this interview: None. I was not paid by Streetwise Reports for participating in this interview. Comments and opinions expressed are my own comments and opinions. I had the opportunity to review the interview for accuracy as of the date of the interview and am responsible for the content of the interview. 
3) Interviews are edited for clarity. Streetwise Reports does not make editorial comments or change experts’ statements without their consent.
4) The interview does not constitute investment advice. Each reader is encouraged to consult with his or her individual financial professional and any action a reader takes as a result of information presented here is his or her own responsibility. By opening this page, each reader accepts and agrees to Streetwise Reports’ terms of use and full legal disclaimer.
5) From time to time, Streetwise Reports LLC and its directors, officers, employees or members of their families, as well as persons interviewed for articles and interviews on the site, may have a long or short position in securities mentioned and may make purchases and/or sales of those securities in the open market or otherwise.


Week In Review: Gold Soft, Oil, Wheat Outperform

Oil and wheat outperformed, but most commodities fell this week. Stocks, as measured by the S&P 500, finished the volatile period with an overall loss of less than 1 percent. Year-to-date, the index is up 18.4 percent. 

Macroeconomic Highlights

This week’s news flow was dominated by talk of the first federal government shutdown in nearly 18 years. The shutdown has dragged on for four days and counting, after beginning on Tuesday. Traders are also getting jittery about the approaching debt-ceiling deadline, which the Treasury has said is around Oct. 17.

Most government economic releases have been delayed, including the important monthly nonfarm payrolls report that was originally scheduled for today.

However, we did see a number of private sector releases and other data from around the world. 

China’s manufacturing PMI edged up from 51 to 51.1 in September, slightly below the 51.6 that was expected. At the same time, the equivalent PMI gauge in the eurozone remained unchanged at 51.1 in September, remaining above the key 50 level for a third-straight month, while ISM said that its U.S. manufacturing index rose from 55.7 to 56.2, the strongest level since April 2011.

Meanwhile, payroll processor ADP said that private employers added 166K jobs in September, below the 180K that was expected. 

Lastly, ISM said that its nonmanufacturing composite fell from 58.6 to 54.4 in September, below the 57 that was expected.

Screen Shot 2013-10-04 at 3.55.51 PM

….read page 2 HERE

Shares at “absurdly cheap” Prices

Opining that Fed Chairman Ben Bernanke has put a stake in the heart of the dollar, Bob Moriarty of 321gold advises people to invest in something real or be prepared to see their investments go to money heaven. Attributing many of the declines in share prices to irrational behavior, he tells The Gold Report about several of the bright companies now selling at “absurdly cheap” share prices.

Screen Shot 2013-10-04 at 6.14.14 AMThe Gold Report: Bob, gold prices jumped up on the news that the Federal Reserve would not taper bond buying, then fell days later on news of a possible government shutdown. Did we mark a bottom? Are we in for some more headline-based volatility through the rest of 2013?

Bob Moriarty: Essentially, the news announced on Sept. 18 was Fed Chairman Ben Bernanke putting a stake in the heart of the dollar. He guaranteed its destruction. The move up in gold was a natural, logical move by the shorts to cover.

“The news announced on Sept. 18 was Fed Chairman Ben Bernanke putting a stake in the heart of the dollar.”

Bernanke’s theory that pouring tons of money into the economy will increase employment hasn’t worked since quantitative easing (QE) 1. It is just guaranteeing the destruction of the currency.

I’m not sure what happened on Sept 20. I don’t think gold’s fall that day had anything to do with the government shutting down. I think we had a major bottom in June. Lately, I’m seeing so many bright companies that are so absurdly cheap. It’s a wonderful opportunity for investors.

TGR: Does it matter to the price of gold who chairs the Fed?

BM: No, it doesn’t. It’s similar to asking whether it’s more important whether you die of cancer or of a heart attack.

TGR: You said in an article in 321gold that markets go up and down; you can make a lot of money if you learn to ignore the clutter and noise. How are you adjusting for the volatility in the market today?

BM: Volatility doesn’t bother me. The small, vocal group that has been screaming about gold and silver being manipulated is ignoring the fact that all financial markets are manipulated. The manipulation doesn’t make any difference. It doesn’t give you a buy signal or a sell signal.

We have had extraordinary extremes and bullishness for the Dow and the S&P 500 and extraordinary extremes and bearishness for gold, silver and platinum. You just have to ignore the noise.

The people claiming a manipulation/conspiracy have convinced a lot of people that markets are never supposed to go down. Gold is a good investment and it’s supposed to go up every single day, they said.

Gold is a good investment, but it’s not supposed to go up every single day. No market goes up every single day. It’s not manipulation when markets go down.

TGR: You spent much of the summer touring mine sites. Tell us what got you excited.

BM: Just today I talked with the management and the technical teams at Cayden Resources Inc. (CYD:TSX.V; CDKNF:NASDAQ). When I wrote about the company in May, the stock price was $0.72. It’s around $1.65 today. The stock was cheap at $0.72 and it’s cheap today. This could be a $30 stock. It’s an extraordinary opportunity.

“Lately, I’m seeing so many bright companies that are so absurdly cheap. It’s a wonderful opportunity for investors.” 

Cayden has two homeruns. One is Morelos Sur, a project in the Guerrero Gold Belt, in between two gold mines owned by Goldcorp Inc. (G:TSX; GG:NYSE). Unless Goldcorp buys the Cayden project, it will lose 2–3 million ounces (2–3 Moz) of gold. It’s only a question of how much Goldcorp will pay for it. I used to believe it would be $42 million ($42M). Now, it looks as if it will be $100–200M, depending on the price of gold. As of today, Cayden has a total market cap of $70M and an enterprise value of $55M. Yet it could get a check from Goldcorp for $2.50 to $5 a share. The current price is simply nuts.

Cayden also has a project in Jalisco that had been mined before, El Barqueño. The company just started drilling and I think the results will be extraordinary. In May, I predicted it would be a 5 Moz project. I now believe this will be a whole new district.

TGR: Cayden just filed an updated technical report on the Morelos Sur and El Barqueño projects. Did that give you the results you were hoping for?

BM: No, because the technical reports were technical in nature. They didn’t address the resource. What the reports said was true, but it’s not meaningful. When Cayden releases drill results in mid-October, I expect intercepts of 70–100 meters (70–100m) of 3+ grams per ton (3+ g/t) material.

A lot of majors are looking at Cayden right now. This will be one of the major successes of 2013.

TGR: What other companies did you see in Mexico?

BM: I also visited Silver Bull Resources Inc. (SVB:TSX; SVBL:NYSE.MKT). Silver Bull has a really unusual deposit. Silver is a very reactive metal. It’s very common in the silver-gold system to have near-surface silver oxidize and get washed away. There will be lots of gold, but no silver at surface. The majority of this deposit is silver oxide.

TGR: Silver Bull uses its SART (Sulfidization, Acidification, Recycling and Thickening) process for extracting silver and zinc. Once the feasibility of the metallurgy is proven, would this company also be a takeover target?

BM: Absolutely. You have to process silver oxide differently than silver sulfides. It’s very typical in a heap leach to have 50% or 60% recovery of silver. You could recover more if you used more cyanide, but that costs money and in most cases it’s not worth it. The SART process recovers cyanide. While it’s not a cheap process for Silver Bull, it will be a very important technical issue. In the next six months, when the silver price goes through $25/oz, I expect an offer for Silver Bull will be considerably higher than the stock is now.

TGR: You also spent a week in Nevada. What did you see there?

BM: I went to see a project I first visited 12 years ago called Kinsley Mountain, owned by Pilot Gold Inc. (PLG:TSX). It was first put into production in 1994 and went out of production in 1999.

“Gold is a good investment, but it’s not supposed to go up every single day. No market goes up every single day.”

Kinsley Mountain is one of those projects that may be a Long Canyon-type project—which would be 2, 5, even 10 Moz—or not. Even if it’s not a Long Canyon, it would still be 500,000 oz (500 Koz), and could still sell. It won’t cost Pilot Gold anything to drill, because the company can recover the money.

Pilot’s management team is the best in the industry, with most members coming from Fronteer Gold. When Newmont Mining Corp. (NEM:NYSE) bought Fronteer out for $2.3 billion ($2.3B), it was an absolute homerun for shareholders. Pilot is doing the same thing. You’re buying at a 60% discount to what it was nine months ago.

A year ago, I visited Pilot Gold’s projects in Turkey. One is a copper-gold porphyry; the other is a gold-silver epithermal system. Both were very attractive and had great technical success and great drill results. The stock went from $1.30 last year to $2.40 in January 2013. Then, it got knocked down to about $0.71. After the shenanigans of last week, it was up to $1.10 and it’s back below $1 now.

It’s important for your readers to understand that the decline in shares since January has not been rational. Nor has it been manipulation or shorting. It’s been hedge funds and gold mutual funds being forced to sell shares. Often, they sold the best projects just because they could. They needed cash and sold everything they could to raise it.

TGR: Where is Pilot Gold’s focus, in Turkey or Nevada?

BM: It’s focused on both locations and all three projects. The company’s joint venture with Teck Resources Ltd. (TCK:TSX; TCK:NYSE) on the big porphyry project in Turkey is in a holding pattern. It’s not attractive at $3/lb copper, but it’s very attractive at $4/lb copper.

The company is drilling the heck out of the TV Tower project and Kinsley Mountain. It has plenty of cash and an incredible ability to raise money.

TGR: What else did you see in Nevada, Bob?

BM: There are three projects in the Walker Lane Trend, which runs parallel to the Nevada/California/Arizona border, between Las Vegas and Reno. The Comstock Lode and Round Mountain gold mines are both in the Walker Lane Trend.

I visited Star Gold Corp. (SRGZ:OTCQB), which is extremely tightly held. The company is moving forward with production plans for 2016. The repetitive drill-and-raise-money approach has proven to be a flawed business model. Star Gold’s management wants to get into production. The company has 250 Koz gold that can be heap leached.

One of my suggestions to management was that the company needed to be a little more liquid so people could buy and sell. I hope it will do that. The company is doing a $1M placement now. I think it will do fine.

I also visited Walker River Resources Corp. (WRR:TSX.V). Its Lapon Canyon high-grade gold project had been privately held for about 70 years, and nothing had been done in that time. The company went public in July 2012. Walker River has good grades and a good technical team. It has a very tight share structure and very small number of shares.

Star Gold is going after the low-grade, bulk tonnage and Walker River is going after the high-grade vein structures. I think both will succeed. Both are focused on production.

TGR: How will companies in these historic areas succeed when others couldn’t before? Is it new technology? Is it the price of gold?

BM: Both Walker River and Star Gold are projects that have never been drill tested.

At Round Mountain, the most gold is found in type 2 rock, which is volcanic tuffs, similar to a sponge. It’s very easy rock to leach. The liquid containing the gold goes through the rock and the gold that’s left is very easy to mine.

Star Gold has a bigger percentage of type 2 rock than Round Mountain, which makes the company attractive. I like the idea of getting into production cheaply. The company has a very loyal, very tight group of shareholders. The only proviso is that the stock will be very difficult to buy.

Walker River, on the other hand, has about 15M shares outstanding, selling for about $0.15/share. It easily has tenbagger potential and it is easy to buy and sell.

TGR: Anything else in Nevada?

BM: I talked to the technical team from NuLegacy Gold Corporation (NUG:TSX.V). It is near Elko and has a joint venture with Barrick Gold Corp. (ABX:TSX; ABX:NYSE). NuLegacy has 70% of the project; Barrick 30%. NuLegacy has $5M to spend in a certain period of time. The company has spent about half and has produced very attractive results.

Management has to figure out a strategic issue: Does it want Barrick to back in or not? If Barrick backs in, Barrick will have to spend three times what NuLegacy spent; it will have to spend $15M in a five-year period and NuLegacy would get a 30% carried interest to production. In effect, NuLegacy would get a free ride. From a strategic point of view that’s brilliant; Barrick puts the mine into production and NuLegacy gets 30%.

The problem is that NuLegacy could go for several years with no news for investors. That hurts the share price. The alternative is for NuLegacy to drill some areas that are not that good to discourage Barrick, in which case NuLegacy would get 70%.

NuLegacy gets a homerun at 70% or 30%. How aggressively the company drills is the technical issue right now.

TGR: I visited there a year ago and the big topic of conversation was being in a trend with visual lines of sight to working gold mines. There are many trends in Nevada; are they turning out to be good indicators of where gold is being found?

BM: In Star Gold’s case, absolutely, but that’s not always true.

Walker Lane is hundreds of miles long. Ninety percent of it doesn’t hold much, but 10% holds something very, very good.

TGR: Are you following other Nevada companies?

BM: There is Comstock Mining Inc. (LODE:NYSE.MKT), which continues to produce. The company is growing, adding to its resource. It produces 25 Koz of gold equivalent. It needs to increase that to do something for the shareholders.

TGR: What about outside Nevada?

BM: Resource nationalization has produced some interesting results. Gold companies deliberately, and mistakenly, underestimated their costs of production. When countries like Mongolia, Tanzania, Peru, Bolivia and Ecuador saw the gold price hit $1,900/oz, they reacted by saying, “These companies are making so much money, we need to take a big chunk of it.” As a result, there have been tens of billions of dollars in write-offs.

Kinross Gold Corp. (K:TSX; KGC:NYSE) wrote off $2.3B in Ecuador because the Ecuadorean government demanded 80% of the project. Kinross said that it funds 100% of the mine, so if it gives 80% to the government, it can’t make any money. The government didn’t budge. Kinross walked away. That was a smart move on its part.

TGR: Which countries not experiencing resource nationalization would you rather be in?

BM: The location of a resource is increasingly important. The top three safest jurisdictions in order are probably Canada, Mexico and the U.S.

You need to remember that every country in the world has been spending money that it doesn’t have. They are broke. The entire financial system is broke. Governments are doing whatever they can to beg, borrow or steal money. In the case of resource nationalization, they’re going to steal it. What they’re doing is long-term negative for the countries, but they don’t care.

TGR: Is that the case in Peru?

BM: Peru keeps making noises, but mining is the number one industry in Peru. I visited Peruvian Precious Metals Corp. (PPX:TSX.V; PPX:BVL), but it was called Sienna Gold when I was there. It needs to raise money and do more drilling in a difficult environment, in a difficult country. But the management is strong and it can deliver.

TGR: The company needs to show technical results and rebrand the company to regain trust in management, correct?

BM: Absolutely correct. The prior management was utterly incompetent.

But I must say that for the last two years it’s been very difficult for anyone to raise money. The good companies, like Cayden, Pilot Gold and Almaden Minerals Ltd. (AMM:TSX; AAU:NYSE), have such strong management that they can raise money. But they’re paying a price. It’s not cheap.

TGR: Where else have your travels taken you?

BM: Recently I made another quick trip to Chile to visit an interesting company listed in Australia namedHot Chili Ltd. (HCH:ASX). It is a production oriented company. The biggest problem in the copper arena right now is the number of low-grade, high-capex projects. There is a world of projects needing in excess of a billion dollars that work at $4/lb copper but not at $2.50/lb copper.

Hot Chili pulled off a coup in Chile in the middle of the Atacama Desert. Chile is an interesting country to work in. In 1970 the government nationalized the biggest copper mines and distributed the most potential copper ground to the state copper company, CODELCO, and the state iron company, CAP S.A. Small mines were left to the existing small owners and operators. In the case of what Hot Chili has named the La Productora project there was a core, high-grade copper mine surrounded by both CODELCO and CAP S.A. Ground. Hot Chili recognized that if all three segments were put together, they could have a large, high-grade copper project right in the middle of existing infrastructure. It took years but Hot Chili put it together and did deals with all three parties.

Hot Chili nearly doubled its resource in 2013 with a Joint Ore Reserves Committee (JORC) resource of 165 million tonnes (165 Mt) of mineralization and a high-grade core of 53 Mt. The company is in the midst of a 100,000-meter drill program and intends to complete another resource upgrade in late 2013. It is moving forward with the intent to go into production in 2017 with both copper and iron. The project has a low capex required of between $500M and $700M. The company is fully funded.

TGR: You’ve talked before about Mundoro Capital Inc. (MUN:TSX.V). It recently released trench sample results on a project in Serbia. Were you surprised when the stock price went down?

BM: Yes, I was. Mundoro had $0.36/share of cash when it started its drill program. Now, you can buy the shares for $0.30/share. You’re paying nothing for the deposit. The company has good management and an extraordinary technical team. It trenched 12m at 30 g/t gold. Then the gold price went down.

TGR: Is this a situation where, if the gold price goes up, the stock price will rise as well?

BM: Here’s what’s crazy. You’re buying dollar bills for $0.90 and investors don’t want to do it. That is as close to an absolutely sure sign of a bottom I’ve ever seen. It happened in 2001 and in 2008. It’s happening now and it’s utterly irrational.

TGR: Normally, gold prices go back up cyclically in the fall. Does that trend still apply or is the price all over the place because we had a bumpy summer?

BM: We did have a very rough summer, with a low for gold and gold shares at the end of June. I think we’ve seen a bottom.

Everybody is terrified of buying gold. That’s totally nuts. Everybody should run to the bank, take out all their money and put it in gold.

TGR: That sounds like the perfect ending for a Gold Report interview. Thanks for your time and insights.

Bob Moriarty and Barb Moriarty brought 321gold.com to the Internet almost 10 years ago. They later added 321energy.com to cover oil, natural gas, gasoline, coal, solar, wind and nuclear energy. Both sites feature articles, editorial opinions, pricing figures and updates on current events affecting both sectors. Previously, Bob was a Marine F-4B and O-1 pilot with more than 820 missions in Vietnam. He holds 14 international aviation records.

Want to read more Gold Report interviews like this? Sign up for our free e-newsletter, and you’ll learn when new articles have been published. To see a list of recent interviews with industry analysts and commentators, visit our Streetwise Interviews page.

Related Articles


DISCLOSURE: 
1) JT Long conducted this interview for The Gold Report and provides services to The Gold Report as an employee. She or her family own shares of the following companies mentioned in this interview: None.
2) The following companies mentioned in the interview are sponsors of The Gold Report: Almaden Minerals Inc., Cayden Resources Inc., Goldcorp Inc., Silver Bull Resources Inc., Pilot Gold Inc., Walker River Resources Corp., Peruvian Precious Metals Corp., Comstock Mining Inc., Hot Chili Ltd. and Mundoro Capital Inc. Streetwise Reports does not accept stock in exchange for its services or as sponsorship payment.
3) Bob Moriarty: I or my family own shares of the following companies mentioned in this interview: Walker River Resources Corp. and Star Gold Corp. I personally am or my family is paid by the following companies mentioned in this interview: None. My company has a financial relationship with the following companies mentioned in this interview: Cayden Resources Inc., Silver Bull Resources Inc., Pilot Gold Inc., Walker River Resources Corp., Star Gold Corp. and Mundoro Capital Inc. I was not paid by Streetwise Reports for participating in this interview. Comments and opinions expressed are my own comments and opinions. I had the opportunity to review the interview for accuracy as of the date of the interview and am responsible for the content of the interview. 
4) Interviews are edited for clarity. Streetwise Reports does not make editorial comments or change experts’ statements without their consent. 
5) The interview does not constitute investment advice. Each reader is encouraged to consult with his or her individual financial professional and any action a reader takes as a result of information presented here is his or her own responsibility. By opening this page, each reader accepts and agrees to Streetwise Reports’ terms of use and full legal disclaimer.
6) From time to time, Streetwise Reports LLC and its directors, officers, employees or members of their families, as well as persons interviewed for articles and interviews on the site, may have a long or short position in securities mentioned and may make purchases and/or sales of those securities in the open market or otherwise.


Shale boom, just getting started

fracking-the-bakken-0612-deThanks to the shale boom, markets already perceive the trade balance optimizing, energy prices are cheaper than they would otherwise be and we’ve even cut carbon emissions. And we are only getting started, according Tyler Cowen, New York Times best-selling author and one of the most influential economists of the decade.

While we aren’t likely to get past the American public’s irrationality over gas prices at the pump and their confusion about why this hasn’t translated into lower gas prices, that doesn’t change the fact that our shale boom is only just beginning to affect the global economy. The only question is who will be the next to latch on to this revolution.

Cowen gives us the long view in his most recent book,“Average is Over: Powering America Beyond the Age of Great Stagnation”, and in an exclusive interview with Oilprice.com, he discusses:

•    Why energy-intensive investment is our real future
•    Why peak oil isn’t an issue for at least 3 decades
•    Why Syria is impossible to predict
•    Why US gas exports are a win-win situation
•    How the US shale boom has benefited the economy
•    How the shale boom is just getting started
•    What the general public doesn’t get about gas prices
•    Why we can’t do much to stop energy market manipulation
•    Who’s right about climate change? Wait and see…

Interview by James Stafford of Oilprice.com

Oilprice.com: You have written at length about “Great Stagnation” and its relation to technology and natural resources. How do we trace the “Great Stagnation”, and are we seeing the end of our unexploited natural resources?

Tyler Cowen: The Great Stagnation first shows up in the data in 1973, when income growth slows and productivity growth falters. It’s hard to avoid the conclusion that this has something to do with the end of the age of cheap energy. In my view sustainable economic growth is more dependent on energy than the share of the energy sector in GDP would indicate. Energy-intensive investments are more likely to build for our future, compared to the productivity mess known as our service sector.

I do not, however, think we are seeing the end of unexploited natural resources – just look at fracking. But every now and then we take a pause before extraction technologies race ahead once again. We’ve been living in that pause for much of the last 40 years–a scary thought.

Oilprice.com: Should we still be talking about “Peak Oil”?  

Tyler Cowen: I don’t see “peak fossil fuel” being a binding constraint over most of the next 30 years.  That said, new supplies take a while to come to market, and the global economy is still constrained by oil supply scarcity. This was evident during the price spike dating from the time of chaos in Libya. There just wasn’t enough oil for the global economy to manage a higher growth rate, and only now is the US economy moving beyond that constraint. India still faces it.

Oilprice.com: There are rival theories concerning what a potential US direct intervention in Syria would do to oil prices. How do you see this playing out?   

Tyler Cowen: It would depend what we do and when we do it, and in any case I don’t see this as an easy matter to predict. Perhaps the best prediction is that the situation festers and we don’t have a direct US intervention at all.  

Oilprice.com: Does the conflict in Libya provide us with insight into what would happen to oil prices in the event of a US intervention in Syria?  

Tyler Cowen: As mentioned above, the price experience and the growth slowdown from the Libyan crisis is far from encouraging. As for Syria, China would very much like to see a peaceful resolution of this entire situation and they do not care per se who comes out on top. Since the US and China want in broad terms the same thing from this conflict, there is a good chance that can happen.

Oilprice.com: As the debate continues over whether the US should export unlimited natural gas or keep it at home, what would be better for the US economy over the long-run, and why?  

Tyler Cowen: Trade benefits both nations. And it will encourage the supply of gas all the more in the longer run. This is a win-win, and I see no good reason to restrict exports.

Oilprice.com: Approvals for US LNG export projects appear to be picking up momentum. Has the export question already been decided?  

Tyler Cowen: The overall record of the US federal government is pro-business and pro-export, and I see no reason to bet against that record this time around.

Oilprice.com: How has the US shale revolution affected the American economy?  

Tyler Cowen: Our trade balance will be coming into order and markets already see this.  Energy prices are cheaper than they would be. We’ve even cut carbon emissions, unexpectedly.

Oilprice.com: What the general public remains confused about is why gas prices are so high amidst this shale boom. How do we address this on a level that is accessible to a general audience?

Tyler Cowen: The shale boom is just getting started, most of all on a global level. And a lot of complicated substitutions are required for shale gas to lower retail gasoline prices, for instance greater use of gas to power transportation. The US public never has been very rational about the price of gasoline, and don’t expect that to change anytime soon.  Gasoline is a price which we see and pay very often, too often. That means voters remember it all too well.

Oilprice.com: How has the US shale boom affected the global economy, and how will US exports play into this?  

Tyler Cowen: Our shale boom is only starting to affect the global economy. The question is who else will follow suit. Russia?  Argentina?  Poland? We will see, but I expect a lot more supply to come on line.

Oilprice.com: In the world of finance and banking, energy market manipulation has become a hot topic, most recently with the scandal around JPMorgan. How does this style of energy market manipulation affect consumers?  

Tyler Cowen: Not much at all.

Oilprice.com: Is this a trend we can’t stop?

Tyler Cowen: We can’t stop it easily. Consumers are not really the losers here, rather some traders benefit at the expense of others. There is more churn than we would like to have in prices and short-term inventories. That’s a problem, but pretty far down on my list of worries.

Oilprice.com: On a social level, with the fashion for choosing to become a banker rather than, for instance, an engineer, are things like market manipulation becoming … acceptable-a sexier sort of crime?

Tyler Cowen: Finance is still where the big money is, though for fewer people than before.  This is perhaps slightly encouraging, as I would rather see more top minds go into science, engineering, and other fields. But in finance a smart young person can make a mark quickly, more so than in most sciences or businesses (tech aside) so finance will remain a big draw for young talent.

Oilprice.com: As the “debate” over climate change has taken on polarizing political proportions, it’s better to ask an economist. How can climate change affect the economy?

Tyler Cowen: We’re going to find out, I have to say.

Tyler Cowen is the Holbert L. Harris Professor of Economics at George Mason University and General Director of the Mercatus Center. He received his PhD in economics from Harvard University in 1987. His book The Great Stagnation: How America Ate the Low-Hanging Fruit of Modern History, Got Sick, and Will (Eventually) Feel Better was a New York Times best-seller. He was recently named in an Economist poll as one of the most influential economists of the last decade and last year Bloomberg BusinessWeek dubbed him “America’s Hottest Economist.” Foreign Policy magazine named him as one of its “Top 100 Global Thinkers” of 2011. He co-writes a blog at www.marginalrevolution.com and has recently inaugurated an on-line education project, MRUniversity.com.