
Energy & Commodities
China’s virtual monopoly on rare earth elements used in high-technology applications has been loosened, reducing the risk that supplies to U.S. defense contractors could be disrupted, according to the Pentagon’s latest assessment of the nation’s industrial base.“Global market forces are leading to positive changes in rare earth supply chains, and a sufficient supply of most of these materials likely will be available to the defense industrial base,” according to the Pentagon report by Elana Broitman, the Defense Department’s top official on the U.S. industrial base. “Prices for most rare earth oxides and metals have declined approximately 60 percent from their peaks in the summer of 2011.”
Rare earths are 17 chemically similar elements used in products from Apple Inc.’s (AAPL) iPads and hybrid-electric cars to smart bombs and Tomahawk cruise missiles made by Raytheon Co. (RTN)
“An increase in supply of material from outside of China” and the substitution of other substances have reduced reliance on China since 2011, when it controlled 95 percent of the world’s supply and imposed export restrictions, said the report, which was sent to Congress last week.
Congress in 2011 required the Pentagon to examine the use of rare earth materials in defense applications, determine if non-U.S. supplies might be disrupted, and suggest ways to ensure long-term availability, as well as secure an assured source of supply by 2015.
….full article HERE

Further Declines or Rally in Oil Stocks?
In our previous commentary, we examined the situation in oil stocks. Back then, we wrote in the summary:
(…) the outlook for oil stocks remains bullish and the uptrend is not threatened, however, taking into account the medium- and short-term sell signals, further deterioration should not surprise us.
Since that essay was published, we have seen a downward move which took the oil stock index below 1,440. Did this weakness change anything in the overall outlook? Before we try to answer this question, we’ll examine the NYSE Arca Oil Index (XOI) in different time horizons and find out if there’s something on the horizon that could drive oil stocks higher or lower in the near future. Let’s start with the long-term chart (charts courtesy by http://stockcharts.com).
On the above chart, we see that the situation has deteriorated recently. The oil stock index extended its declines and dropped below the upper line of the rising wedge. From this perspective the breakout that we saw in October was invalidated, which is a strong bearish signal and we may see further deterioration.
To see the current situation more clearly, let’s zoom in on our picture and move on to the weekly chart.
In our last essay on oil stocks from Dec. 12, 2013, we wrote the following:
(…) the position of the RSI and the sell signals generated by two other indicators, encouraged sellers to act and triggered further deterioration this week. (…) the upper line of the rising wedge was broken, therefore, the first target for the sellers will be around 1,439, where the bottom of the previous correction is.
Looking at the above chart, we see that the XOI reached its target in the previous week. With this downward move, the oil stock index reached the medium-term support line based on the June and November 2012 lows, which had successfully stopped declines earlier this year. We saw such situations in June, August and also in October. From this perspective, if history repeats itself once again, we may see similar price action this (or next) week. Nevertheless, this time, before we see higher values of the XOI, the buyers will have to break above the upper line of the rising wedge, which serves as major medium-term resistance (currently around 1,463). If they manage to do that, we may see an upward move to at least 1,483 where the resistance level created by the previously-broken 2013 high is. The next upside target will be the psychological barrier of 1,500.
What could happen if the buyers fail? If the sellers push the XOI below the medium-term support line, we will likely see further deterioration and the downside target will be the psychological barrier of 1,400. If it’s broken, the next target will be around 1,376, where the bottom of the Sept.-Oct. correction is.
From the technical point of view, the medium-term uptrend remains in place at the moment, and the situation is still bullish.
Now, let’s turn to the daily chart.
Looking at the above chart, we see that the XOI declined in the previous week once again and dropped below the bottom of the corrective move that we saw at the beginning of November (at 1,439). In this way, the oil stock index also slipped below the upper line of the rising wedge (marked with the black thin line) and two medium-term support lines (the upper one is based on the June and August lows and the lower one is created by the June and October lows). However, when we take a closer look at the chart, we see that the XOI reversed course after reaching the 38.2% Fibonacci retracement level based on the entire June-November rally. As you can see on the daily chart, this support encouraged buyers to act, and resulted in an upswing, which push the index above the May high.
Despite this growth, the combination of the previously-broken upper medium-term rising support line and the upper line of the rising wedge stopped further improvement and the XOI closed Monday below this resistance zone. If the buyers do not give up and the oil stock index comes back above this line, we may see an upward corrective move to at least 1,456-1,461 where the 50-day moving average and the previously-broken neck line of the head and shoulders pattern are. On the other hand, if the buyers fail, we will likely see a pullback to the lower rising support line (currently around 1,435) or even to the Friday low at 1,421.
Summing up, from the long-, medium- and short-term perspectives, the situation has deteriorated. We saw an invalidation of the long-term breakout (which is a bearish signal). On the other hand, oil stocks reached very a important medium-term support line based on the June and November 2012 lows, which had successfully stopped declines earlier this year. Additionally, the XOI reached the 38.2% Fibonacci retracement level based on the entire June-November rally, which suggests that the sentiment for oil stocks may turn positive in the near future.
Thank you.
Nadia Simmons
Sunshine Profits‘ Crude Oil Expert
Canada intends to lay claim to the North Pole as part of a bid to assert control over a large part of the resource-rich Arctic, Foreign Minister John Baird said on Monday.
Baird said Canada had filed a preliminary submission to a special United Nations commission collecting competing claims and would be submitting more data later.
The move could raise tensions with Denmark and Russia, both of which also look set to lay claim to the North Pole on the grounds it lies on a continental shelf they control.
“We have asked our officials and scientists to do additional and necessary work to ensure that a submission for the full extent of the continental shelf in the Arctic includes Canada’s claim to the North Pole,” Baird told reporters.
Canada, Russia, Denmark, Norway and the United States are all keen to control as much as they can of a region the U.S. Geological Survey says contains 30 percent of the world’s undiscovered natural gas and 15 percent of oil.
A Russian submarine planted a flag on the North Pole sea bed in 2007.
“Obtaining international recognition for the outer limits of our continental shelf … will be vital to the future development of Canada’s offshore resources,” said Baird.
“Canada is going to fight to assert its sovereignty in the north but I think we will be good neighbors in doing so.”
Russia, Canada and Denmark all say an underwater mountain range known as the Lomonosov Ridge, which stretches 1,800 km (1,120 miles) across the pole under the Arctic Sea, is part of their own landmass.
Baird said Canada needed more time to file a final submission to the U.N. commission because it had not had time to fully map the area around the ridge.
(Reporting by David Ljunggren; Editing by Cynthia Osterman)

 On November 19th at National Economists Club Annual Dinner Bernanke gave a speech which could be seen as a sort of testimony or farewell (probably one of many coming soon). The message he has sent was in perfect compliance with what was being communicating to the public. Firstly he offered a “forward guidance”, which was to reassure us that low short term interest rates are here to stay for the longer term. The possible boundary line, as we repeatedly heard, is lower unemployment and/or significantly higher inflation rate. Until then we are still in the ZIRP – zero interest rate policy – scenario.
Years ago it was supposed by many that unusually low interest rate levels were introduced as a temporary measure to combat recession. At first it was supposed to be for “some time”, then an “extended period”. It did not take a long to hear it’s going be 2013, then late 2014, and finally mid-2015. Since the public eventually got tired of this temporary (6-year!) low interest rate policy, we switched to qualitative signals. The interest stays low until things get better for labor markets and/or for inflation.
Yet even if we reach such levels, in Bernanke’s own words: we are in the realm of “thresholds, not triggers. Crossing one of the thresholds will not automatically give rise to an increase in the federal funds rate target; instead, it will signal only that it is appropriate for the Committee to begin considering whether an increase in the target is warranted.” Therefore even though recent official numbers of employed look very optimistic, it does not lead us to tighter monetary policy. At least not yet.
Bernanke is trying to reaffirm us that interest rate hikes are far, far away on the horizon. No tightening is to be seen anywhere soon. And just like Dennis Lockhart he is dehomogenizing interest rates policies and asset purchases. Therefore the “tapering” could happen even with a very expansionary monetary policy. Both of those tools are to achieve the same end: boosting the banking system and supplying more cheap money for it. Low long-term interest rates allow (in theory) for money debt issuance and more returns for those supplying the debt. Lower long interest rates are to be created by the Fed’s short-term rates, mostly through expectations. If people constantly expect low short-term future rates, this should be discounted, or in some way included, in the longer rates.
This we did not see. Therefore the Fed triggers another, now very famous, channel of QE: asset purchasing. This also is supposed to lower longer rates, but differently. If the Fed buys some of the assets from the market, less is available for the rest of the investors. Therefore scarcity of those assets is about to bid up their prices, ergo decrease the expected returns on them (higher expected returns are of course the same as longer term interest rates).
Even though those two tools have similar effects on the market interest rates, they are not viewed as equivalent. It is possible that one of those policy tools may be tapered. Yet it does not mean that easy monetary policy is over. Even with currently rising employment levels. Stay tuned.
Thank you.
Matt Machaj, PhD
Sunshine Profits‘ Market Overview Editor
U.S. equities outperformed commodities this year by a long shot, but commodities have a good chance to regain investor favor in 2014 after three consecutive years of declines.
“Something has got to give in 2014,” said Phil Flynn, senior market analyst at the Price Futures Group in Chicago.
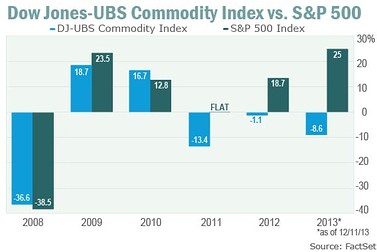
As the investing game draws to an end for the year, the near final score is: commodities down roughly 9%, based on the Dow Jones-UBS Commodity Index. The Dow Jones-UBS Commodity Index Total Return Exchange-Traded Note has lost 10% year to date. The S&P 500 Index, on the other hand, has surged 25%, on track for its best year since 2003.
“Based off historical norms, either stocks are way too high or commodities are way too low. The odds are high for either a massive commodity rally or a rather large stock market selloff,” said Flynn.
This year will mark a third year in a row in which commodities have underperformed U.S. equities. Including 2013, the Dow-Jones UBS Commodity Index has fallen for each of the last three years, as the S&P 500 Index scored significant gains over the past two.
….read more HERE

-
I know Mike is a very solid investor and respect his opinions very much. So if he says pay attention to this or that - I will.
~ Dale G.
-
I've started managing my own investments so view Michael's site as a one-stop shop from which to get information and perspectives.
~ Dave E.
-
Michael offers easy reading, honest, common sense information that anyone can use in a practical manner.
~ der_al.
-
A sane voice in a scrambled investment world.
~ Ed R.
Inside Edge Pro Contributors

Greg Weldon

Josef Schachter

Tyler Bollhorn

Ryan Irvine

Paul Beattie

Martin Straith

Patrick Ceresna

Mark Leibovit

James Thorne

Victor Adair